
As I sifted through today's scan results (hundreds again today), I noticed a few industry groups that were showing up frequently within the results. These four industry groups are picking up momentum so I found a stock in each for your review.
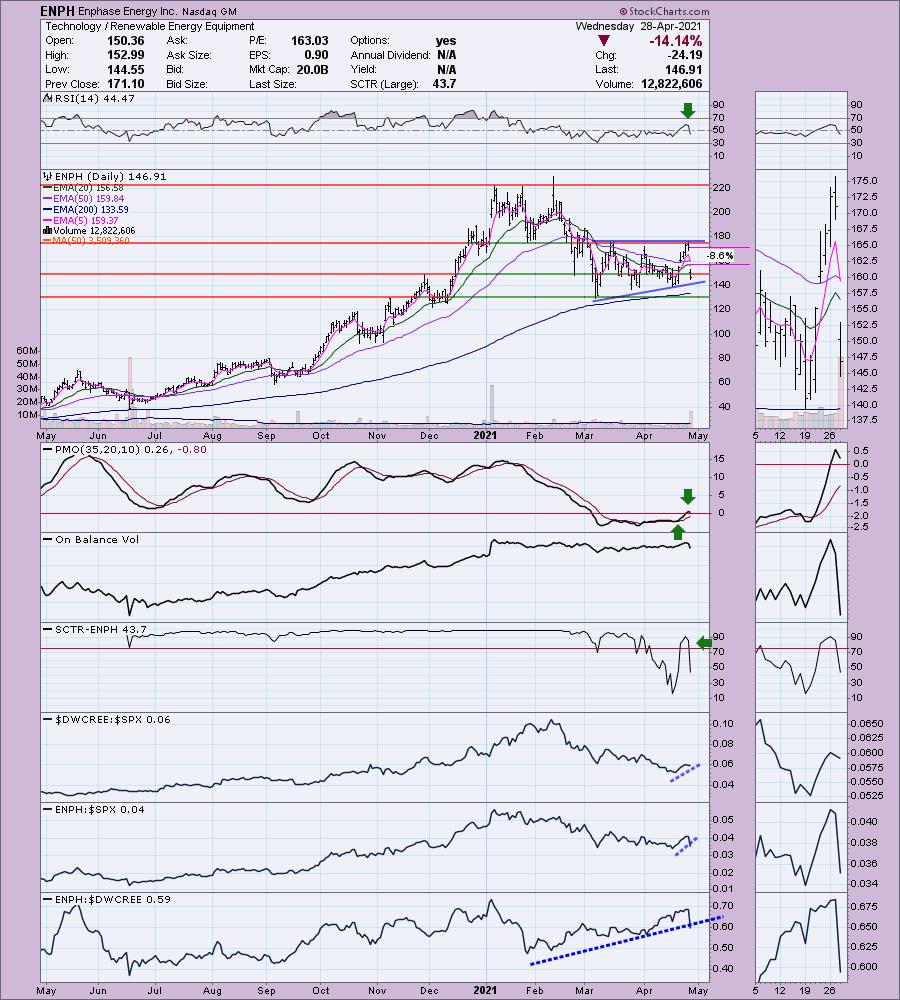
Enphase (ENPH) was one of today's worst performers based on lowered guidance due to chip shortages, but they beat top and bottom line. After hours trading saw it down -6.5% which is why I sent notice that it could be a great opportunity to get this stock at a bargain. It gapped down today and finished down over -14%. I thought I had gotten the best bargain, but I imagine some of you out there got a better one today if you pulled the trigger.
Technically, the stop triggered on this big gap down. However, I note that price is still above the rising bottoms trend line and 200-EMA. I'm not expecting those two levels of support to be broken. Keep ENPH on your watch list, Solar is due for a breakout and ENPH is one of the stronger stocks in this area. I suspect we'll have people come in and scoop this one up at a low price.
Today's "Diamonds in the Rough" are: ABCB, AXP, OXY and WAB.
Stocks/ETFs to Consider (no order): MTRX, TLRY, TCBI, PVAC, COOP
 Diamond Mine REGISTRATION Information:
When: Apr 30, 2021 09:00 AM Pacific Time (US and Canada)
Topic: DecisionPoint Diamond Mine LIVE Trading Room
Register in advance for this webinar.
After registering, you will receive a confirmation email containing information about joining the webinar, including the password. SAVE IT! Zoom doesn't always send out the reminders.
=======================================================================
Diamond Mine RECORDING Link from 4/9/2021:
Topic: DecisionPoint Diamond Mine (04/23/2021) LIVE Trading Room
Start Time : Apr 23, 2021 08:58 AM
Here is the Meeting Recording.
Access Passcode: April/23
***Click here to register for this recurring free DecisionPoint Trading Room on Mondays at Noon ET!***
+++++++++++++++++++++++++++++++++++++++++++++++++++++++++++++++++++++++++++++++
Free DP Trading Room RECORDING LINK:
Topic: DecisionPoint Trading Room
Start Time : Apr 26, 2021 08:51 AM
Here is the Meeting Recording.
Access Passcode: April/26
For best results, copy and paste the access code to avoid typos.
Welcome to DecisionPoint Daily Diamonds, wherein I highlight five "diamonds in the rough." These are selected from the results of my DecisionPoint scans, which search for stocks that could benefit from the trend and condition of the market. Remember, these are not recommendations to buy or sell, but are the most interesting of the stocks that surfaced in my scans. My objective is to save you the work of the initial, tedious culling process, but you need to apply your own analysis to see if these stocks pique your interest as well. There are no guaranteed winners here!
Ameris Bancorp (ABCB)
EARNINGS: 7/26/2021 (AMC)
Ameris Bancorp is a bank holding company, which through the subsidiary, Ameris Bank, engages in the provision of banking services to its retail and commercial customers. It operates through the following business segments: Banking, Retail Mortgage, Warehouse Lending, the SBA and Premium Finance. The Banking segment offers full service financial services to include commercial loans, consumer loans and deposit accounts. The Retail Mortgage segment includes origination, sales, and servicing of one-to-four family residential mortgage loans. The Warehouse Lending segment includes the origination and servicing of warehouse lines to other businesses that are secured by underlying one-to-four family residential mortgage loans. The SBA segment comprises of origination, sales, and servicing of small business administration loans. The Premium Finance segment comprises origination and servicing of commercial insurance premium finance loans. The company was founded on December 18, 1980 and is headquartered in Moultrie, GA.
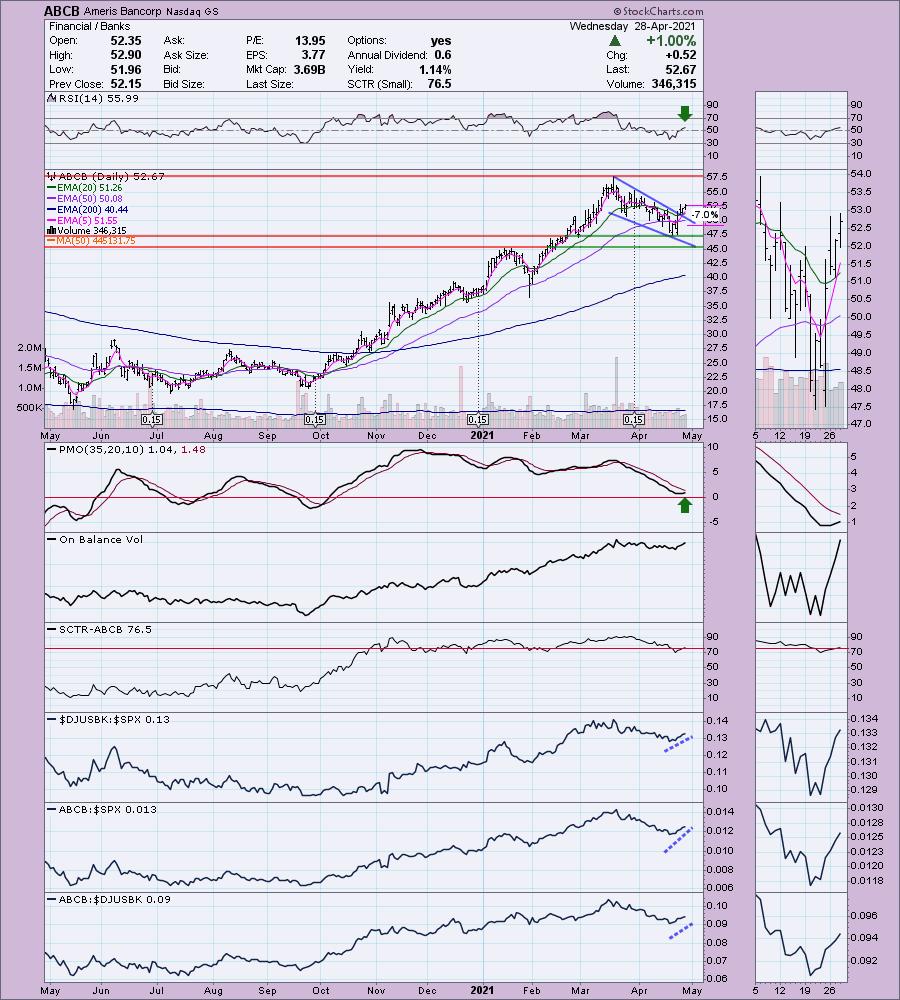
ABCB is unchanged in after hours trading. I covered ABCB in the February 10th 2021 Diamonds Report. The stop was never hit so it is up +14.6% since. Banks had started to dot my scan results this week, but today I saw at least 15 come through. It was very hard to pick which is why I added my second favorite one, COOP to the "Stocks to Consider". It reports earnings tomorrow and ABCB has already reported so I chose it instead of COOP. However, with the group doing so well right now, you can probably find one that fits best for you.
There is a bullish falling wedge and it has been triggered with an upside breakout as expected. The PMO has turned up and the RSI just hit positive territory above net neutral (50). The SCTR just reentered the "hot zone" above 75. Performance is excellent. I also liked this one because it is showing strength among its industry group as well as the SPX. The stop level is set below the 50-EMA, but you could set it at 10% and that would take it down to last week's low.
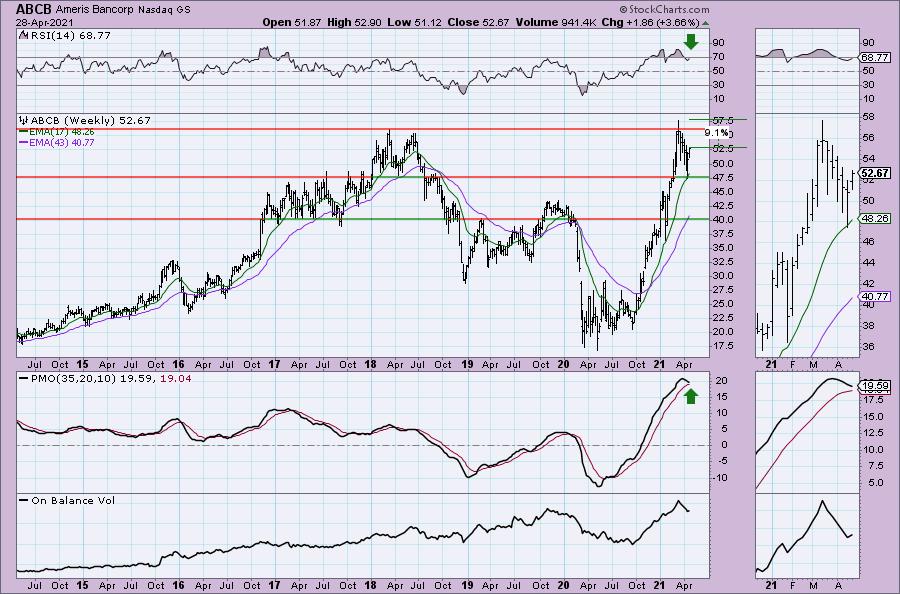
Price bounced off an important area of support at the 17-week EMA and 2017 highs. The PMO is decelerating and the RSI is positive, albeit getting a bit overbought.
American Express Co. (AXP)
EARNINGS: 7/23/2021 (BMO)
American Express Co. engages in the provision of charge and credit card products and travel-related services. It operates through the following segments: Global Consumer Services Group, Global Commercial Services, Global Merchant and Network Services, and Corporate and Other. The Global Consumer Services Group segment issues a wide range of proprietary consumer cards globally. The Global Commercial Services segment provides proprietary corporate and small business cards, payment and expense management services, and commercial financing products. The Global Merchant and Network Services segment operates a global payments network that processes and settles card transactions, acquires merchants, and provides multi-channel marketing programs and capabilities, services, and data analytics. The Corporate and Other segment covers corporate functions and certain other businesses and operations. The company was founded by Henry Wells, William G. Fargo, and John Warren Butterfield on March 28, 1850 and is headquartered in New York, NY.
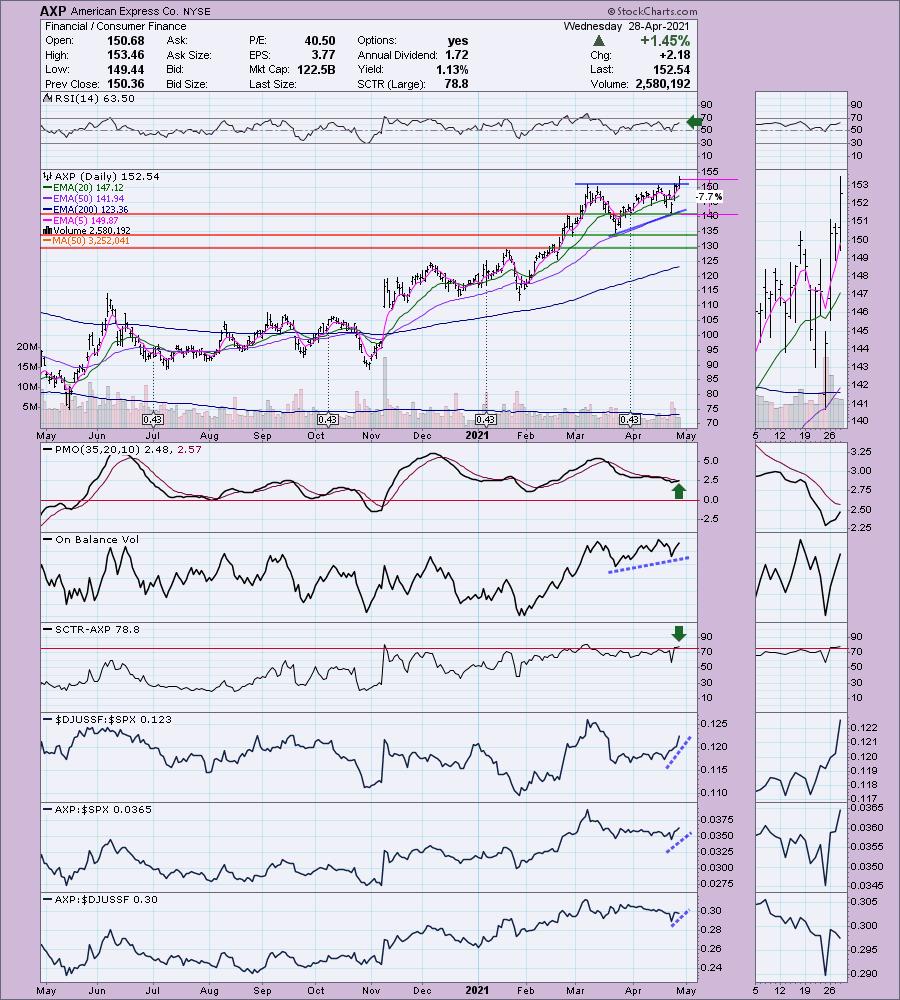
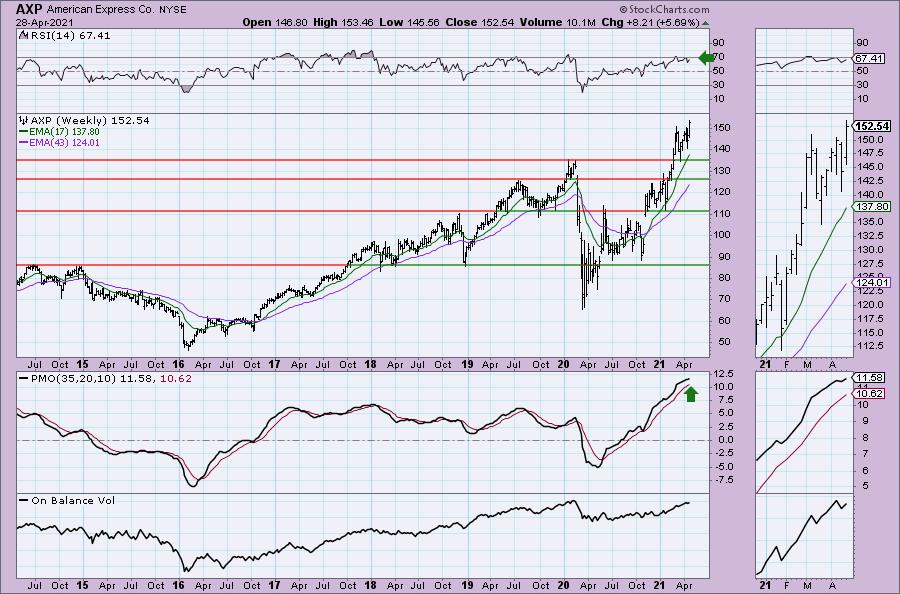
AXP is up +0.78% in after hours trading. I covered AXP in the February 18th 2021 Diamonds Report. The stop was never hit so it is up +18.7% since then. Here we have a bullish ascending triangle. Today it had the upside resolution that was expected. The PMO has turned sharply upward and the RSI is positive and not overbought. The OBV is confirming the rising trend. The SCTR just entered the "hot zone" above 75. Relative performance is strong. The stop is set at last week's intraday low.
The weekly PMO has turned up above its signal line which is especially bullish. The RSI is positive and not overbought.
Occidental Petroleum Corp. (OXY)
EARNINGS: 5/10/2021 (AMC)
Occidental Petroleum Corp. engages in the exploration and production of oil and natural gas. It operates through the following segments: Oil and Gas, Chemical, and Midstream and Marketing. The Oil and Gas segment explores for, develops and produces oil and condensate, natural gas liquids and natural gas. The Chemical segment manufactures and markets basic chemicals and vinyls. The Midstream and Marketing segment purchases, markets, gathers, processes, transports and stores oil, condensate, natural gas liquids, natural gas, carbon dioxide, and power. The company was founded in 1920 and is headquartered in Houston, TX.
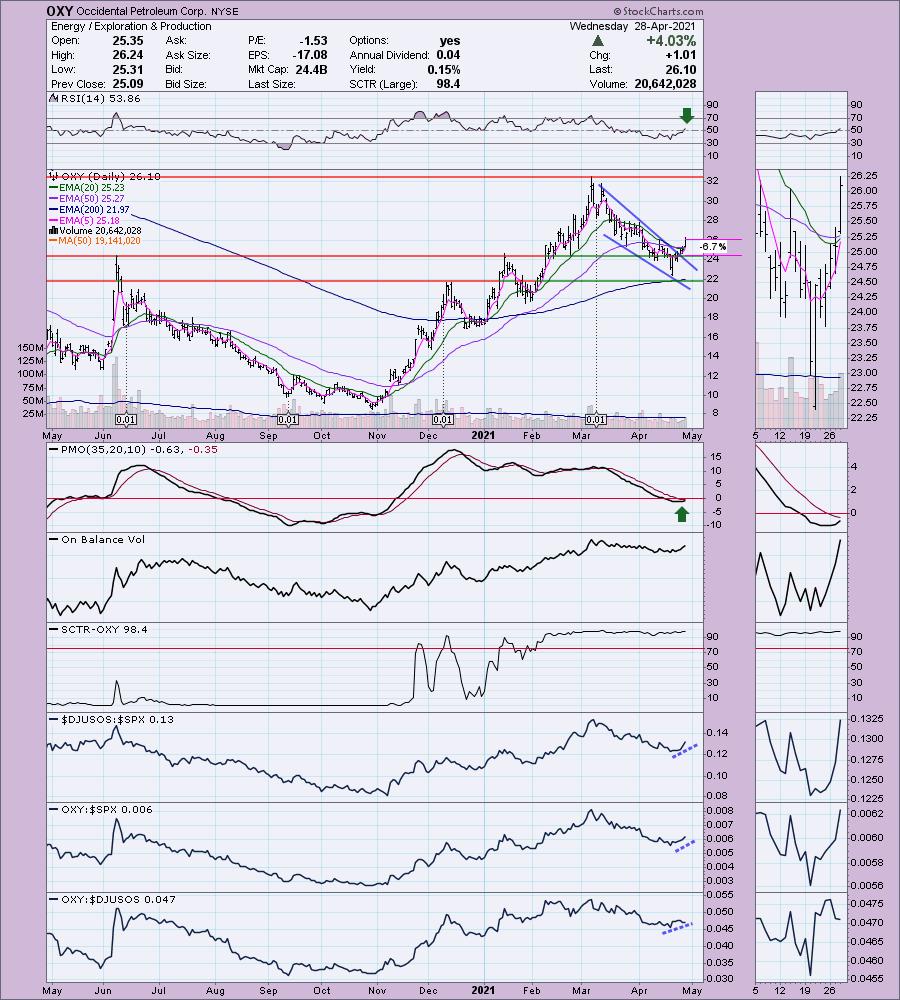
OXY is up +0.27% in after hours trading. I looked at OXY in the March 12th 2020 as a reader request and I didn't label a stop on it. I wasn't thrilled with it, but it was up over 100% at the June high, but as it fell back, it was down over 28% from the price on March 12th. I like the look of the chart and with news that gas prices will be rising again, it could be a good time to get some exposure in this area of the Energy sector. There is a bullish falling wedge and price has now broken out of the pattern and also above the 20/50-EMAs. The PMO is nearing a crossover BUY signal and the RSI just entered positive territory. Performance is good against the SPX and acceptable amongst its brethren.
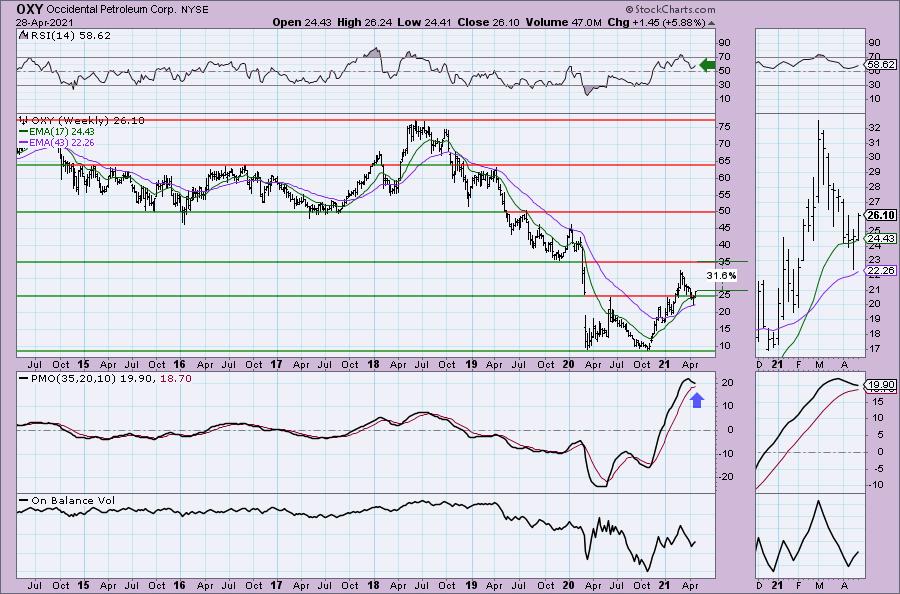
We see that price has recaptured support at the 2020 top. If price can reach $35, that would be an over 30% gain. The RSI is positive and the PMO is decelerating somewhat.
Wabtec (WAB)
EARNINGS: 4/29/2021 (BMO) ** REPORTS TOMORROW **
Westinghouse Air Brake Technologies Corp. engages in the provision of equipment, systems, and value-added services for the rail industry. It operates through the following segments: Freight and Transit. The Freight segment involves in the manufacture and offers services components for new and existing locomotives and freight cars; supplies rail control and infrastructure products such as electronics, positive train control equipment, and signal design and engineering services; overhauls locomotives; and provides heat exchangers and cooling systems for rail and other industrial markets. The Transit segments includes the manufacture and providing services components for new and existing passenger transit vehicles, including regional trains, high speed trains, subway cars, light-rail vehicles, and buses; supplies rail control and infrastructure products such as electronics, positive train control equipment, and signal design and engineering services; builds new commuter locomotives; and renovate passenger transit vehicles. The company was founded in 1869 and is headquartered in Pittsburgh, PA.
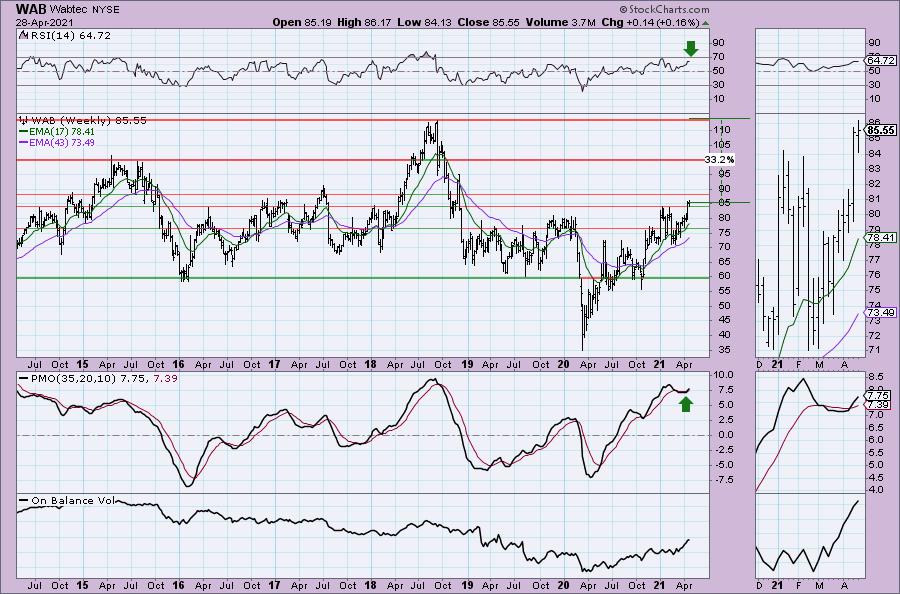
WAB is up +0.51% in after hours trading. We actually saw the breakout late last week. It proceeded to consolidate and now looks like it will begin breaking higher. The RSI is positive, albeit getting overbought. The PMO looks very healthy and is not overbought. We're seeing performance picking up slightly for the industry group, but most important, it is outperforming both the SPX and its group. The stop is set at the mid-March top.
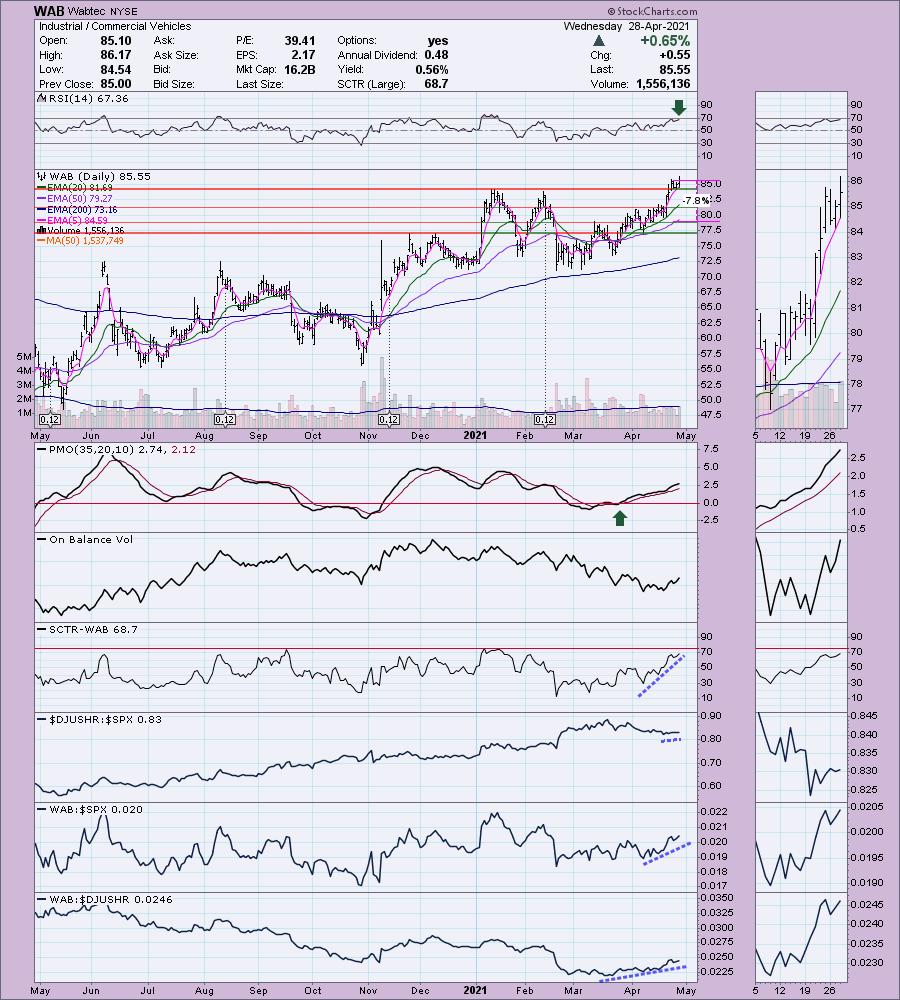
We do see some overhead resistance on the weekly chart. Price is currently foraying into that resistance zone. I would look for a breakout. There is a new weekly PMO BUY signal and the weekly RSI is positive and not overbought.
Don't forget, on Thursdays I look at reader-requested symbols, so shoot me an email at erin@decisionpoint.com. I read every email I receive and try to answer them all!
Current Market Outlook:
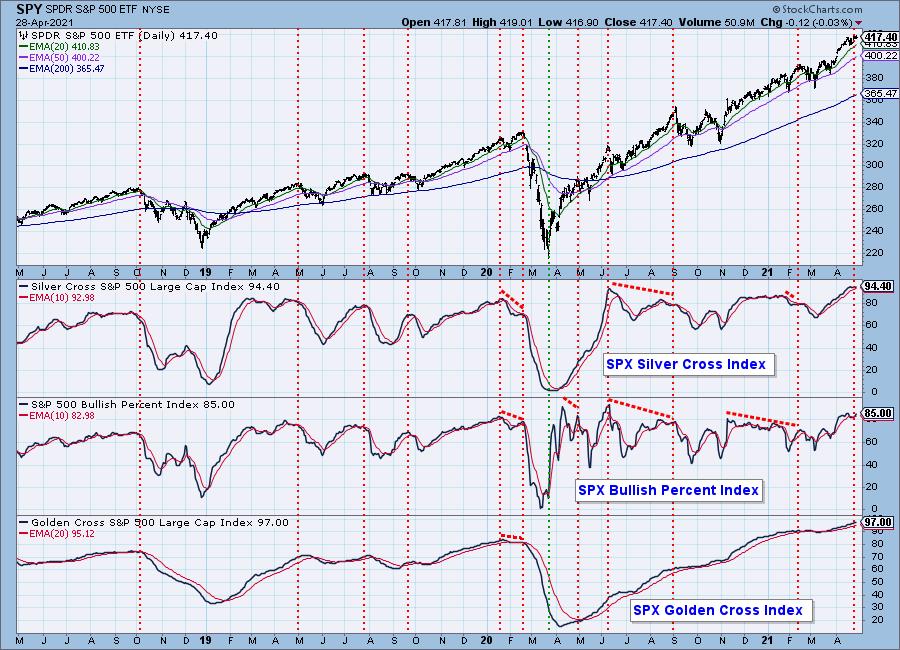
Market Environment: It is important to consider the odds for success by assessing the market tides. The following chart uses different methodologies for objectively showing the depth and trend of participation for intermediate- and long-term time frames.
- The Silver Cross Index (SCI) shows the percentage of SPX stocks on IT Trend Model BUY signals (20-EMA > 50-EMA)
- The Golden Cross Index (GCI) shows the percentage of SPX stocks on LT Trend Model BUY signals (50-EMA > 200-EMA)
- The Bullish Percent Index (BPI) shows the percentage of SPX stocks on Point & Figure BUY signals.
Don't forget that as a "Diamonds" member, you have access to our GCI/SCI curated ChartList on DecisionPoint.com. You'll find it under "Members Only" links on the left side on the Blogs and Links Page.
Here is the current chart:
Diamond Index:
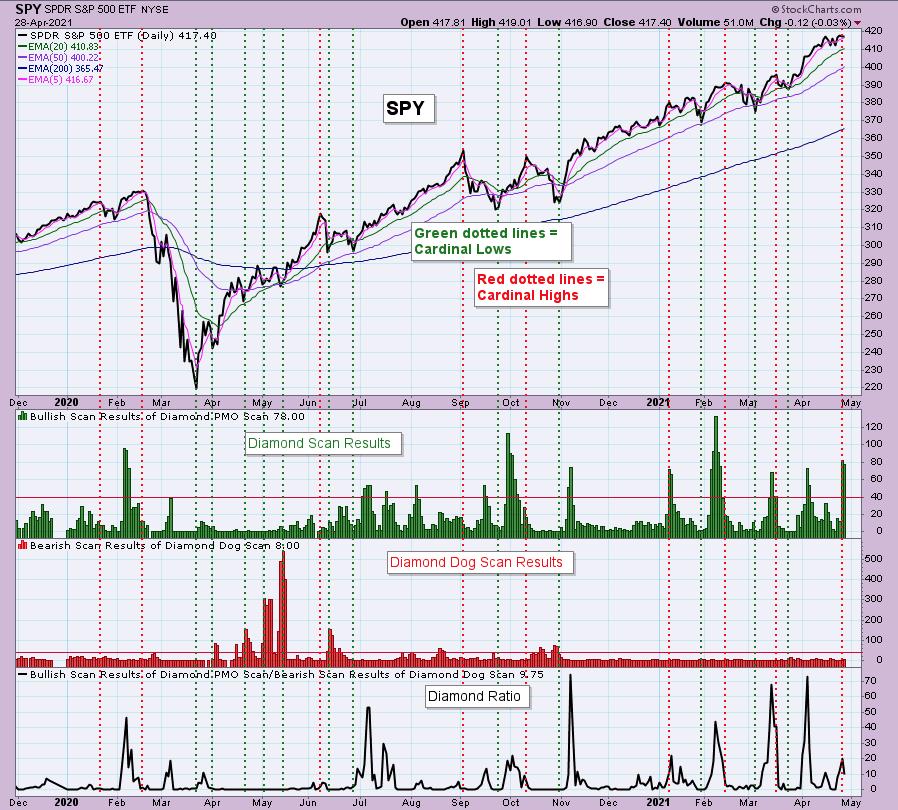
The Diamond Index chart looks at the number of scan results from my bullish Diamond PMO Scan and the number of scan results from the inverse Diamond Dog Scan. The Diamond Ratio divides the bullish results by the bearish results.
I only have data going back to October 2019 so I won't make any sweeping conclusions about the Diamond Index chart. I have marked cardinal tops with red dotted vertical lines and cardinal price bottoms with green dotted vertical lines. I believe that when the Diamond Dog results spike, it usually comes at a price bottom, or marks a strong continuation of the rising trend.
Unfortunately, the Diamond PMO Scan result numbers aren't providing much insight. The Diamond Ratio has promise, but again I don't see a clear correlation to the market tops/bottoms right now. I need to study and manipulate the data some more. Keep you posted!
Full Disclosure: I'm about 80% invested and 20% is in 'cash', meaning in money markets and readily available to trade with.
Technical Analysis is a windsock, not a crystal ball.
Happy Charting!
- Erin
erin@decisionpoint.com
Watch the latest episode of DecisionPoint with Carl & Erin Swenlin on Mondays 7:00p EST or on the DecisionPoint playlist on the StockCharts TV YouTube channel here!
NOTE: The stocks reported herein are from mechanical trading model scans that are based upon moving average relationships, momentum and volume. DecisionPoint analysis is then applied to get five selections from the scans. The selections given should prompt readers to do a chart review using their own analysis process. This letter is not a call for a specific action to buy, sell or short any of the stocks provided. There are NO sure things or guaranteed returns on the daily selection of "diamonds in the rough."
Helpful DecisionPoint Links:
DecisionPoint Shared ChartList and DecisionPoint Chart Gallery
Price Momentum Oscillator (PMO)
Swenlin Trading Oscillators (STO-B and STO-V)
For more links, go to DecisionPoint.com!
