
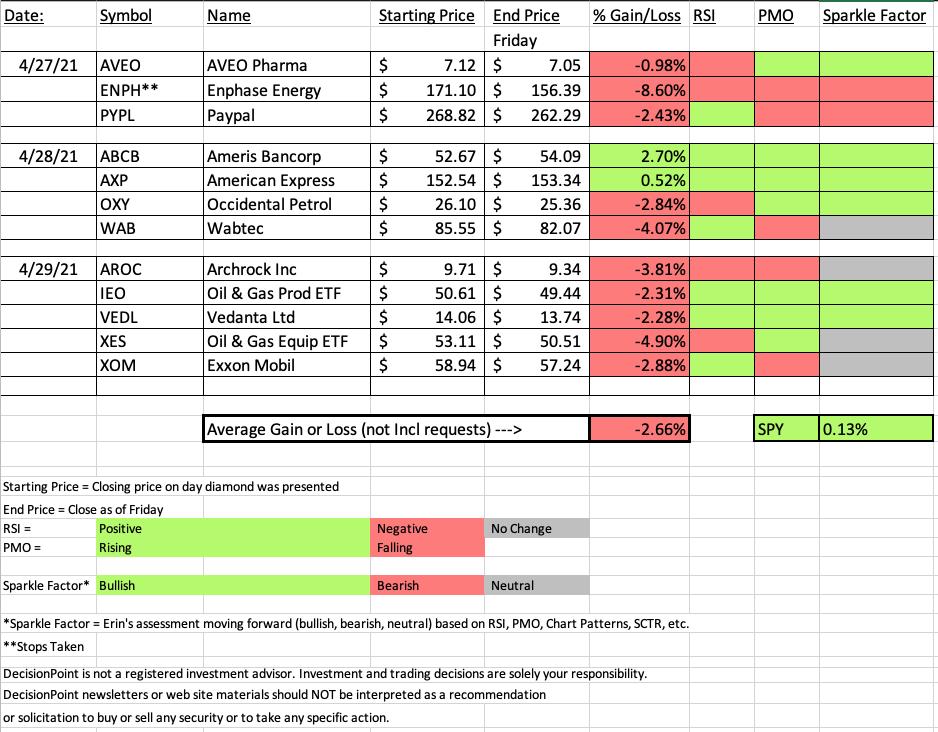
Interesting trading week for Diamonds. This week I believe that we can fully see why it is important to stay diversified in your portfolio positions. What do I mean? This week the "diamonds in the rough" were mainly from the Energy sector with the majority being picked yesterday...right before today's pullback. Since we were mostly "all in" on Oil & Gas, the Diamond spreadsheet was hit hard.
With the "diamonds in the rough" looking particularly rough right now, you'll notice a patchwork on the spreadsheet's Sparkle Factor. The Sparkle Factor tells you how the indicators look and my assessment based on the indicators as to the future success or failure.
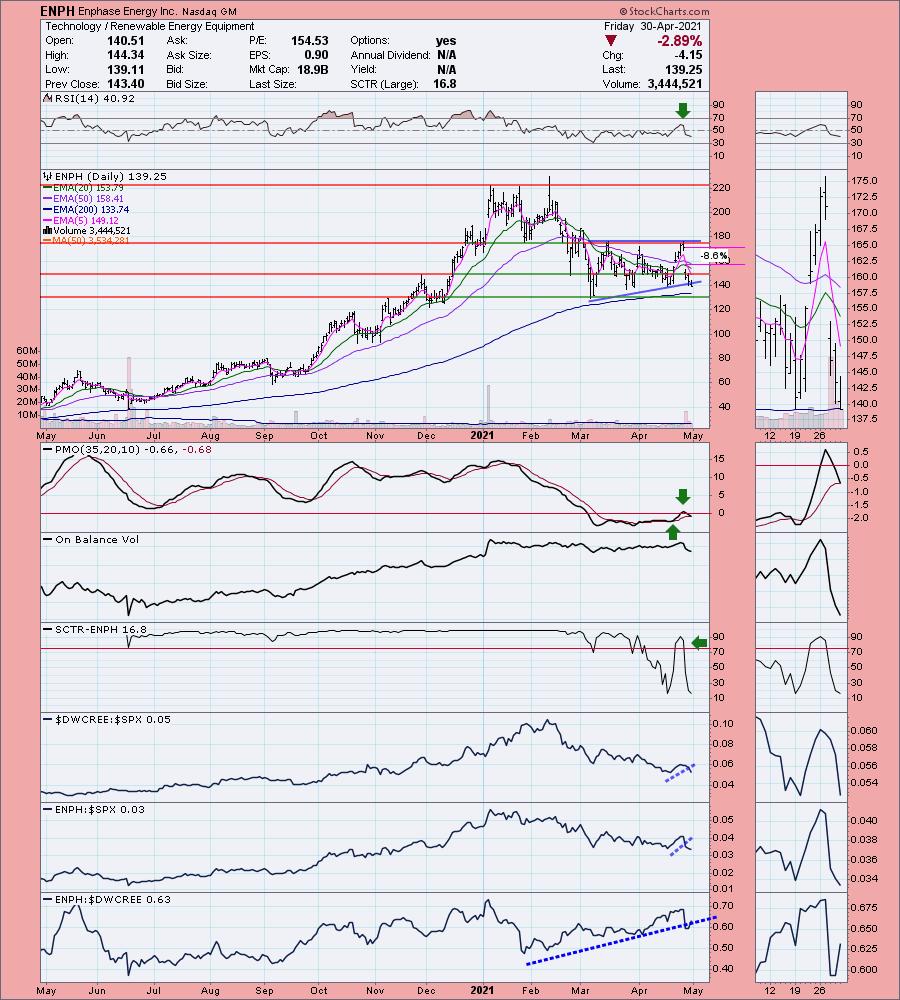
The biggest loser this week was Enphase (ENPH). I definitely went 'all in' on this sector and this stock is one of the strongest Renewable Energy stocks out there. However after lowering guidance on earnings Tuesday night, the stock hit the skids and for the third time since starting the Diamonds Reports, we had a stock hit its stop before the end of the week.
The biggest winner was Ameris Bancorp (ABCB). Banks broke out in a big way this week and ABCB was no exception. This one definitely has a nice set-up and should continue higher.
Time to register for next week's Diamond Mine trading room! Here is the May 7th Link.
Diamond Mine Information:
RECORDING LINK:
Topic: DecisionPoint Diamond Mine (04/30/2021) LIVE Trading Room
Start Time : Apr 30, 2021 08:57 AM
Access Passcode: April/30
REGISTRATION:
When: May 7, 2021 09:00 AM Pacific Time (US and Canada)
Topic: DecisionPoint Diamond Mine (5/7/2021) LIVE Trading Room
Save the registration confirmation email with login instructions in case Zoom doesn't notify you in time.
A few items about the spreadsheet: I decided it only fair to denote "reader requests" as I shouldn't get to take credit if they turn out great! I've put on the spreadsheet whether the RSI is positive (green) or negative (red). The PMO column tells you if it is rising (green) or falling (red). Finally I've added my own "Sparkle Factor" that gives you my assessment going forward, bullish (green), bearish (red) or neutral (gray). The Sparkle Factor is basically my thoughts on whether I expect it to rise or fall. A neutral means it could really go either way so it could be added to a watch list. If you're in a stock I consider "neutral" going forward, the ball is in your court.
Free DecisionPoint Trading Room on Mondays, Noon ET

*Click here to register for this recurring free DecisionPoint Trading Room on Mondays at Noon ET!*
=======================================
BELOW is a link to Monday's recording:
Topic: DecisionPoint Trading Room
Start Time : Apr 19, 2021 09:00 AM
Free Trading Room Recording
Access Passcode: April/19
For best results, copy and paste the access code to avoid typos.
Darling:
Ameris Bancorp (ABCB)
EARNINGS: 7/26/2021 (AMC)
Ameris Bancorp is a bank holding company, which through the subsidiary, Ameris Bank, engages in the provision of banking services to its retail and commercial customers. It operates through the following business segments: Banking, Retail Mortgage, Warehouse Lending, the SBA and Premium Finance. The Banking segment offers full service financial services to include commercial loans, consumer loans and deposit accounts. The Retail Mortgage segment includes origination, sales, and servicing of one-to-four family residential mortgage loans. The Warehouse Lending segment includes the origination and servicing of warehouse lines to other businesses that are secured by underlying one-to-four family residential mortgage loans. The SBA segment comprises of origination, sales, and servicing of small business administration loans. The Premium Finance segment comprises origination and servicing of commercial insurance premium finance loans. The company was founded on December 18, 1980 and is headquartered in Moultrie, GA.
Below is the commentary and chart from Wednesday:
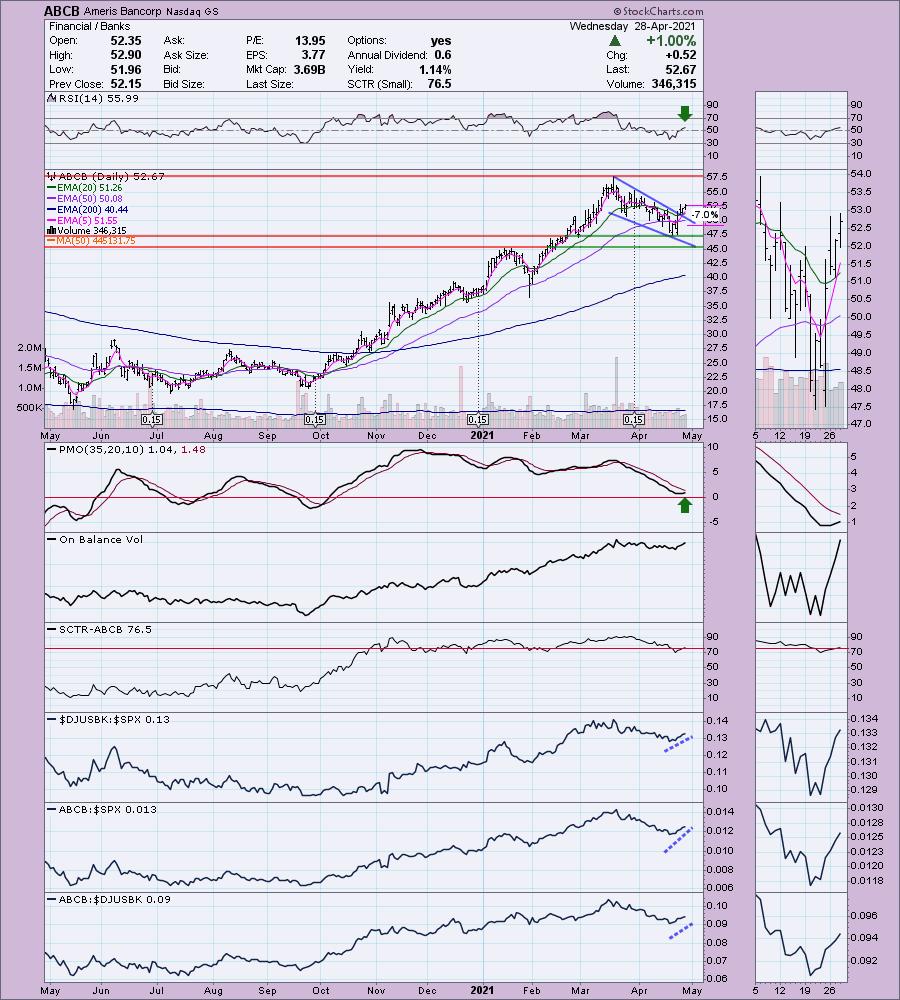
"ABCB is unchanged in after hours trading. I covered ABCB in the February 10th 2021 Diamonds Report. The stop was never hit so it is up +14.6% since. Banks had started to dot my scan results this week, but today I saw at least 15 come through. It was very hard to pick which is why I added my second favorite one, COOP to the "Stocks to Consider". It reports earnings tomorrow and ABCB has already reported so I chose it instead of COOP. However, with the group doing so well right now, you can probably find one that fits best for you.
There is a bullish falling wedge and it has been triggered with an upside breakout as expected. The PMO has turned up and the RSI just hit positive territory above net neutral (50). The SCTR just reentered the "hot zone" above 75. Performance is excellent. I also liked this one because it is showing strength among its industry group as well as the SPX. The stop level is set below the 50-EMA, but you could set it at 10% and that would take it down to last week's low."
Here is today's chart:
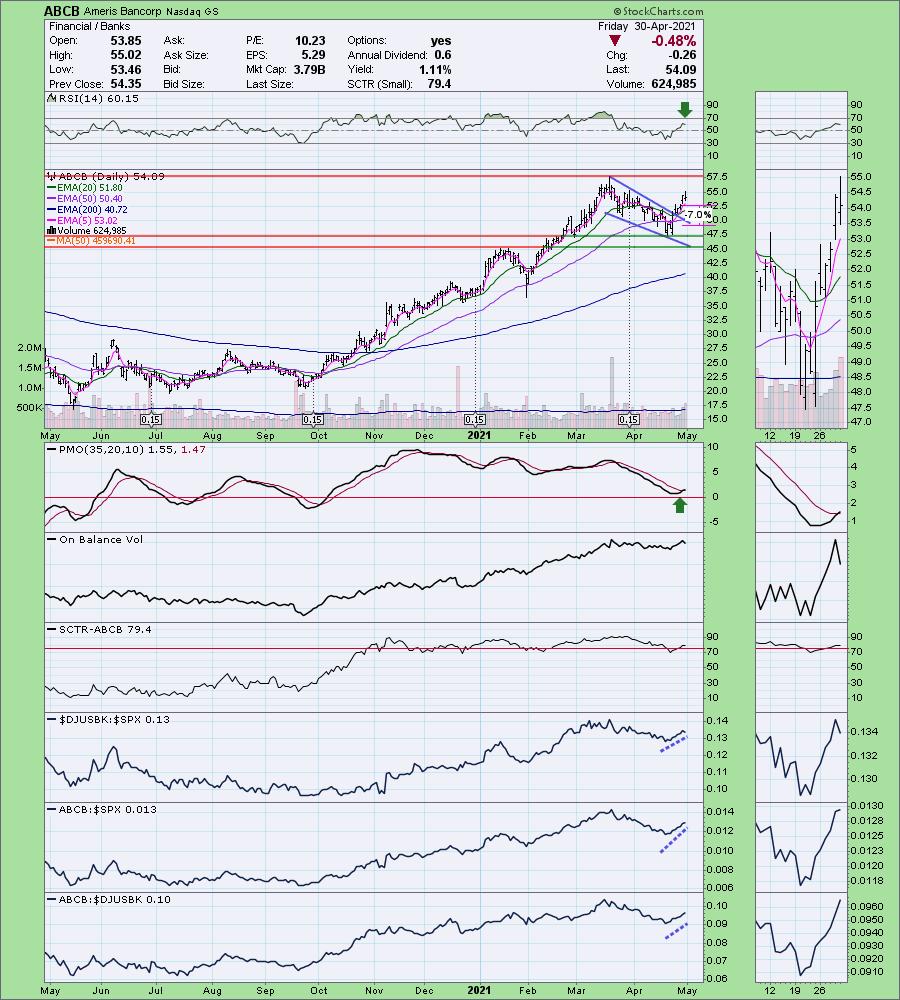
We have a decisive (3%+) breakout from the bullish falling wedge or bull flag . The PMO has now triggered a crossover BUY signal to confirm this rally as well. It continues to outperform. Look for a breakout when it hits resistance at the March top.
Don't forget, on Thursdays I look at reader-requested symbols, so shoot me an email at erin@decisionpoint.com. I read every email I receive and try to answer them all!
Dud:
Enphase Energy Inc. (ENPH)
EARNINGS: 7/27/2021 (AMC)
Enphase Energy, Inc. engages in the design, development, manufacture and sale of micro inverter systems for the solar photovoltaic industry. Its products include IQ 7 Microinverter Series, IQ Battery, IQ Envoy, IQ Microinverter Accessories, IQ Envoy Accessories and Enlighten & Apps. The company was founded by Raghuveer R. Belur and Martin Fornage in March 2006 and is headquartered in Fremont, CA.
Below is the commentary and chart from Tuesday:
"ENPH is down -6.78% in after hours trading after reporting earnings. I don't have the details of the earnings report, but I took advantage of this pullback to grab some shares in after hours trading a short while ago. Consequently we are likely going to see this one suffer on this week's Recap spreadsheet, but this opportunity had to be presented.
I covered ENPH in May 4th 2020 Diamonds Report (hit its stop on the mid-June crash to the 200-EMA) and the July 6th 2020 Report (the stop has not been hit so it is up +241.1% since). I'm not happy to hear that price is falling tonight and was below the 50-EMA last time I checked. We need for gap support to hold. If it drops below $155, it will be time to reevaluate.
What I see is an ascending triangle pattern. The expectation is an upside breakout. Well, we know right now that we aren't getting that, but we do have the luxury of lowering the stop level from where I have it on the chart right now. The RSI and PMO are in positive territory. The PMO is rising very strongly. The SCTR is in the "hot zone" above 75. Its performance is what makes it so attractive (as well as actually having earnings, unlike many in that group). We know we like Solar right now so finding a stock that is outperforming the group by so much is a 'win'."
Below is today's chart:
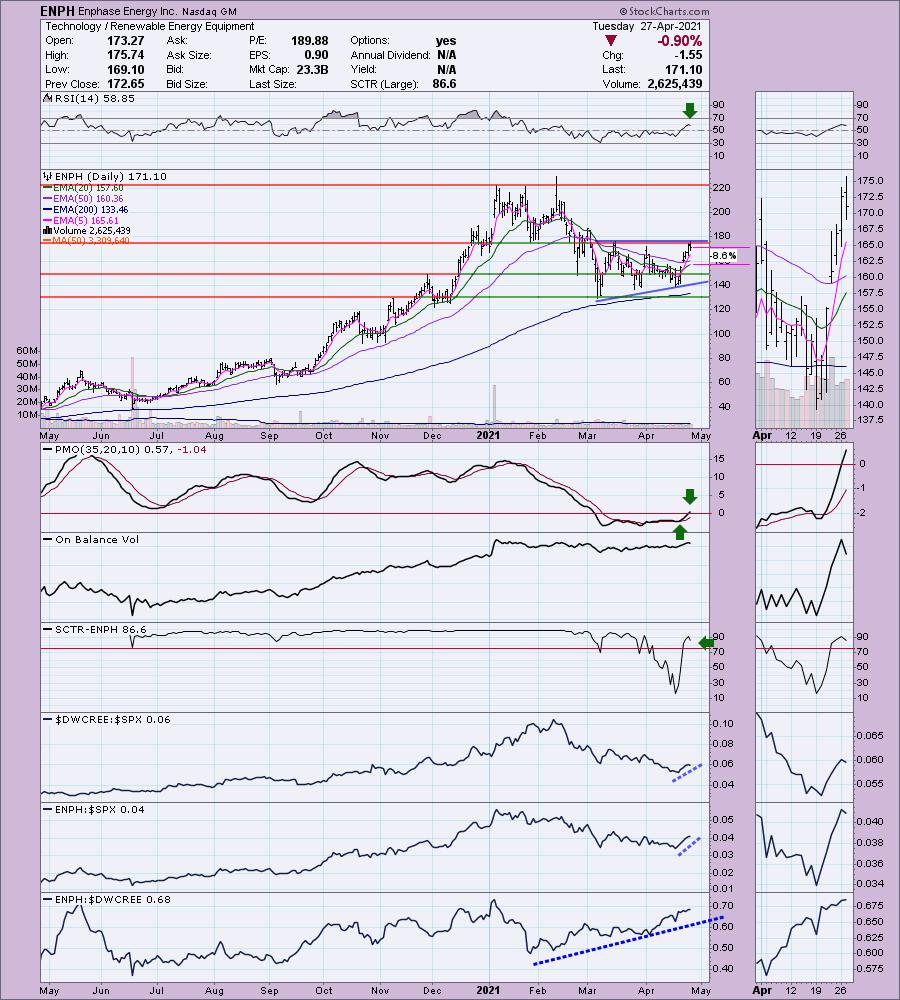
ENPH has now lost its mild rising trend and is headed to test the 200-EMA. Support is currently holding so this still could be an excellent jumping off point, but the PMO is almost on a crossover SELL signal generated below the zero line. The RSI is negative. Indicators suggest this support level will be broken, so mind your stops.
THIS WEEK's Sector Performance: 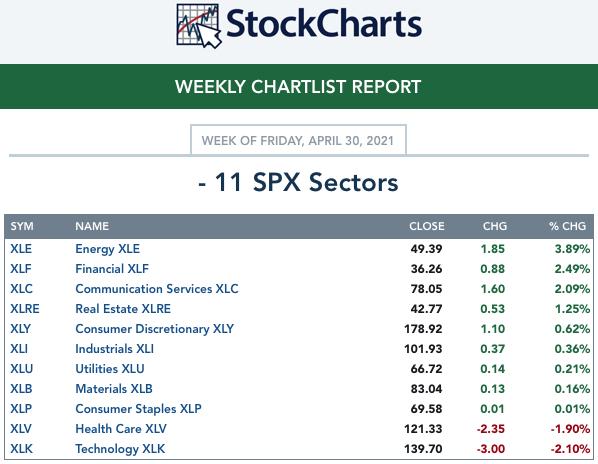
Click Here to view Carl's annotated Sector ChartList!
CONCLUSION:
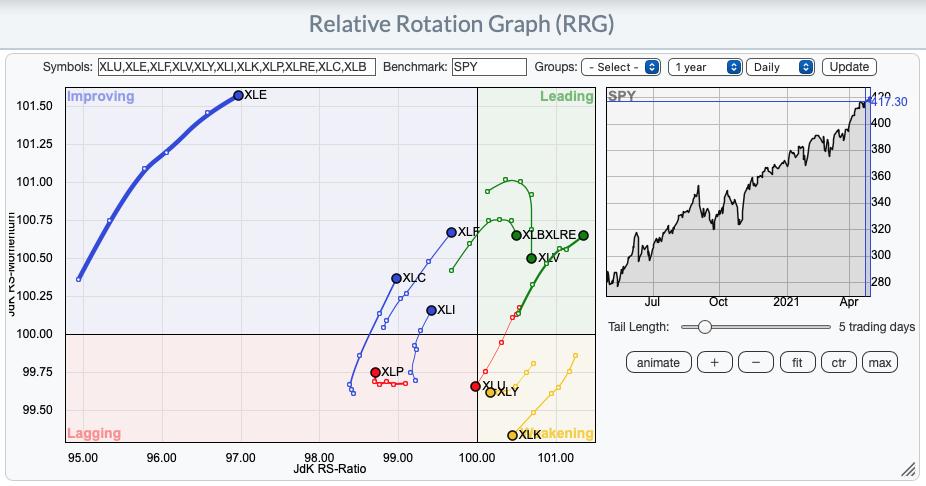
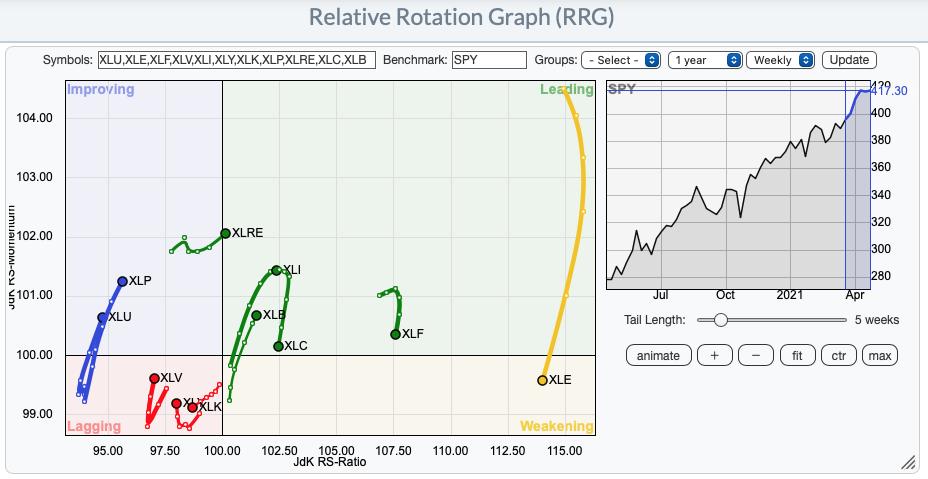
I like Utilities, but on the short-term RRG , it looks terrible. It is in the lagging quadrant and continuing in a southwest direction which is as negative as it gets. I was a bit shocked, so I did the intermediate-term RRG and found that XLU looks better there.
Short-term RRG:
Intermediate-term RRG:
Sector to Watch: Real Estate (XLRE)
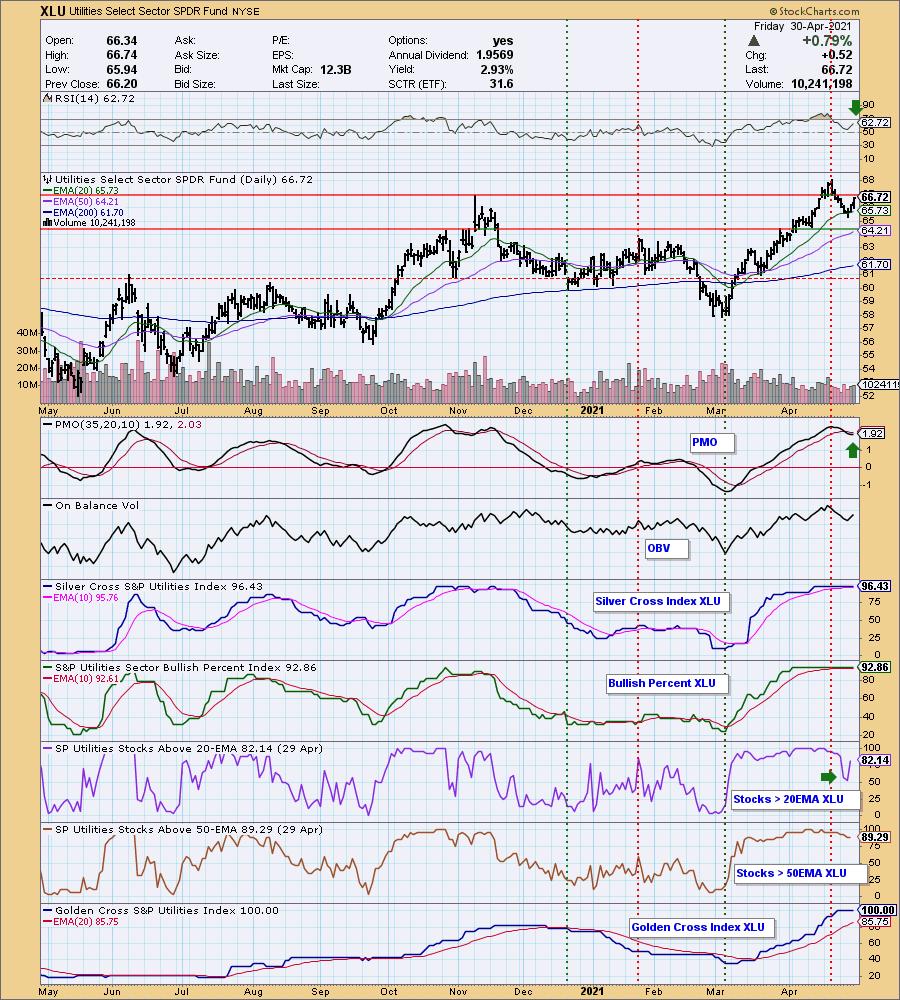
I picked out Utilities (XLU) in this morning's Diamond Mine as the sector to watch. While the indicators aren't perfect, I really liked this bounce off the 20-EMA. The RSI is positive and the PMO is turning back up. Participation is mostly overbought, but it is strong. Notice the huge short-term improvement in %Stocks > 20-EMA. I like that foundation.
Industry Group to Watch: Multiutilities ($DJUSMU)
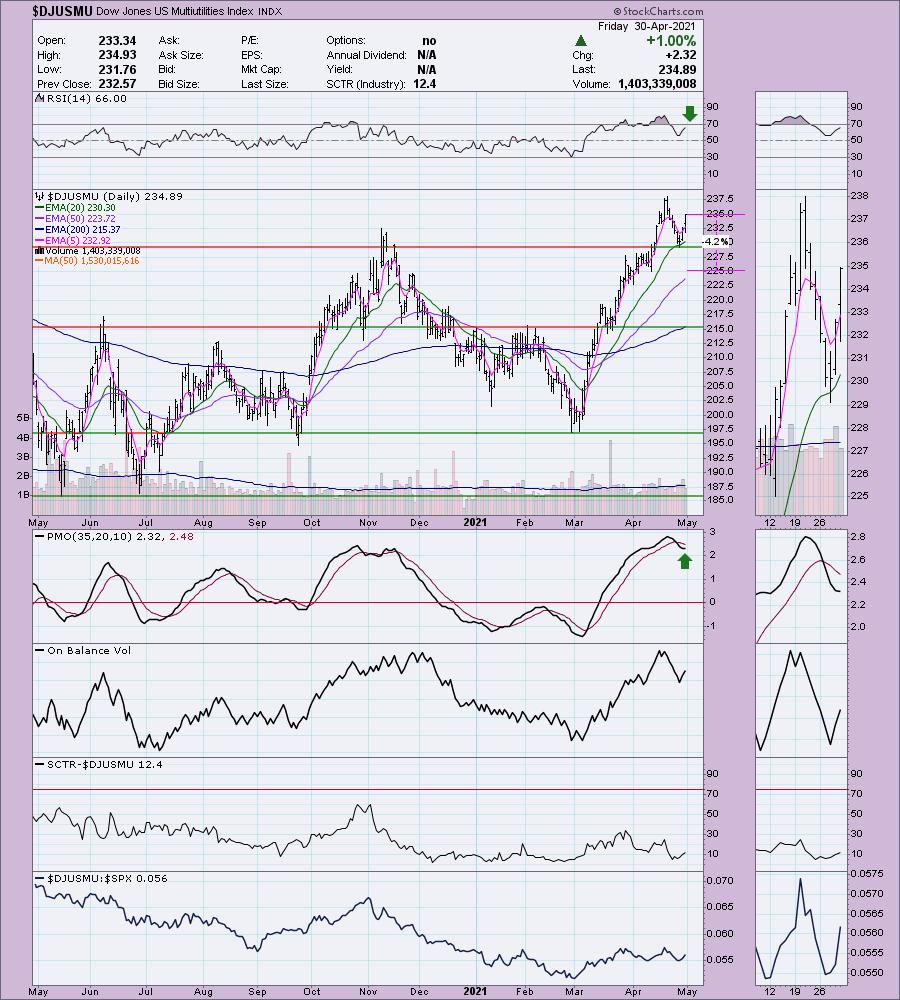
The Multiutilities chart reminds me of why I like XLU above. Really nice bounce off the 20-EMA and the November top. The PMO is turning up and the RSI is positive. We can see how this group is beginning to outperform the SPX.
Go to our Sector ChartList on DecisionPoint.com to get an in depth view of all the sectors.
Technical Analysis is a windsock, not a crystal ball.
Have a great weekend & Happy Charting!
- Erin
erin@decisionpoint.com
Full Disclosure: I'm about 75% invested right now and 25% is in 'cash', meaning in money markets and readily available to trade with.
Watch the latest episode of DecisionPoint with Carl & Erin Swenlin on Mondays 7:00p EST or on the DecisionPoint playlist on the StockCharts TV YouTube channel here!
NOTE: The stocks reported herein are from mechanical trading model scans that are based upon moving average relationships, momentum and volume. DecisionPoint analysis is then applied to get five selections from the scans. The selections given should prompt readers to do a chart review using their own analysis process. This letter is not a call for a specific action to buy, sell or short any of the stocks provided. There are NO sure things or guaranteed returns on the daily selection of "diamonds in the rough."
Helpful DecisionPoint Links:
DecisionPoint Shared ChartList and DecisionPoint Chart Gallery
Price Momentum Oscillator (PMO)
Swenlin Trading Oscillators (STO-B and STO-V)
