
It's Reader Request Day for DP Diamonds! It was a light week for requests, maybe due to the shortened week? Therefore, I took three of your requests to review and added two of my own using the theme from today's Chartwise Women show.
On today's Chartwise Women show it was all about recovery stocks. It is time to consider stocks that will match with likely consumer spending trends moving into the summer. I have been stalking Airline stocks and Cruise Line stocks for bargains with reduced risk. It's the latter that has prevented me from presenting you with those stocks. However, momentum is working for them and this airline stock in particular has been outperforming the market and its industry group for some time. If this area is going to get a boost, this airline stock is a good choice.
I like Carnival Cruise Lines (CCL), but I decided to go for a different recovery stock. Interestingly many have forgotten that a travel staple is a good credit card. The card that is a global leader for travel is American Express (AXP). Mary Ellen looked at Visa (V) today, but I like the relative performance of AXP best.
Today's "Diamonds in the Rough" are: AXP, BR, LKQ, LQDT AND SAVE.
Register for the Diamond Mine right now! All the information is below!
 Diamond Mine Registration Information:
When: Feb 19, 2021 09:00 AM Pacific Time (US and Canada)
Register in advance for this webinar:
https://zoom.us/webinar/register/WN_hZpiKxUnQA22ujhtQU_eaA
After registering, you will receive a confirmation email containing information about joining the webinar, including the password.
=======================================================================
Recording Link:
Topic: DecisionPoint Diamond Mine (02/12/2021) LIVE Trading Room
Start Time : Feb 12, 2021 08:59 AM
Meeting Recording:
https://zoom.us/rec/share/TswuF5ycojoVZr1JNJiA-P9xga6xo-VE39__5jO1s-vUNqT7GUSMUgWj1YAtefE.LlSu71tsdnE_5q7r
Access Passcode: *hSE68dy
David Keller, CMT, Chief Technical Analyst at StockCharts.com will be joining me in the free DP Trading Room on March 1st! Dave will give us his take on the market and share his trading methodologies as both of us discuss your symbol requests.

David Keller, CMT is Chief Market Strategist at StockCharts.com, where he helps investors minimize behavioral biases through technical analysis. He is a frequent host on StockCharts TV, and he relates mindfulness techniques to investor decision making in his blog, The Mindful Investor. David is also President and Chief Strategist at Sierra Alpha Research LLC, a boutique investment research firm focused on managing risk through market awareness. He combines the strengths of technical analysis, behavioral finance, and data visualization to identify investment opportunities and enrich relationships between advisors and clients.
***Click here to register for this recurring free DecisionPoint Trading Room on Mondays at Noon ET!***
+++++++++++++++++++++++++++++++++++++++++++++++++++++++++++++++++++++++++++++++
Here is the information for the Tuesday 2/16/2021 recording:
Topic: DecisionPoint Trading Room Recording 2/16/2021
Meeting Recording:
https://zoom.us/rec/share/G4hnZKpDiDxpK3jFBaao-qVqCJWjEgJNyWn9lueufB-sO-iomygo7tot1vaFKbu7.6013TODA9_Zlb0Jc
Access Passcode: i^96E7mf
For best results, copy and paste the access code to avoid typos.
Welcome to DecisionPoint Daily Diamonds, wherein I highlight five "diamonds in the rough." These are selected from the results of my DecisionPoint scans, which search for stocks that could benefit from the trend and condition of the market. Remember, these are not recommendations to buy or sell, but are the most interesting of the stocks that surfaced in my scans. My objective is to save you the work of the initial, tedious culling process, but you need to apply your own analysis to see if these stocks pique your interest as well. There are no guaranteed winners here!
American Express Co. (AXP)
EARNINGS: 4/23/2021 (BMO)
American Express Co. engages in the provision of charge and credit card products, and travel-related services. It operates through the following segments: Global Consumer Services Group, Global Commercial Services, Global Merchant and Network Services and Corporate & Other. The Global Consumer Services Group segment issues a wide range of proprietary consumer cards globally. The Global Commercial Services segment provides proprietary corporate and small business cards, payment and expense management services, and commercial financing products. The Global Merchant and Network Services segment operates a global payments network that processes and settles card transactions, acquires merchants, and provides multi-channel marketing programs and capabilities, services, and data analytics. The Corporate & Other segment covers corporate functions and certain other businesses and operations. The company was founded by Henry Wells, William G. Fargo and John Warren Butterfield on March 28, 1850 and is headquartered in New York, NY.
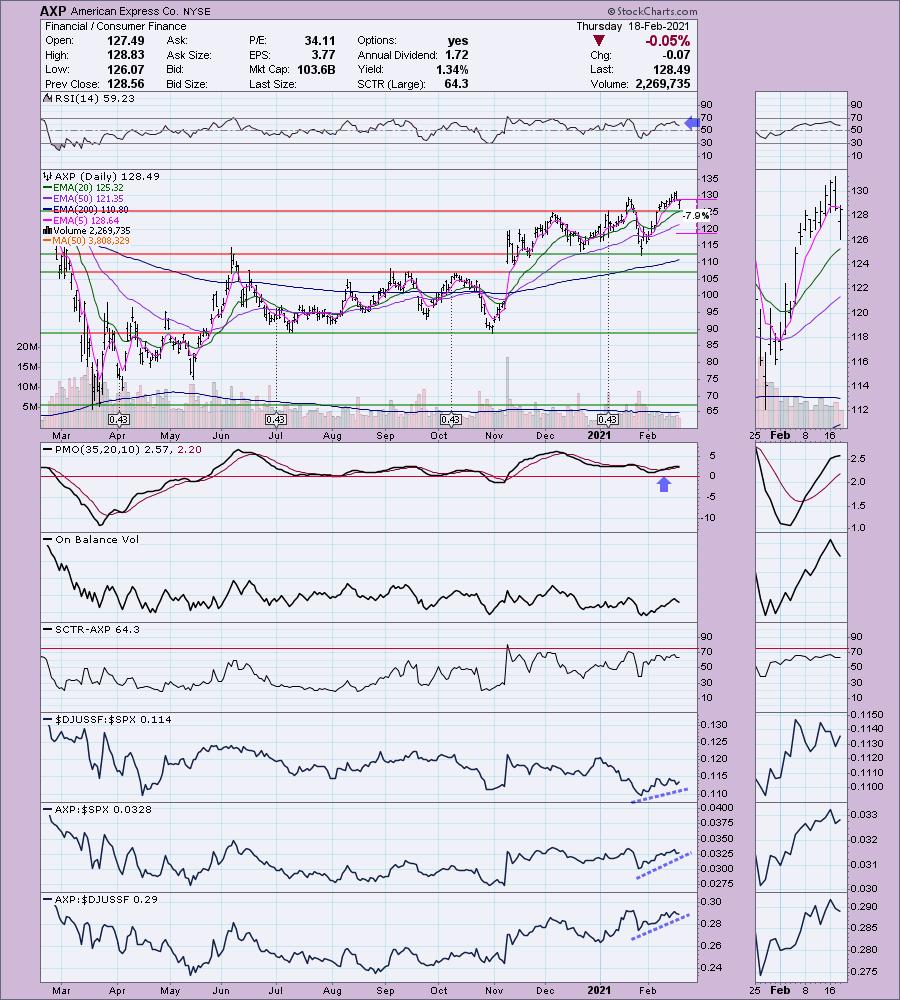
AXP is down -0.25% in after hours trading. Today AXP pulled back after breaking out above the January top. Yesterday and today's pullback did flatten the PMO, but it is still technically rising. The RSI remains positive. Relative performance is outstanding in every way except for a SCTR that isn't in the "hot zone" above 75. There is an intermediate-term negative divergence between price tops and OBV tops since late December, but this last OBV top was nearly even with the previous so I'll forgive it.
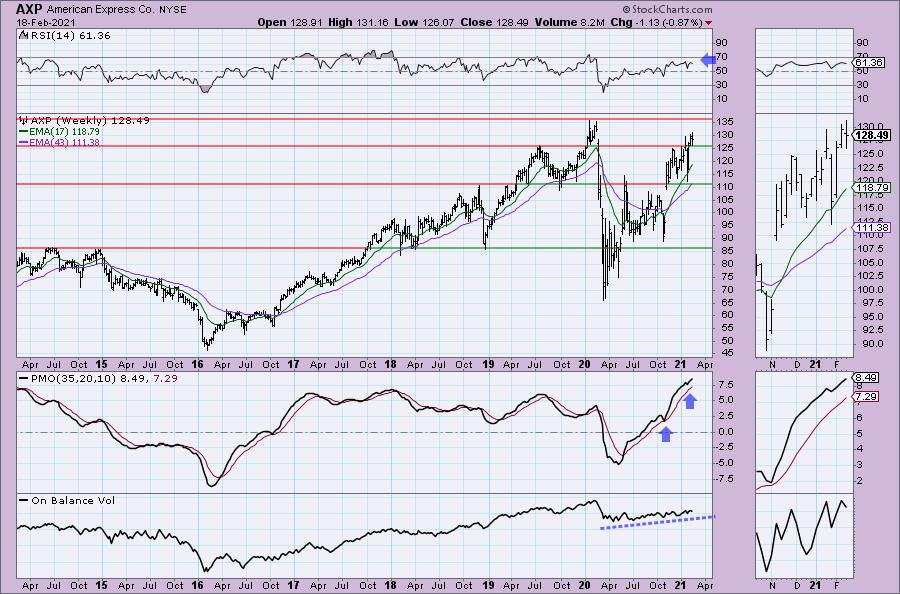
AXP broke out above important resistance at the 2019 top and is headed back to all-time highs. Given the positive PMO and RSI, it should exceed those highs.
Broadridge Financial Solutions, LLC (BR)
EARNINGS: 5/6/2021 (BMO)
Broadridge Financial Solutions, Inc. engages in the provision of investor communications and technology solutions to banks, broker-dealers, mutual funds, and corporate issuers. It operates through the following segments: Investor Communication Solutions; and Global Technology and Operations. The Investor Communication Solutions segment offers services for broker-dealer investor communication, customer communication, corporate issuer, advisor solutions, and mutual fund and retirement solutions. The Global Technology and Operations segment includes middle and back-office securities processing solutions, automation services, and business process outsourcing services. The company was founded in 1962 and is headquartered in Lake Success, NY.
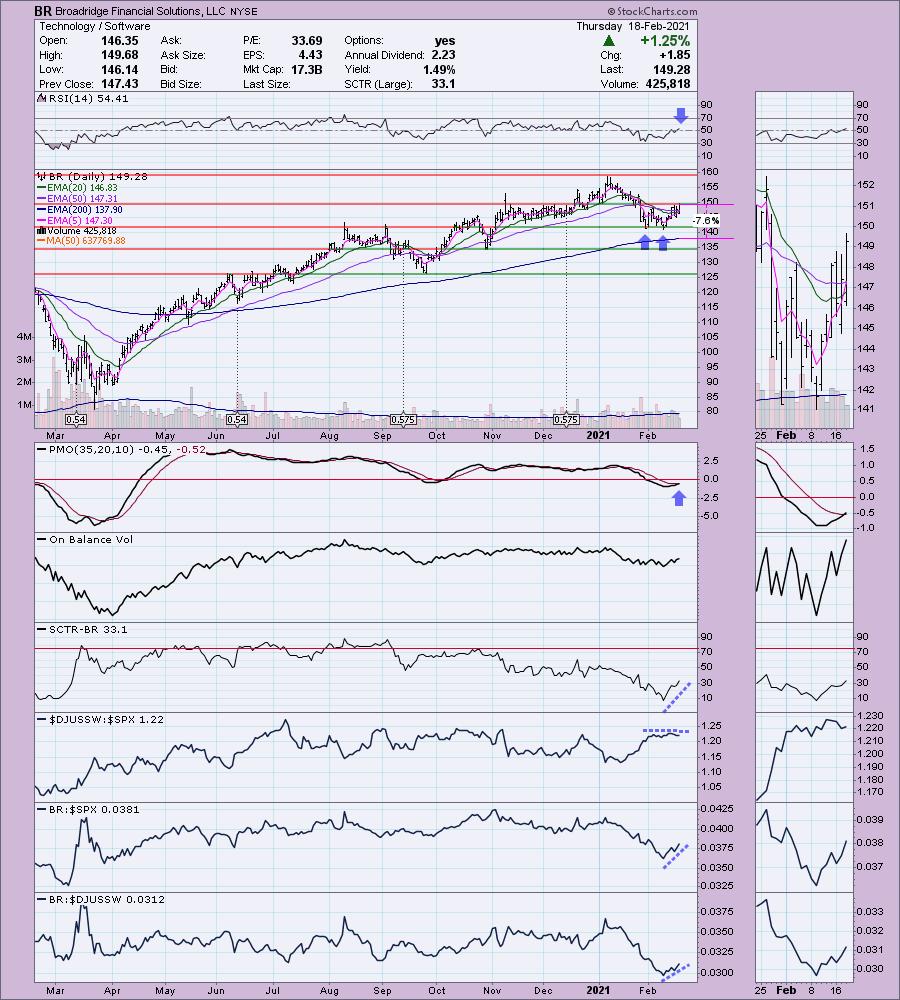
BR is unchanged in after hours trading. Here's reader request number one. There is a double-bottom in the short-term. If you look in the thumbnail, we can see that it has executed with today's close above the confirmation line at $148.10. The PMO looks fantastic with the new crossover BUY signal. The RSI has just moved into positive territory. Interestingly the Software industry group has been on par with the SPX, but BR is outperforming them both. You could have a tighter stop than what I've proposed here at $140, however, I set the stop on the chart based on the 200-EMA.
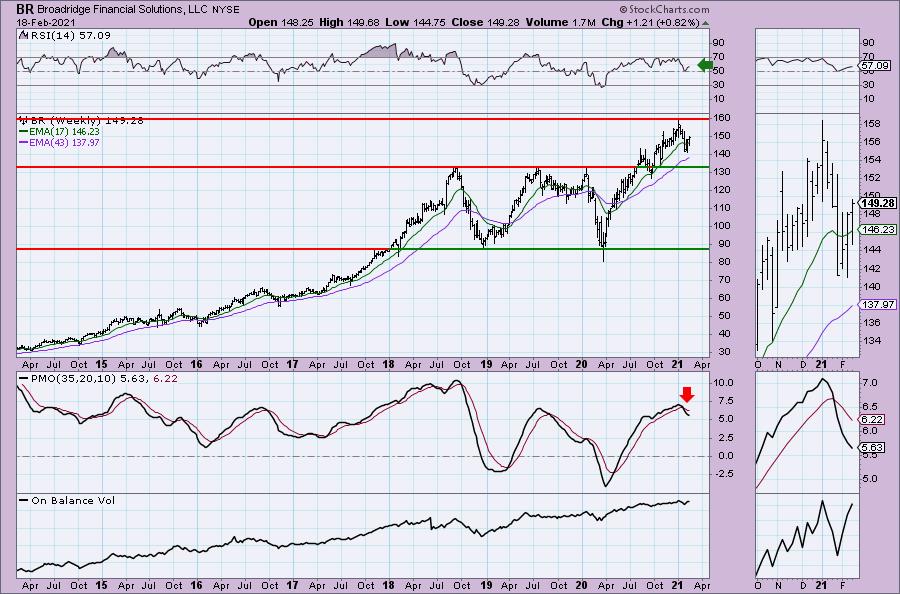
The weekly chart is less favorable with a PMO SELL signal. However, the RSI is positive and rising and volume is beginning to kick in.
LKQ Corp. (LKQ)
EARNINGS: 2/18/2021 (Reported today BMO)
LKQ Corp. engages in providing alternative parts to repair and accessorize automobiles and other vehicles. It operates through the following segments: Wholesale-North America, Europe and Specialty. The Wholesale-North America segment includes Glass and Self Service segments. The company was founded by Donald F. Flynn in February 1998 and is headquartered in Chicago, IL.
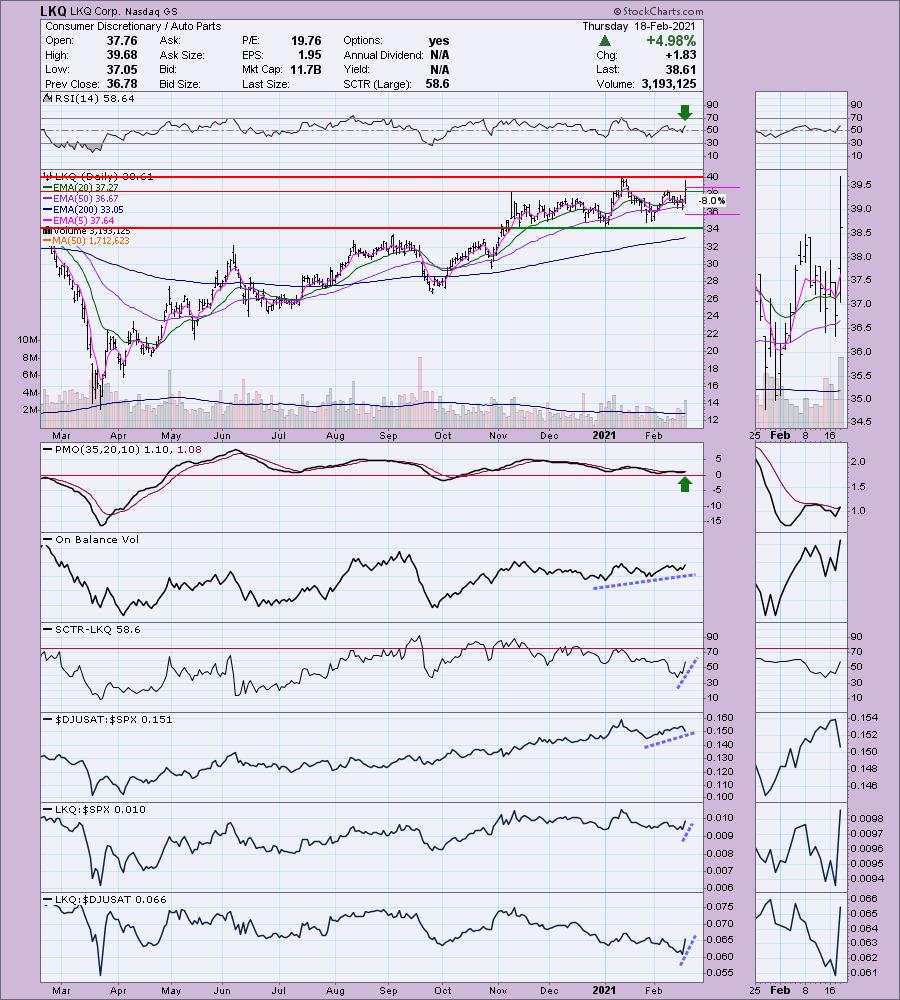
Reader request number to is LKQ which reported earnings before the market opened today. It is up +0.28% in after hours trading. Today rally pop pushed price past overhead resistance at the November top and previous February top. The RSI is now positive and the PMO triggered a new. We are seeing fresh relative strength on LKQ and the OBV is confirming the rally. I set the stop at 8%, but you could tighten that up to the 50-EMA if you prefer less risk.
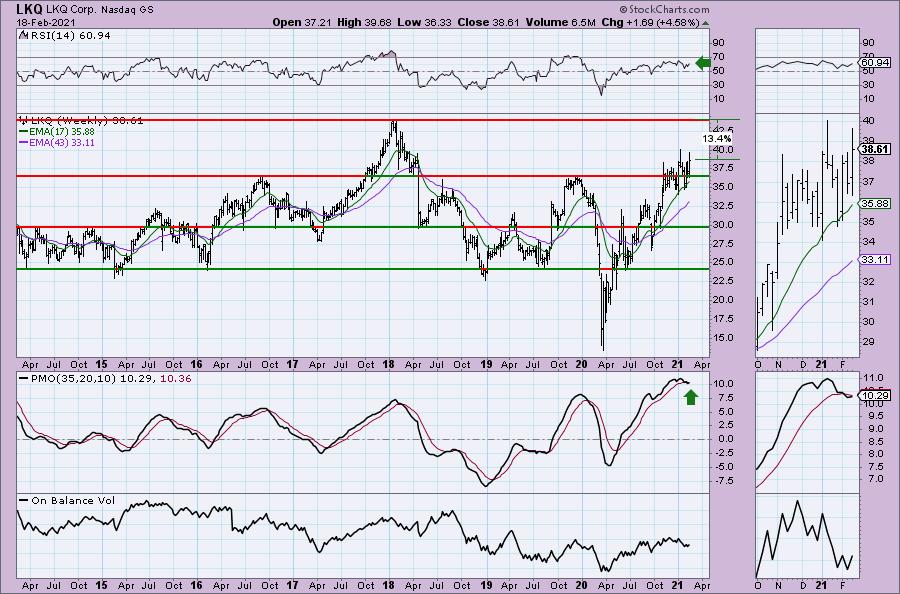
At first glance the PMO looks very ugly, however when we inspect the thumbnail we can see it has turned up and is whipsawing back into a buy signal. If price challenges its 2018 high, that would be a 13.4% gain.
Don't forget, on Thursdays I look at reader-requested symbols, so shoot me an email at erin@decisionpoint.com. I read every email I receive and try to answer them all!
Liquidity Services Inc. (LQDT)
EARNINGS: 5/6/2021 (BMO)
Liquidity Services, Inc. engages in the provision of e-commerce solutions to manage, value, and sell inventory and equipment for business and government clients. It operates through the following business segments: GovDeals; Capital Assets Group; Retail Supply Chain Group; and Machinio. The GovDeals segment provides self-service solutions in which sellers list their own assets, and it consists of marketplaces that enable local and state government. The CAG segment offers full-service solutions to sellers and it consists of marketplaces that enable federal government agencies as well as commercial businesses to sell surplus, salvage, and scrap assets. The RSCG segment consists of marketplaces that enable corporations located in the United States and Canada to sell surplus and salvage consumer goods and retail capital assets. The Machinio segment involves in the global online platform for listing used equipment for sale in the construction, machine tool, transportation, printing and agriculture sectors. The company was founded by William P. Angrick III, Jaime Mateus-Tique and Benjamin Ronald Brown in November 1999 and is headquartered in Bethesda, MD.
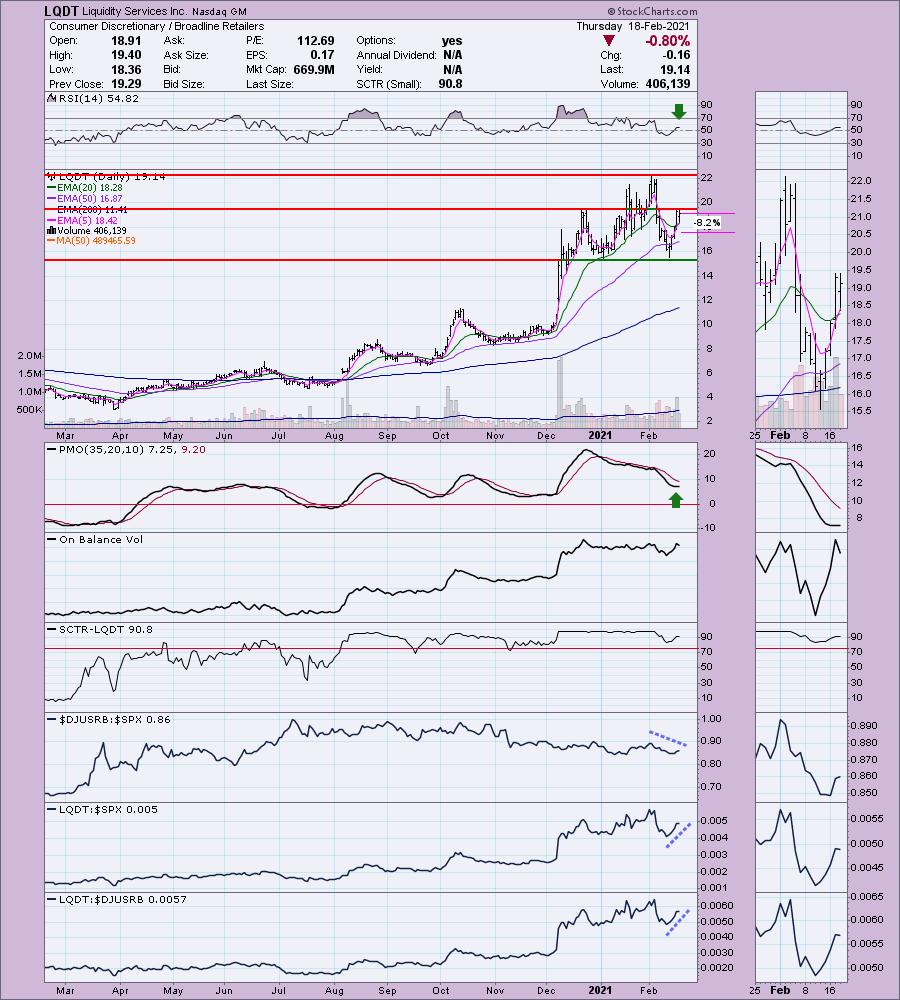
This is reader request number three. LQDT is down -3.37% in after hours trading. Not sure what the reason for that might be, but we do see that price has been stymied by overhead resistance at the December top. The PMO is trying to turn back up and we do see that price traded completely above the 20-EMA today. Additionally there was a positive 5/20-EMA crossover today which generally is a sign of strong positive momentum. The RSI is just moving positive. The OBV is showing a reverse divergence. The last OBV top is slightly higher than the previous, suggesting that volume has been coming in, but it hasn't moved price like it should. I'm not a fan of this one, although it is showing strong relative performance.
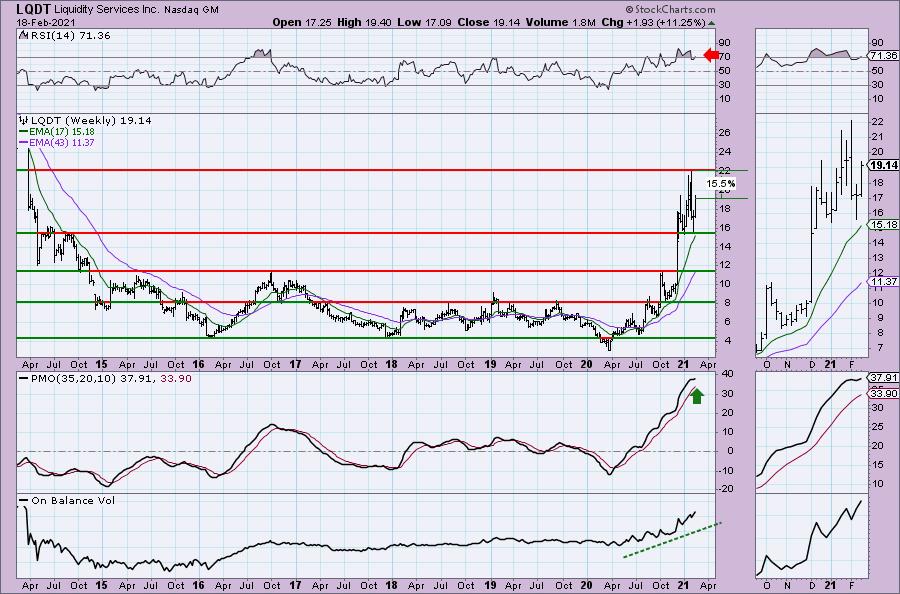
The weekly chart sports an overbought PMO and RSI. The PMO is bottoming above the signal line though and that is usually especially bullish. The weekly OBV is confirming this big rally out of the bear market low. If price can get back to January's high that would be a 15%+ gain.
Spirit Airlines, Inc. (SAVE)
EARNINGS: 5/5/2021 (AMC)
Spirit Airlines, Inc. is an airline that offers travel to price-conscious customers. Its customers start with an unbundled base fares that remove components included in the price of an airline ticket. The company was founded by Ned Homfeld in 1964 and is headquartered in Miramar, FL.
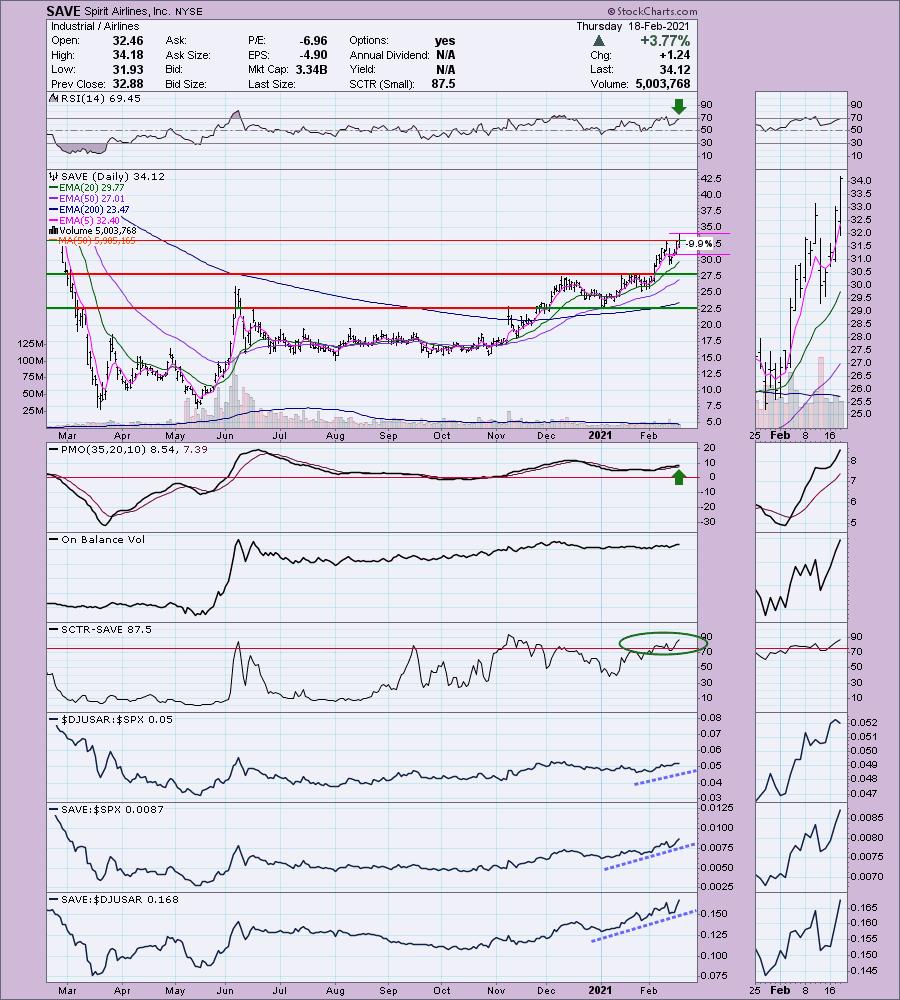
SAVE is up +0.06% in after hours trading. This is my final selection. If you're looking for an airline to invest in, this is a good choice given the clear outperformance in every way in 2021. I regret not trusting the early February breakout. The PMO just bottomed above the signal line and isn't that overbought. The RSI is positive, although getting overbought. I've set the stop level the deepest I usually go which is 10%. Unfortunately the clearest area of support is 12 - 13% lower than the current price.
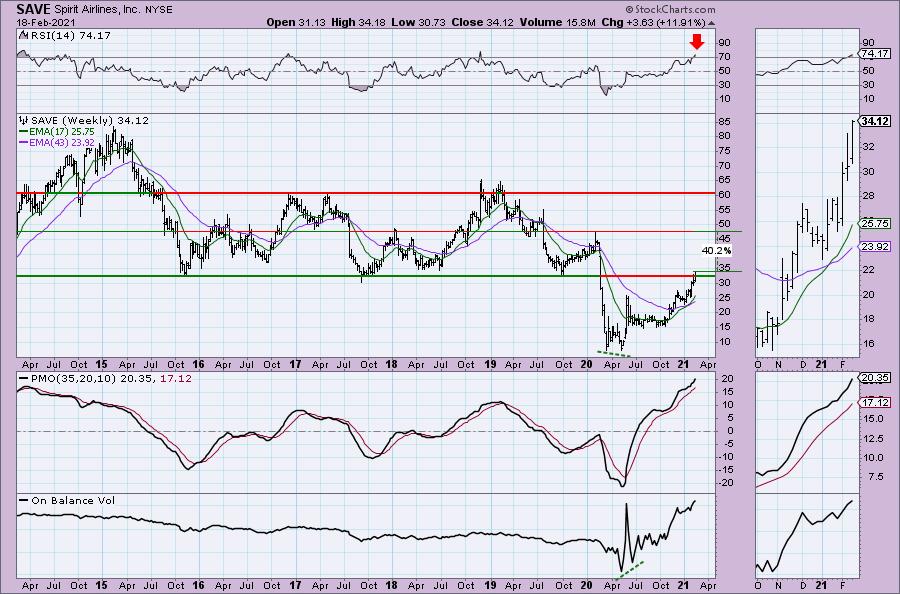
The weekly chart really impressed me given this week's breakout above very strong overhead resistance. I'm not pleased with the overbought RSI, but that price breakout should be a sign of more upside to come.
Full Disclosure: I'm about 80% invested and 10% is in 'cash', meaning in money markets and readily available to trade with. I had one of my stops trigger on a non-Diamond holding so my exposure was lowered somewhat.
Current Market Outlook:
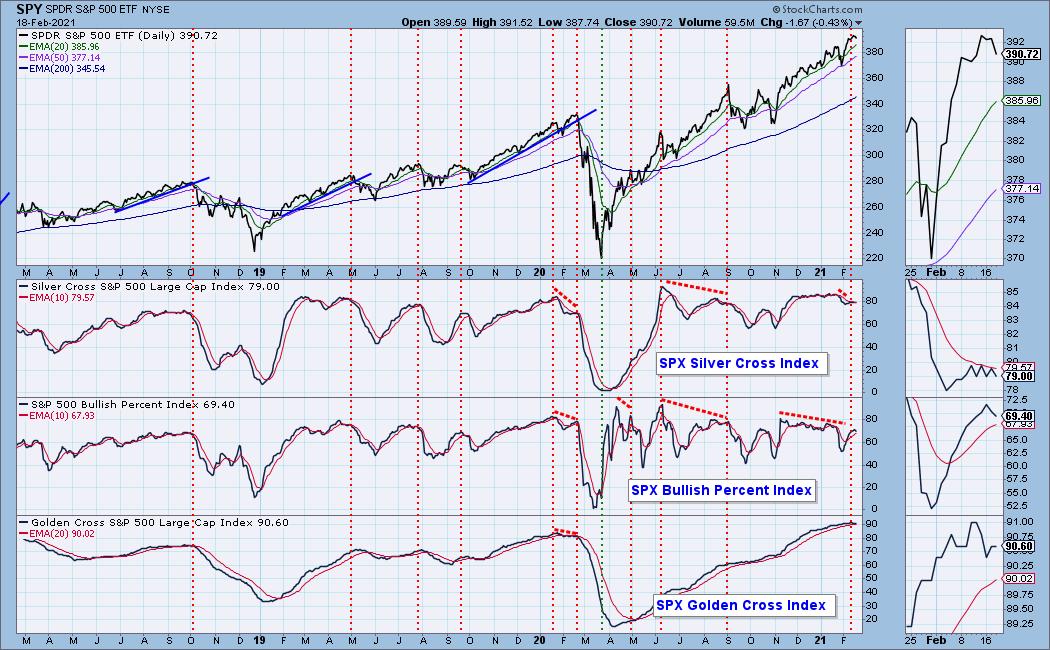
Market Environment: It is important to consider the odds for success by assessing the market tides. The following chart uses different methodologies for objectively showing the depth and trend of participation for intermediate- and long-term time frames.
- The Silver Cross Index (SCI) shows the percentage of SPX stocks on IT Trend Model BUY signals (20-EMA > 50-EMA)
- The Golden Cross Index (GCI) shows the percentage of SPX stocks on LT Trend Model BUY signals (50-EMA > 200-EMA)
- The Bullish Percent Index (BPI) shows the percentage of SPX stocks on Point & Figure BUY signals.
Don't forget that as a "Diamonds" member, you have access to our GCI/SCI curated ChartList on DecisionPoint.com. You'll find it under "Members Only" links on the left side on the Blogs and Links Page.
Here is the current chart:
Diamond Index:
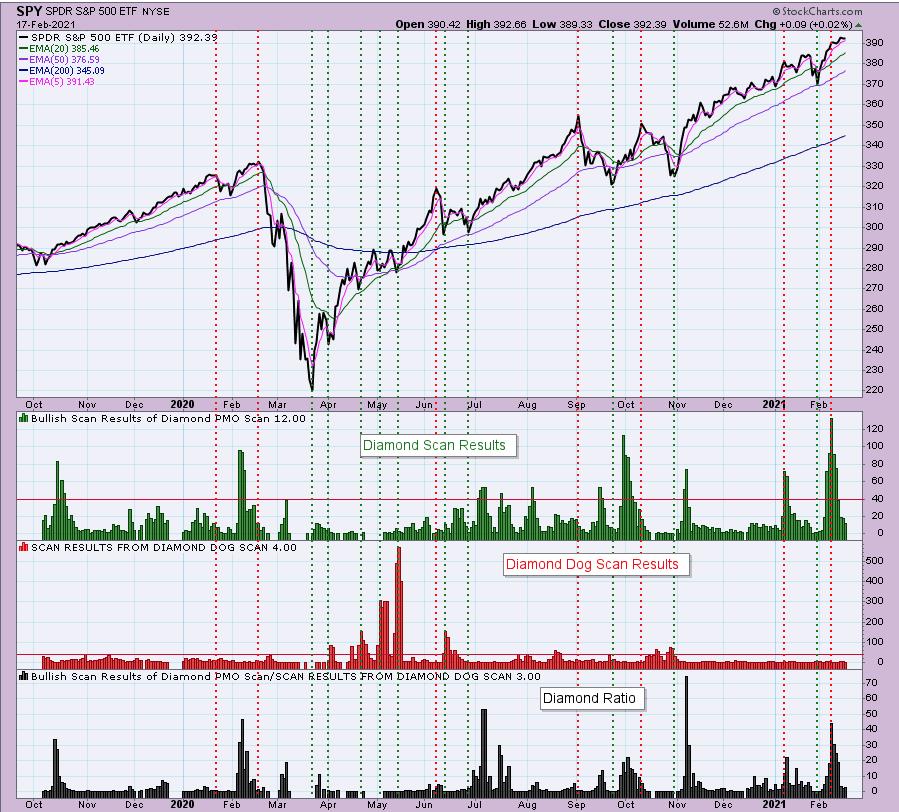
The Diamond Index chart looks at the number of scan results from my bullish Diamond PMO Scan and the number of scan results from the inverse Diamond Dog Scan. The Diamond Ratio divides the bullish results by the bearish results.
I only have data going back to October 2019 so I won't make any sweeping conclusions about the Diamond Index chart. I have marked cardinal tops with red dotted vertical lines and cardinal price bottoms with green dotted vertical lines. I believe that when the Diamond Dog results spike, it usually comes at a price bottom, or marks a strong continuation of the rising trend.
Unfortunately, the Diamond PMO Scan result numbers aren't providing much insight. The Diamond Ratio has promise, but again I don't see a clear correlation to the market tops/bottoms right now. I need to study and manipulate the data some more. Keep you posted!
Technical Analysis is a windsock, not a crystal ball.
Happy Charting!
- Erin
erin@decisionpoint.com
Watch the latest episode of DecisionPoint with Carl & Erin Swenlin on Mondays 7:00p EST or on the DecisionPoint playlist on the StockCharts TV YouTube channel here!
NOTE: The stocks reported herein are from mechanical trading model scans that are based upon moving average relationships, momentum and volume. DecisionPoint analysis is then applied to get five selections from the scans. The selections given should prompt readers to do a chart review using their own analysis process. This letter is not a call for a specific action to buy, sell or short any of the stocks provided. There are NO sure things or guaranteed returns on the daily selection of "diamonds in the rough."
Helpful DecisionPoint Links:
DecisionPoint Shared ChartList and DecisionPoint Chart Gallery
Price Momentum Oscillator (PMO)
Swenlin Trading Oscillators (STO-B and STO-V)
For more links, go to DecisionPoint.com!
