
I've decided to borrow from my friend, Tom Bowley's "price relative" ChartStyle. I have been using his price relative chart fairly regularly when I do my research on my "diamonds in the rough".
He compares the Industry Group to the SPX, the stock to the SPX and the stock to its Industry Group. The idea is to determine first, how well is the industry group performing against the SPX. Our preference is to find groups that are consistently outperforming or are beginning to outperform.
Next I want to see how the stock itself is performing against the SPX. We don't want a stock that is underperforming, but we can consider stocks that are keeping pace.
Finally, we want to see how the stock measures up to its brethren in the industry group. We want to find the best choices within that industry group.
This type of analysis adds a huge amount of depth to the charts I regularly use. It is a good yardstick for me to make sure that diamonds in the rough measure up across the market. It is possible to look at stocks relative to their sector or the sector against the SPX, but I feel that we get all of the pertinent information we need with the three relative performance measures I've chosen. Add the SCTR in there and we have a chart that is rich with information.
I won't necessarily comment on the indicators, but I will annotate or discuss it if it needs clarification. If you're having trouble understanding the information in those indicator windows, be sure to send me an email. I'll be going over this carefully in Friday's Diamond Mine.
If you wish to add these elements to your own charts and ChartStyles, simply click on the chart and it will bring it up in the StockCharts.com workbench. Just scroll down and you'll see the parameters to add. Or, you can simply save my ChartStyle.
The newest trend in my scan results is in Financials, particularly in the Insurance industry groups. I found two stocks in two different insurance industries that should continue to outperform within their groups based on their technicals. Of course I included another Materials stock and an interesting selection from Consumer Discretionary.
Today's "Diamonds in the Rough" are: AIG, ELAN, MOS, TMX and UNM.
 Diamond Mine Registration Information:
When: Feb 19, 2021 09:00 AM Pacific Time (US and Canada)
Register in advance for this webinar:
https://zoom.us/webinar/register/WN_hZpiKxUnQA22ujhtQU_eaA
After registering, you will receive a confirmation email containing information about joining the webinar, including the password.
=======================================================================
Recording Link:
Topic: DecisionPoint Diamond Mine (02/12/2021) LIVE Trading Room
Start Time : Feb 12, 2021 08:59 AM
Meeting Recording:
https://zoom.us/rec/share/TswuF5ycojoVZr1JNJiA-P9xga6xo-VE39__5jO1s-vUNqT7GUSMUgWj1YAtefE.LlSu71tsdnE_5q7r
Access Passcode: *hSE68dy
David Keller, CMT, Chief Technical Analyst at StockCharts.com will be joining me in the free DP Trading Room on March 1st! Dave will give us his take on the market and share his trading methodologies as both of us discuss your symbol requests.

David Keller, CMT is Chief Market Strategist at StockCharts.com, where he helps investors minimize behavioral biases through technical analysis. He is a frequent host on StockCharts TV, and he relates mindfulness techniques to investor decision making in his blog, The Mindful Investor. David is also President and Chief Strategist at Sierra Alpha Research LLC, a boutique investment research firm focused on managing risk through market awareness. He combines the strengths of technical analysis, behavioral finance, and data visualization to identify investment opportunities and enrich relationships between advisors and clients.
***Click here to register for this recurring free DecisionPoint Trading Room on Mondays at Noon ET!***
+++++++++++++++++++++++++++++++++++++++++++++++++++++++++++++++++++++++++++++++
Here is the information for the Tuesday 2/16/2021 recording:
Topic: DecisionPoint Trading Room Recording 2/16/2021
Meeting Recording:
https://zoom.us/rec/share/G4hnZKpDiDxpK3jFBaao-qVqCJWjEgJNyWn9lueufB-sO-iomygo7tot1vaFKbu7.6013TODA9_Zlb0Jc
Access Passcode: i^96E7mf
For best results, copy and paste the access code to avoid typos.
Welcome to DecisionPoint Daily Diamonds, wherein I highlight five "diamonds in the rough." These are selected from the results of my DecisionPoint scans, which search for stocks that could benefit from the trend and condition of the market. Remember, these are not recommendations to buy or sell, but are the most interesting of the stocks that surfaced in my scans. My objective is to save you the work of the initial, tedious culling process, but you need to apply your own analysis to see if these stocks pique your interest as well. There are no guaranteed winners here!
American Intl Group, Inc. (AIG)
EARNINGS: 5/4/2021 (AMC)
American International Group, Inc. engages in the provision of a range of property casualty insurance, life insurance, retirement products, and other financial services to commercial and individual customers. It operates through the following segments: General Insurance, Life and Retirement, Other Operations, and Legacy Portfolio. The General Insurance segment consists of insurance businesses in North America and International business areas. The Life and Retirement segment includes Individual Retirement, Group Retirement, Life Insurance, and Institutional Markets. The Other Operations segment covers income from assets held by the company and other corporate subsidiaries. The Legacy Portfolio segment consists of run-off insurance lines and legacy investments. The company was founded by Cornelius Vander Starr in 1919 and is headquartered in New York, NY.
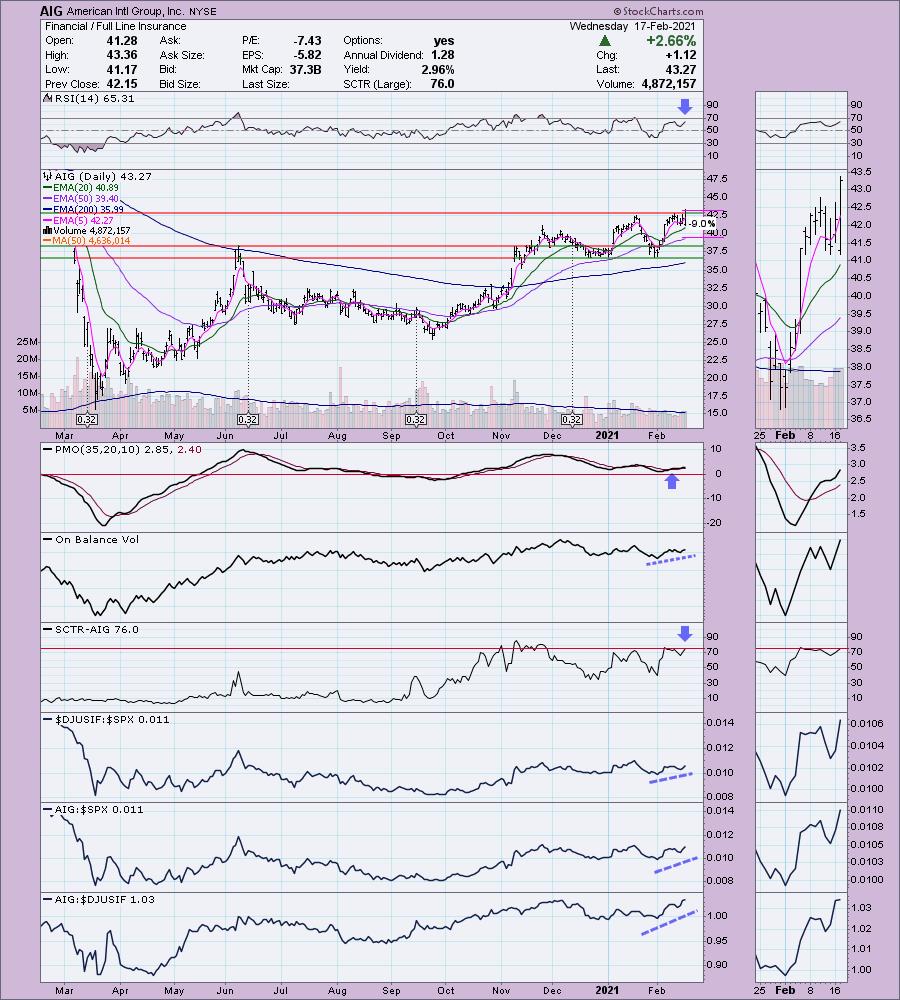
AIG is down -0.51% in after hours trading. AIG broke out above overhead resistance after reporting earnings after the bell yesterday. I don't use candlesticks, but today we did get a bullish engulfing candle. It engulfed the previous seven days of trading! The RSI is positive and the PMO is rising out of oversold territory. I'd like to see the OBV making a new high on this breakout, but usually you can't have everything. Notice that Full Line Insurance is beginning to outperform the market and AIG is outperforming both. I set the stop level at the 50-EMA.
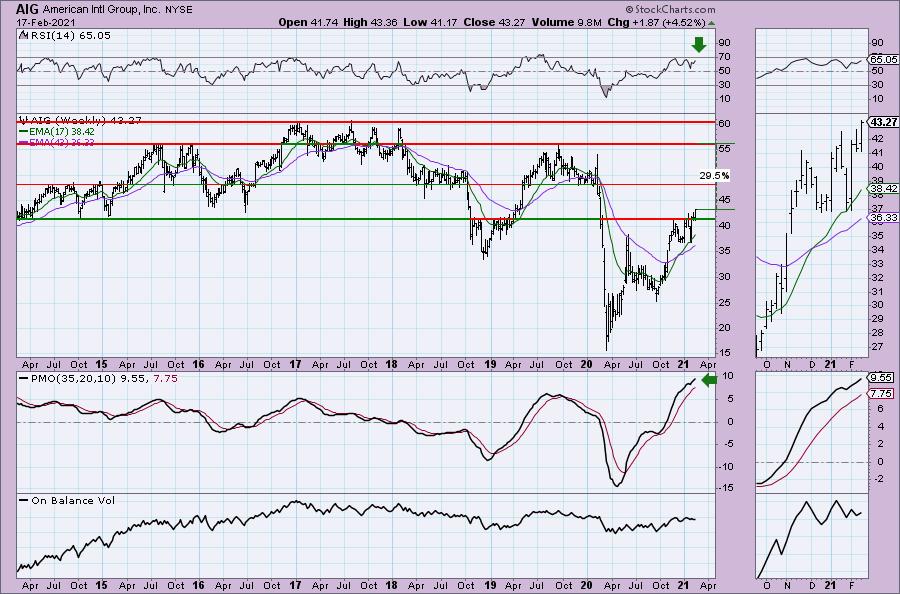
The weekly PMO is overbought, but it is rising nicely and the RSI is positive. You can see that price has broken above important overhead resistance. I'd be happy with the 12%+ gain should it reach the next level of resistance, but it certainly could continue higher to challenge the 2019 top.
Elanco Animal Health Inc. (ELAN)
EARNINGS: 2/24/2021 (BMO)
Elanco Animal Health, Inc. engages in the innovation, development, manufacture and market products for companion and food animals. It offers products through the following four categories: Companion Animal Disease Prevention, Companion Animal Therapeutics, Food Animal Future Protein & Health, and Food Animal Ruminants & Swine. The Companion Animal Disease Prevention category engages in the broadest parasiticide portfolios in the companion animal sector based on indications, species and formulations, with products that protect pets from worms, fleas and ticks. The Companion Animal Therapeutics category provides the details of broad pain and osteoarthritis portfolio across species, modes of action, indications and disease stages. The Food Animal Future Protein & Health category includes vaccines, nutritional enzymes and animal-only antibiotics, serves the growing demand for protein and includes innovative products in poultry and aquaculture production, where demand for animal health products is outpacing overall industry growth. It also focuses on developing functional nutritional health products that promote food animal health, including enzymes, probiotics and prebiotics. The Food Animal Ruminants & Swine category develops animal food products used in ruminant and swine production. The company was founded on May 3, 2018 and is headquartered in Greenfield, IN.
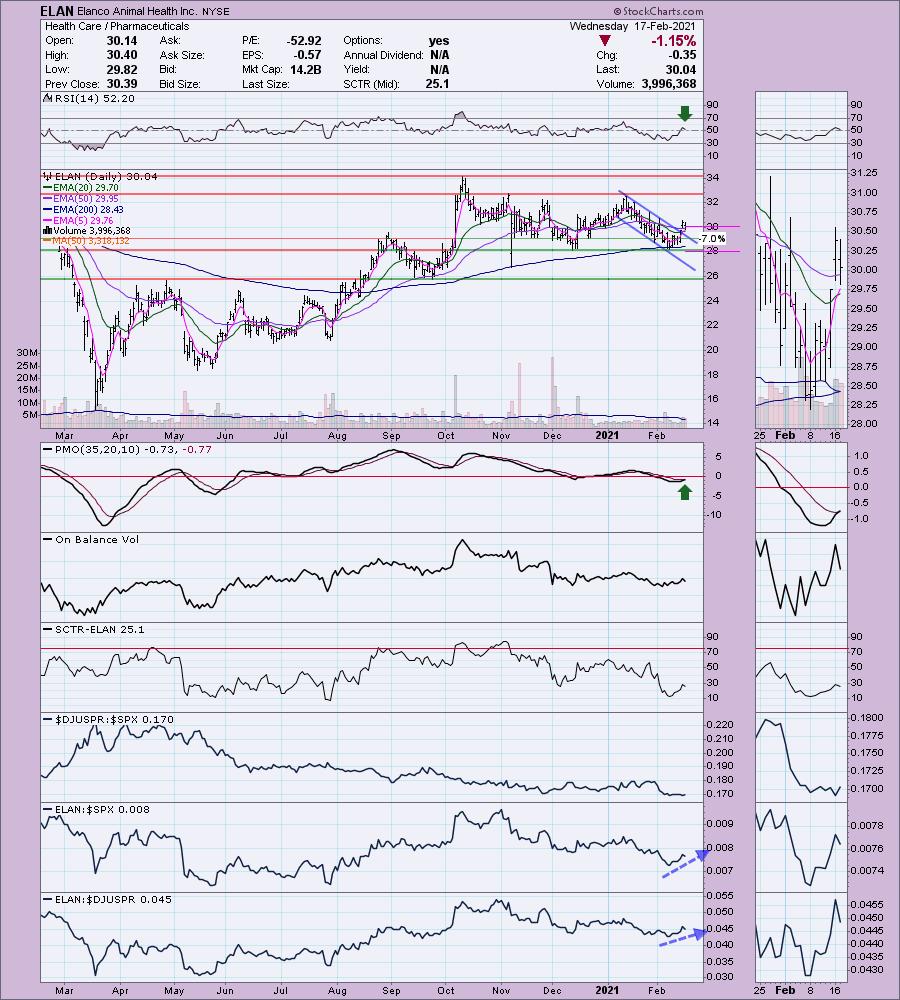
ELAN is unchanged in after hours trading. You'll notice that the Pharmaceuticals industry group is basically keeping pace with the SPX right now, yet ELAN is beginning to outperform them both. The PMO just triggered a crossover BUY signal on this breakout from the declining trend channel. The RSI is positive. The OBV began changing direction before the final bottom came in. This set up a slight positive divergence between price bottoms going into the low. The SCTR is rising. You can set a reasonable 7% stop just below support.
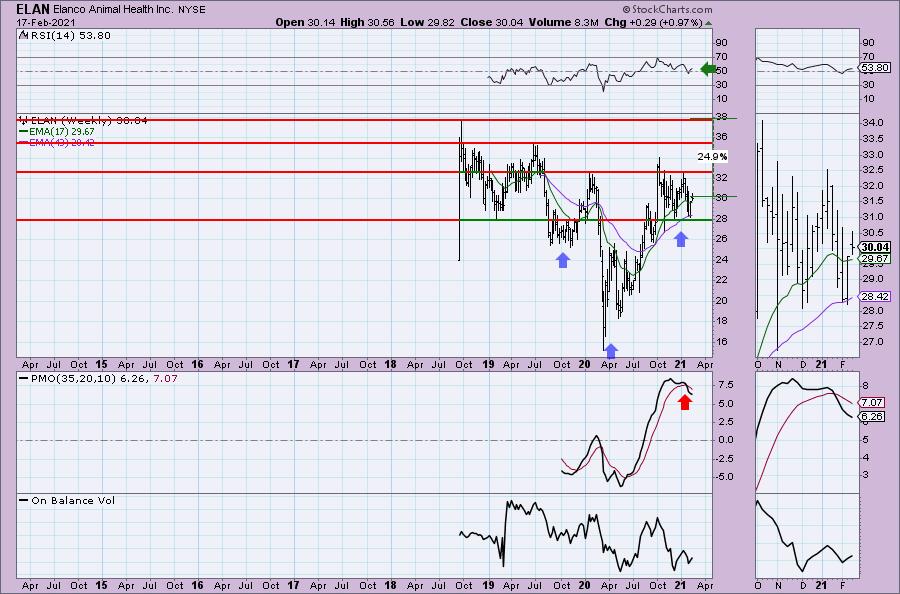
I don't like the PMO SELL signal, but it is decelerating somewhat. I think you could make a case for a large reverse head and shoulders forming. If we get the breakout above $34, the minimum upside target would be well above the target I've annotated, at $48.
Mosaic Co. (MOS)
EARNINGS: 2/17/2021 (AMC) - REPORTED TODAY
The Mosaic Co. engages in the production and marketing of concentrated phosphate and potash crop nutrients. The company operates its businesses through its wholly and majority owned subsidiaries. It operates through the following segments: Phosphates, Potash, and Mosaic Fertilizantes. The Phosphates segment owns and operates mines and production facilities in North America which produces concentrated phosphate crop nutrients and phosphate-based animal feed ingredients, and concentrated crop nutrients. The Potash segment owns and operates potash mines and production facilities in North America which produce potash-based crop nutrients, animal feed ingredients, and industrial products. The Mosaic Fertilizantes segment produces and sell phosphate and potash-based crop nutrients, and animal feed ingredients, in Brazil. The company was founded on October 22, 2004 and is headquartered in Plymouth, MN.
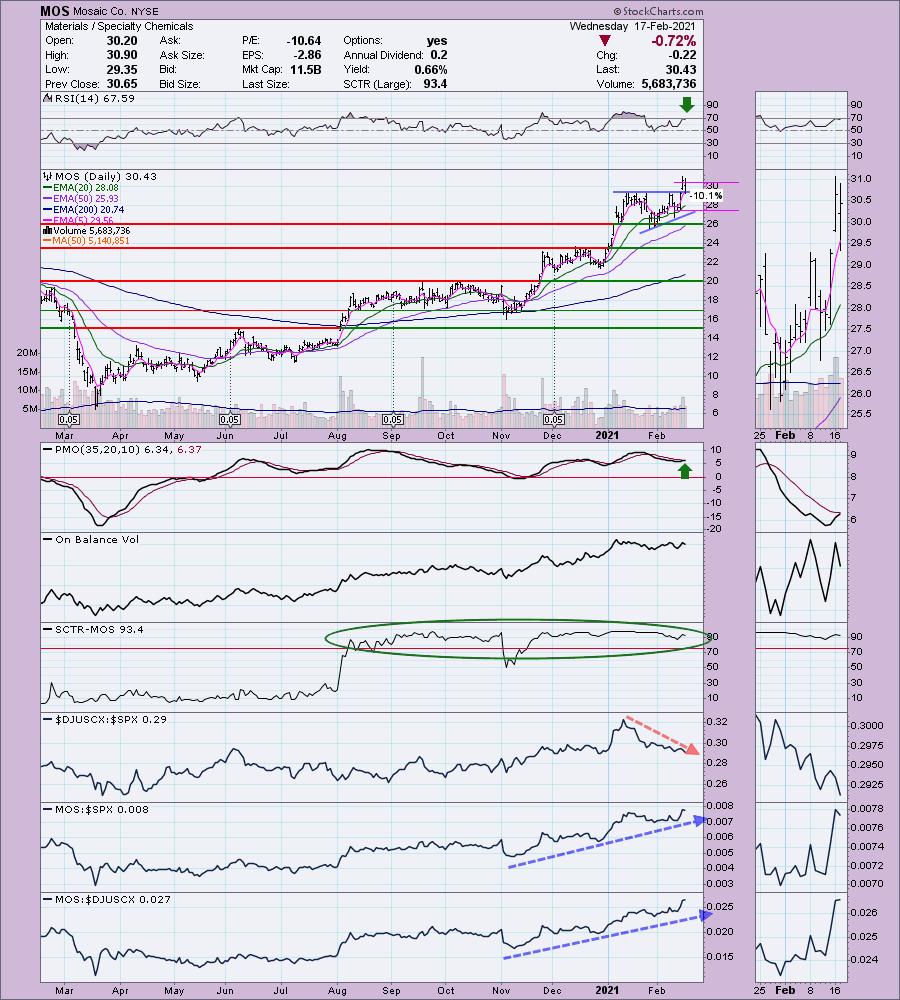
MOS reported earnings after the bell and is already up +2.69%. The Materials sector is healthy, but this industry group is not. This did not preclude me from including it. Look at how it has been consistently outperforming its industry group and the market for some time. Yesterday price broke out from a bullish ascending triangle. The back of the napkin minimum upside target of the pattern would take price to $34. The PMO is about to trigger a crossover BUY signal and the RSI is positive and not quite overbought.
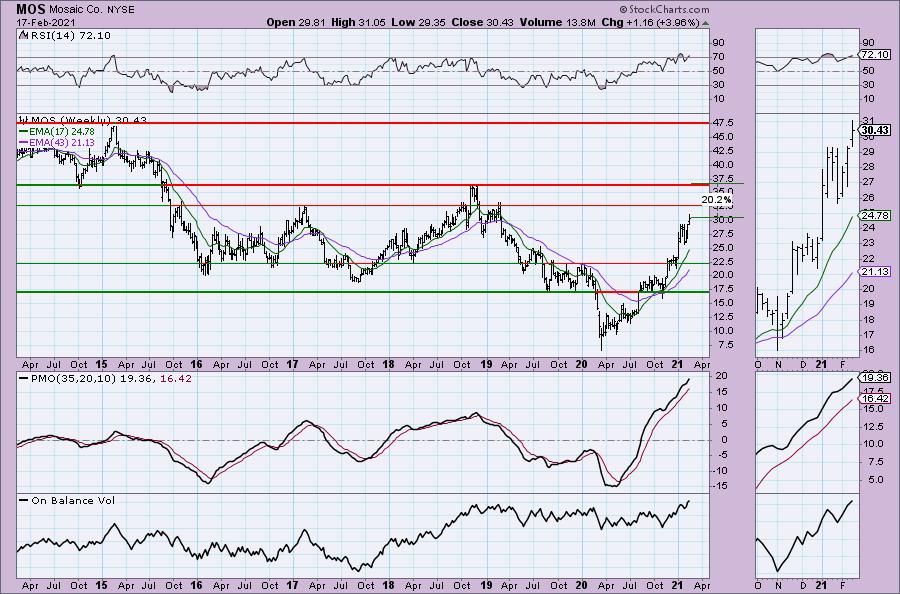
The weekly chart is healthy given the rising PMO and strong RSI. They are both overbought right now so keep an eye on it.
Don't forget, on Thursdays I look at reader-requested symbols, so shoot me an email at erin@decisionpoint.com. I read every email I receive and try to answer them all!
Terminix Global Holdings, Inc. (TMX)
EARNINGS: 2/25/2021 (BMO)
Terminix Global Holdings, Inc. engages in the provision of residential and commercial services. It offers residential and commercial termite and pest control, national accounts pest control services, restoration, commercial cleaning, residential cleaning, cabinet and furniture repair, and home inspections. It operates through the following segments: Terminix, ServiceMaster Brands, and Corporate. The Terminix segment focuses on providing termite remediation, annual termite inspection and prevention, periodic pest control services, insulation services, crawlspace encapsulation, wildlife exclusion, and treatments with termite damage repair guarantees to residential and commercial customers. The ServiceMaster Brands segment consists of the ServiceMaster Restore, ServiceMaster Clean, Merry Maids, Furniture Medic, and AmeriSpec businesses. The Corporate segment includes corporate operations which provide various technology, human resources, finance, legal, and other support services to the reportable segments. The company was founded by Marion W. Wade in 1929 and is headquartered in Memphis, TN.
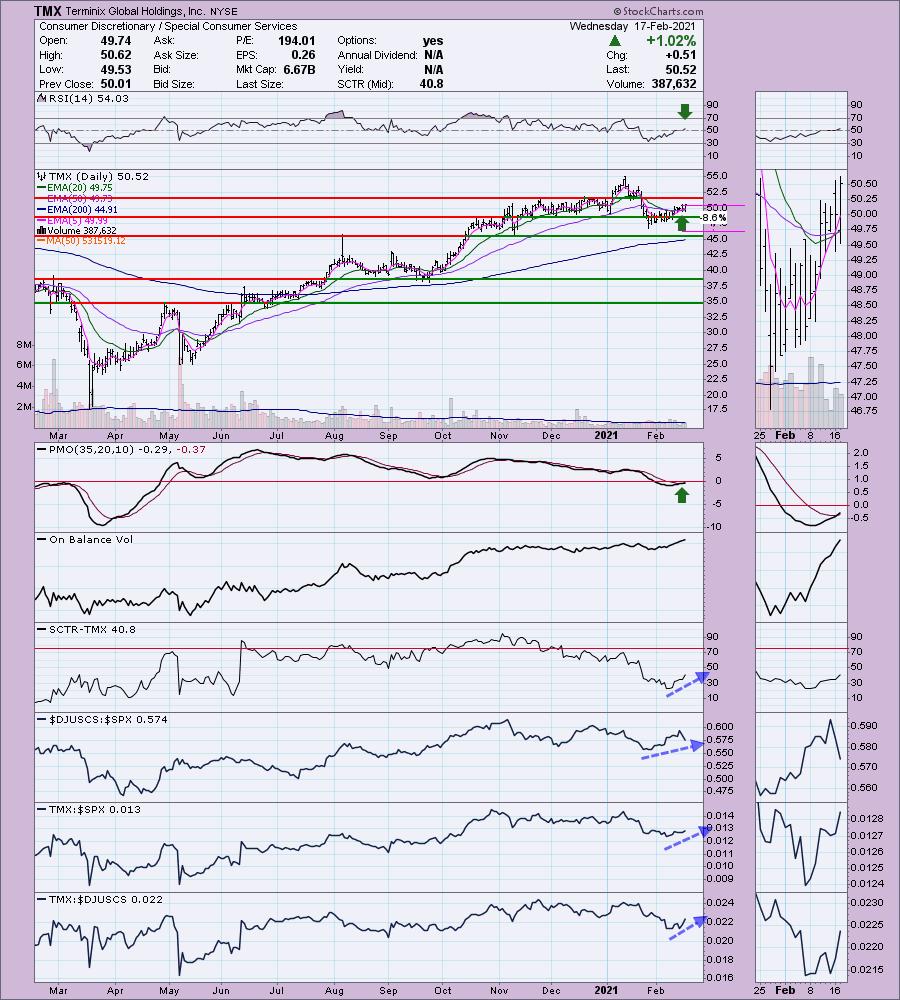
TMX is unchanged in after hours trading. This one is a bit of a slow mover, but it is set up to not only challenge the January high, but proceed higher to test its all-time high from 2019. The PMO just gave us a crossover BUY signal and the RSI moved into positive territory above net neutral (50). This industry group has been outperforming, although of late, it is beginning to lose ground against the SPX unlike TMX against the SPX which is beginning to rise in the thumbnail. Price is about to reach overhead resistance, but I am looking for a breakout given the new IT Trend Model BUY signal that triggered today when the 20-EMA crossed above the 50-EMA.
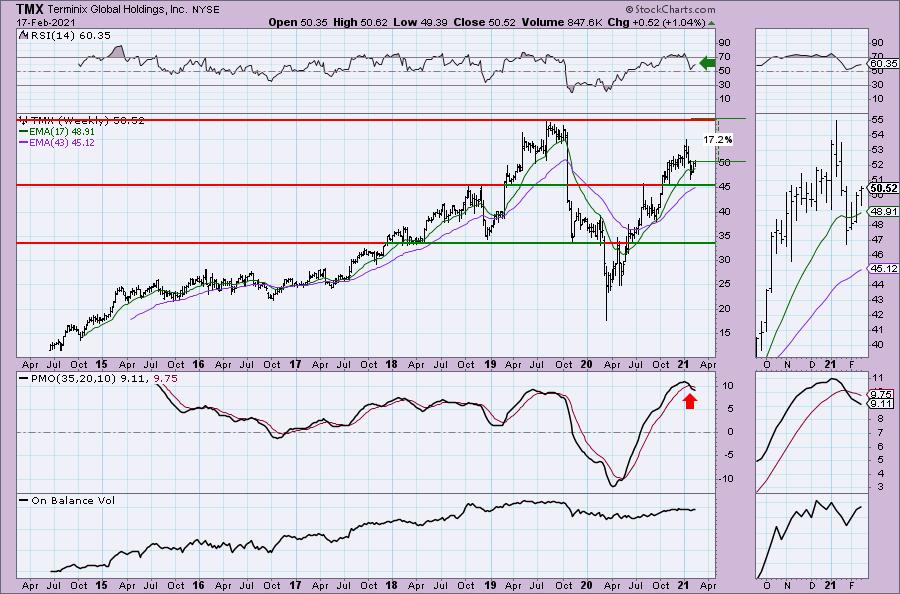
I am looking for TMX to give us a 17%+ gain. The RSI is positive. The PMO is a bit ominous, but the bounce off support just above $45 is bullish and we do see the PMO decelerating somewhat.
Unum Group (UNM)
EARNINGS: 5/3/2021 (AMC)
Unum Group is engaged in providing financial protection benefits. It operates through the following segments: Unum U.S., Unum UK, Colonial Life, Closed Block and Corporate. The Unum U.S. segment comprises of group long-term and short-term disability insurance, group life and accidental death and dismemberment products, and supplemental and voluntary lines of business. The Unum UK segment offers insurance for group long-term disability, group life, and supplemental lines of business which include dental, individual disability, and critical illness products. The Colonial Life segment includes insurance for accident, sickness, disability products, life products, and cancer and critical illness products. The Closed Block segment consists of individual disability, group and individual long-term care, and other insurance products no longer actively marketed. The Corporate segment refers to investment income on corporate assets and other corporate income and expenses not allocated to a line of business; and interest expense on corporate debt other than non-recourse debt. The company was founded in 1848 and is headquartered in Chattanooga, TN.
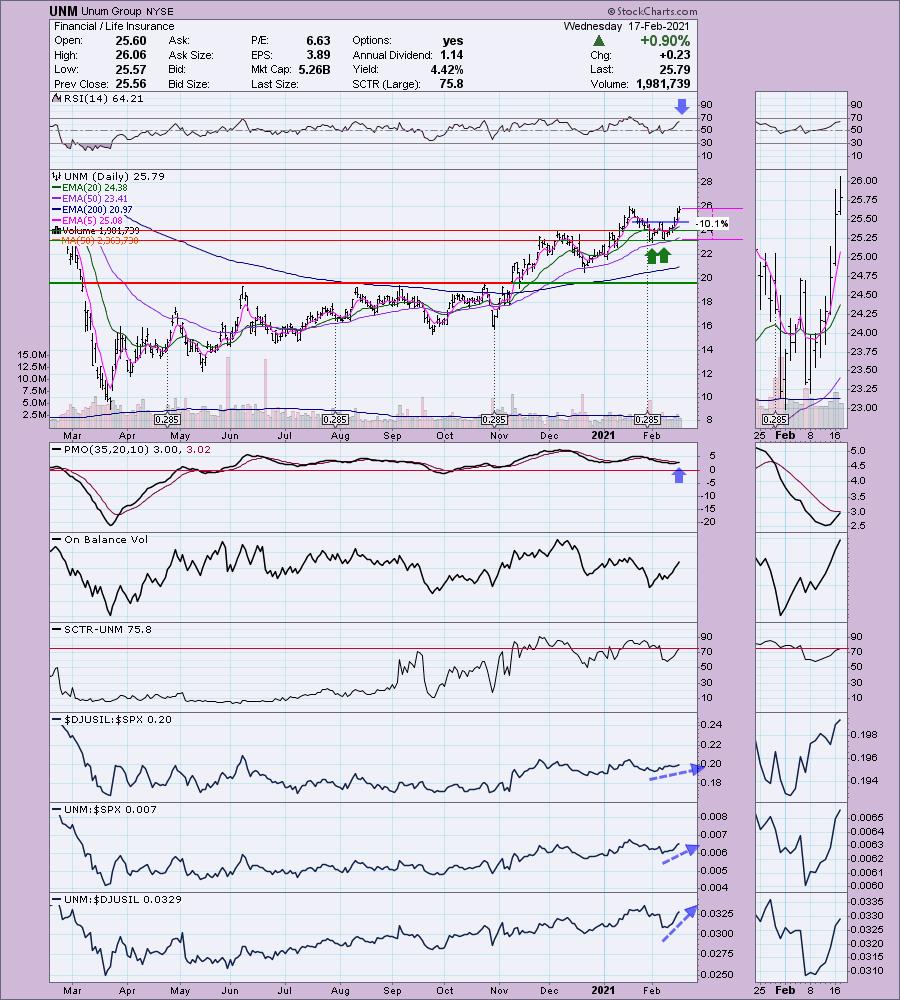
UNM is unchanged in after hours trading. We can see new outperformance from the group and UNM against the SPX. The PMO should give us a crossover BUY signal tomorrow. The RSI is positive. One issue is overhead resistance at $26. However, given the execution of the double-bottom, there is an upside target at $26.75 which is above that resistance level. We are beginning to see this group as well as this stock, outperforming the market. It certainly is outperforming its industry group right now. It's a rather deep stop, but it is necessary. I want it below the December tops and as close to the bottom of the pattern as possible.
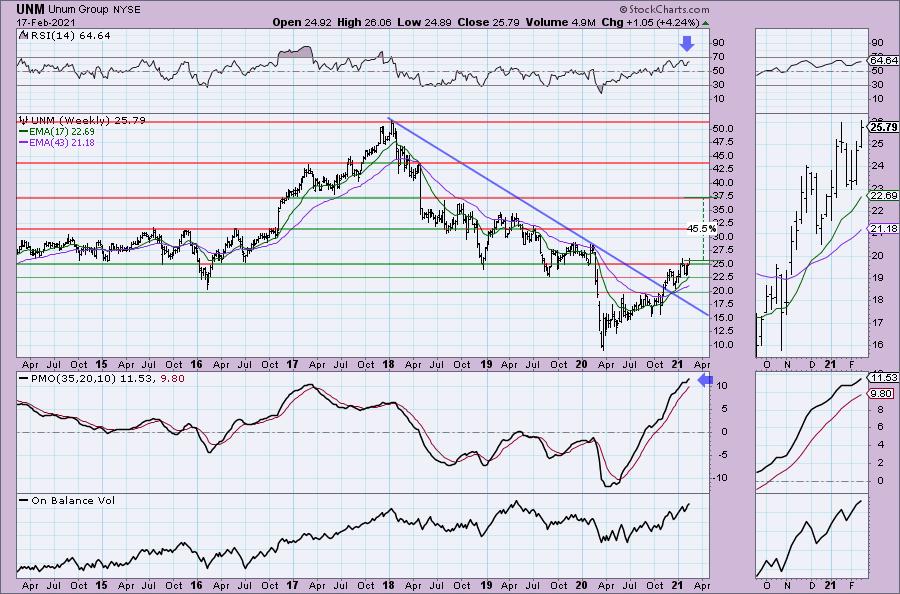
The PMO and RSI are both positive and rising. The RSI isn't overbought, but the PMO is. Price is having to struggle against resistance at $25, but if it can break above, there is upside potential of at least 20% if not more.
Full Disclosure: I'm about 85% invested and 15% is in 'cash', meaning in money markets and readily available to trade with. I didn't add any Diamonds and my stops are intact.
Current Market Outlook:
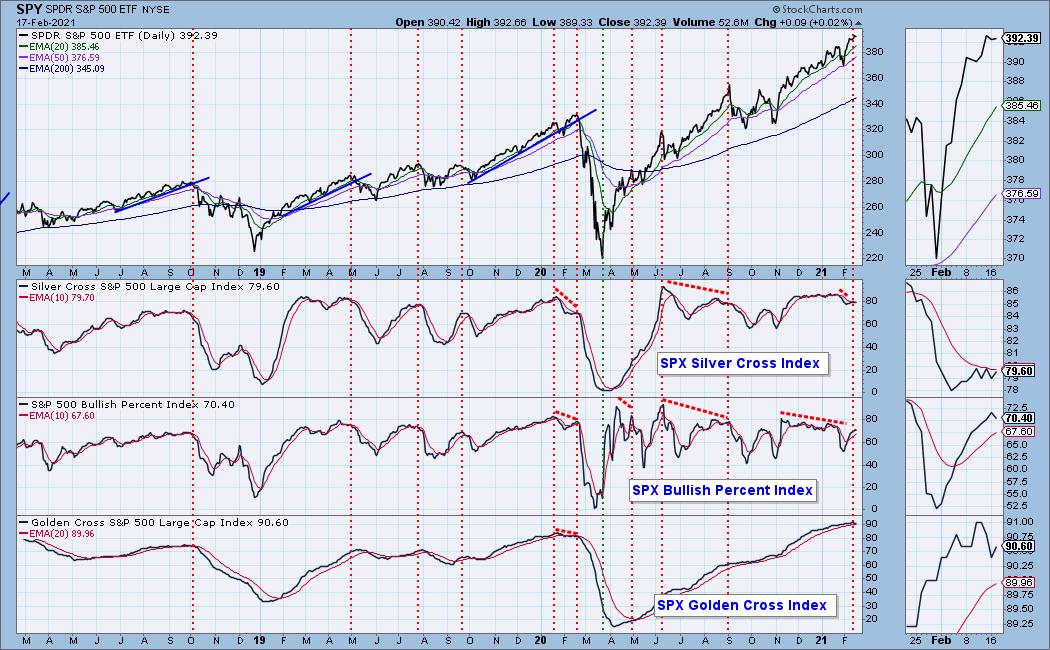
Market Environment: It is important to consider the odds for success by assessing the market tides. The following chart uses different methodologies for objectively showing the depth and trend of participation for intermediate- and long-term time frames.
- The Silver Cross Index (SCI) shows the percentage of SPX stocks on IT Trend Model BUY signals (20-EMA > 50-EMA)
- The Golden Cross Index (GCI) shows the percentage of SPX stocks on LT Trend Model BUY signals (50-EMA > 200-EMA)
- The Bullish Percent Index (BPI) shows the percentage of SPX stocks on Point & Figure BUY signals.
Don't forget that as a "Diamonds" member, you have access to our GCI/SCI curated ChartList on DecisionPoint.com. You'll find it under "Members Only" links on the left side on the Blogs and Links Page.
Here is the current chart:
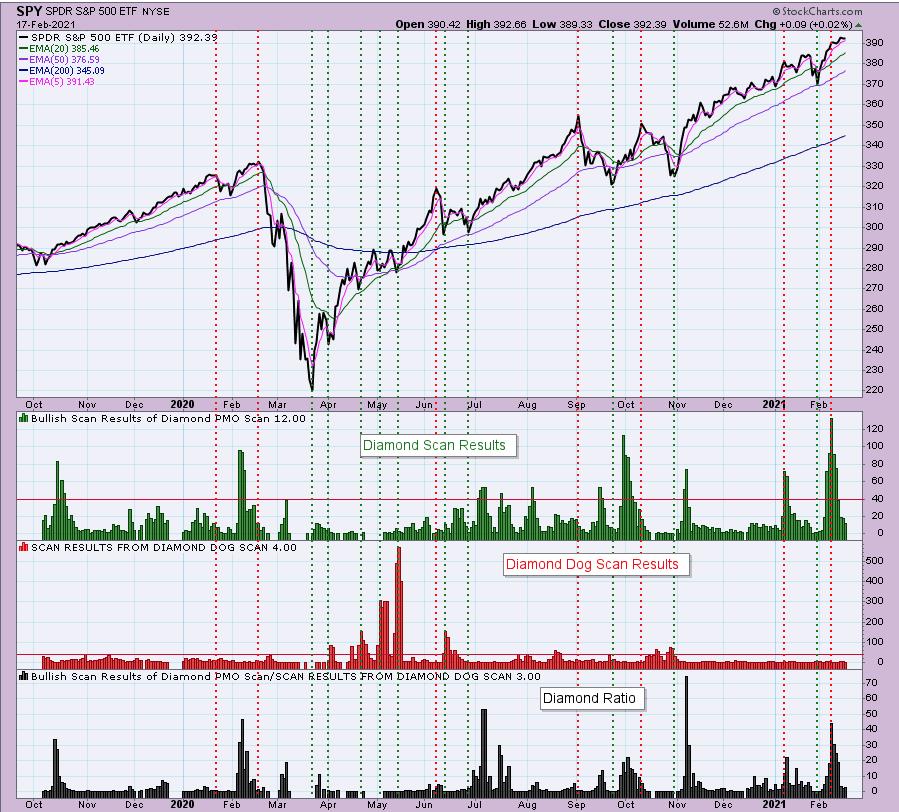
Diamond Index:
Technical Analysis is a windsock, not a crystal ball.
Happy Charting!
- Erin
erin@decisionpoint.com
Watch the latest episode of DecisionPoint with Carl & Erin Swenlin on Mondays 7:00p EST or on the DecisionPoint playlist on the StockCharts TV YouTube channel here!
NOTE: The stocks reported herein are from mechanical trading model scans that are based upon moving average relationships, momentum and volume. DecisionPoint analysis is then applied to get five selections from the scans. The selections given should prompt readers to do a chart review using their own analysis process. This letter is not a call for a specific action to buy, sell or short any of the stocks provided. There are NO sure things or guaranteed returns on the daily selection of "diamonds in the rough."
Helpful DecisionPoint Links:
DecisionPoint Shared ChartList and DecisionPoint Chart Gallery
Price Momentum Oscillator (PMO)
Swenlin Trading Oscillators (STO-B and STO-V)
For more links, go to DecisionPoint.com!
