
As I prepared to write the report today, I noticed that we saw a great showing among last week's "diamonds in the rough" today. The charts are maturing nicely as Materials is finally making the move I've been waiting for. Additionally a few of the Banks I listed as "diamonds in the rough" are doing well. RUN had a difficult day, but the rising trend is intact and ultimately it was a bad day for Solar altogether.
The charts that looked the best today came primarily from the Industrials sector. I threw in a Financial and the industry group that could be coming back to life is Metals and Mining. I found an ETF that should take advantage of the breakout and likely follow-through ahead this week. Within Metals and Mining, the "rare earth metals", Lithium, Uranium as well as aluminum and steel continue to outperform. Gold Miners I'm a little less excited about but given the others should do well that could carry them along.
I made Semiconductors the industry group to watch this week. Well they popped today, so much so, that I opted not to include them today as they should pull back a bit tomorrow, at which time I'll likely add a few my current favorite is Micron (MU).
Today's "Diamonds in the Rough" are: CSX, EPAC, ERII, SEIC and XME.
 Diamond Mine Registration Information:
When: Feb 19, 2021 09:00 AM Pacific Time (US and Canada)
Register in advance for this webinar:
https://zoom.us/webinar/register/WN_hZpiKxUnQA22ujhtQU_eaA
After registering, you will receive a confirmation email containing information about joining the webinar, including the password.
=======================================================================
Recording Link:
Topic: DecisionPoint Diamond Mine (02/12/2021) LIVE Trading Room
Start Time : Feb 12, 2021 08:59 AM
Meeting Recording:
https://zoom.us/rec/share/TswuF5ycojoVZr1JNJiA-P9xga6xo-VE39__5jO1s-vUNqT7GUSMUgWj1YAtefE.LlSu71tsdnE_5q7r
Access Passcode: *hSE68dy
David Keller, CMT, Chief Technical Analyst at StockCharts.com will be joining me in the free DP Trading Room on March 1st! Dave will give us his take on the market and share his trading methodologies as both of us discuss your symbol requests.

David Keller, CMT is Chief Market Strategist at StockCharts.com, where he helps investors minimize behavioral biases through technical analysis. He is a frequent host on StockCharts TV, and he relates mindfulness techniques to investor decision making in his blog, The Mindful Investor. David is also President and Chief Strategist at Sierra Alpha Research LLC, a boutique investment research firm focused on managing risk through market awareness. He combines the strengths of technical analysis, behavioral finance, and data visualization to identify investment opportunities and enrich relationships between advisors and clients.
***Click here to register for this recurring free DecisionPoint Trading Room on Mondays at Noon ET!***
+++++++++++++++++++++++++++++++++++++++++++++++++++++++++++++++++++++++++++++++
Here is the information for the Tuesday 2/16/2021 recording:
Topic: DecisionPoint Trading Room Recording 2/16/2021
Meeting Recording:
https://zoom.us/rec/share/G4hnZKpDiDxpK3jFBaao-qVqCJWjEgJNyWn9lueufB-sO-iomygo7tot1vaFKbu7.6013TODA9_Zlb0Jc
Access Passcode: i^96E7mf
For best results, copy and paste the access code to avoid typos.
Welcome to DecisionPoint Daily Diamonds, wherein I highlight five "diamonds in the rough." These are selected from the results of my DecisionPoint scans, which search for stocks that could benefit from the trend and condition of the market. Remember, these are not recommendations to buy or sell, but are the most interesting of the stocks that surfaced in my scans. My objective is to save you the work of the initial, tedious culling process, but you need to apply your own analysis to see if these stocks pique your interest as well. There are no guaranteed winners here!
CSX Corp. (CSX)
EARNINGS: 4/21/2021 (AMC)
CSX Corp. engages in the provision of rail-based freight transportation services. Its services include rail service, the transport of intermodal containers and trailers, rail-to-truck transfers and bulk commodity operations. The company was founded in 1827 and is headquartered in Jacksonville, FL.
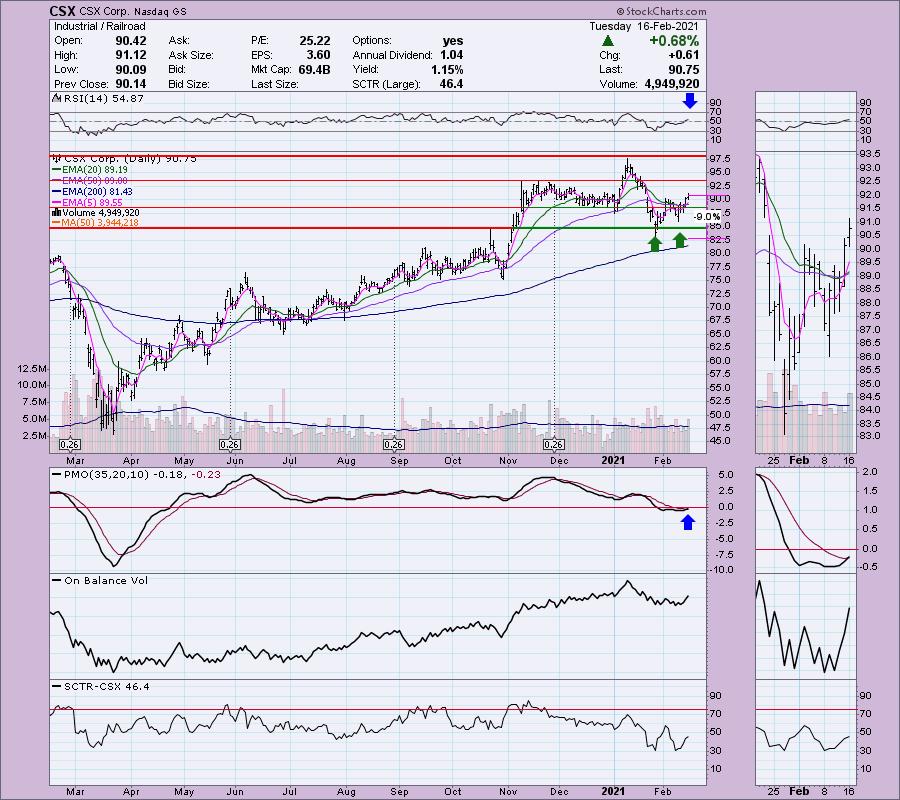
CSX is unchanged in after hours trading. I covered CSX in the August 11th 2020 Diamonds Report. I didn't have a stop listed, but it wouldn't have matter as it never really went lower after being picked. It is currently up +20.8% since then. It's back on the radar today as we saw a nice breakout that is confirming a short-term double-bottom formation. The PMO triggered a crossover BUY signal today and the RSI has just moved into positive territory. The OBV is setting a higher high with price on the break above the confirmation line draw at $90. The pattern suggests we will challenge the January top. The stop level is set at the January low.
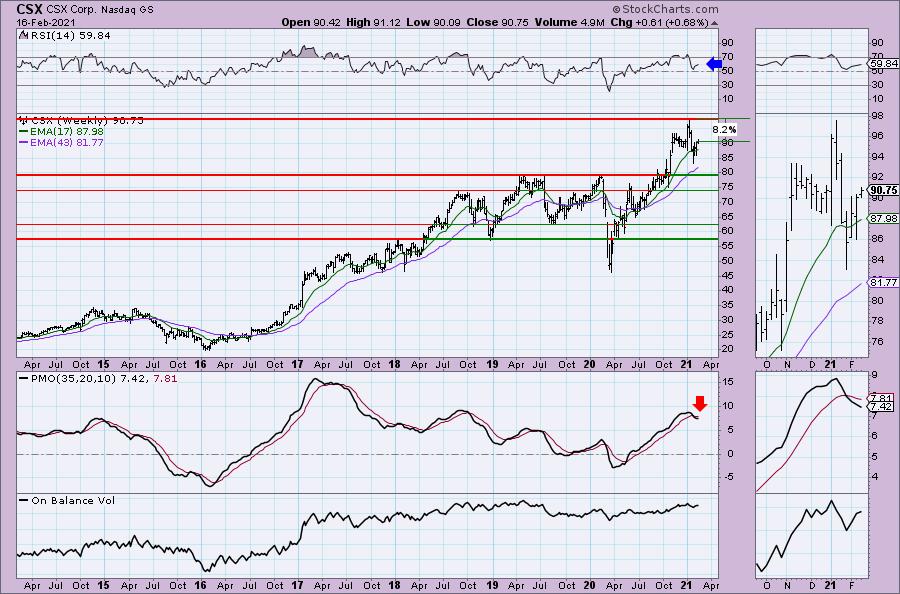
The weekly PMO is on a SELL signal, but it is trying to curly back up. It isn't overbought, so if it does turn around, it will have room to move higher with price. Right now we are looking at a little over 8% to get back to its all-time high.
Actuant Corp. (EPAC)
EARNINGS: 3/18/2021 (BMO)
Enerpac Tool Group Corp. is a diversified industrial company. The firm engages in the designing, manufacturing, and distribution of industrial products and systems to various end markets. It operates through the following segments: Industrial Tools and Services; and Other. The Industrial Tools and Services segment supplies both products and services to a broad array of end markets, including industrial, energy, mining and production automation markets. The Other operating segments designs and manufactures high performance synthetic ropes and biomedical assemblies. The company was founded in 1910 and is headquartered in Menomonee Falls, WI.
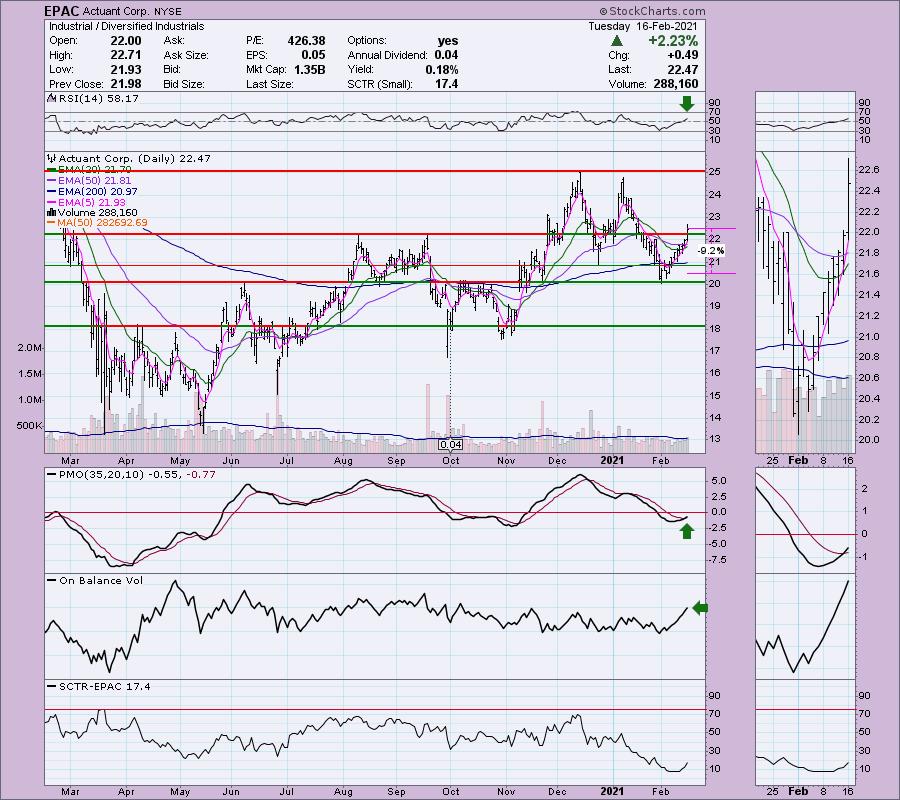
EPAC is unchanged in after hours trading. I really liked this chart as soon as I saw it. Today's breakout is impressive. The 20-EMA is about to cross above the 50-EMA which will trigger an IT Trend Model BUY signal. The OBV showing plenty of accumulation. Unfortunately the OBV is in a reverse divergence with price. The OBV has broken above its previous tops, but price has not. So despite heavy volume, the OBV suggests we should be at higher prices. I'll forgive that given the new PMO BUY signal and the RSI now in positive territory. The SCTR is very low but is beginning to improve. The stop is set well below the 200-EMA. You could actually tighten that up somewhat.
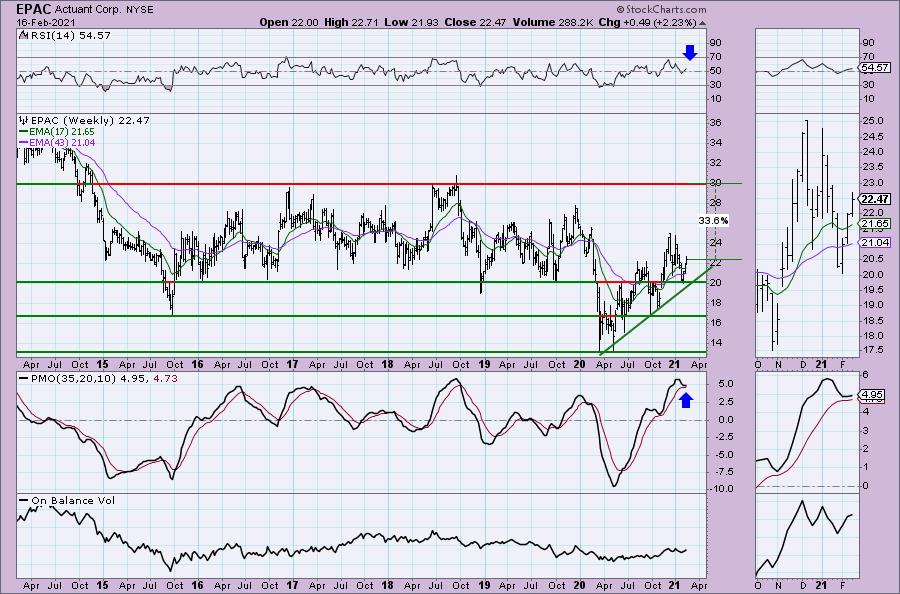
The weekly PMO topped in overbought territory, but it has now turned back around. I find bottoms above the signal line to be especially bullish. The rising trend out of the bear market low is intact. In fact this last decline didn't require a test of the trend before reversing. That also is particularly bullish. The RSI is positive and not overbought.
Energy Recovery Inc. (ERII)
EARNINGS: 3/11/2021 (AMC)
Energy Recovery, Inc. engages in the design and manufacture of industrial fluid flow solutions. It operates through the Water; and Oil and Gas segments. The Water segment represents the solutions sold for use in sea, brackish, and contaminated water reverse osmosis desalination. The Oil and Gas segment refers to the solutions used for hydraulic fracturing, gas processing, and chemical processing. The company was founded in April 1992 and is headquartered in San Leandro, CA.
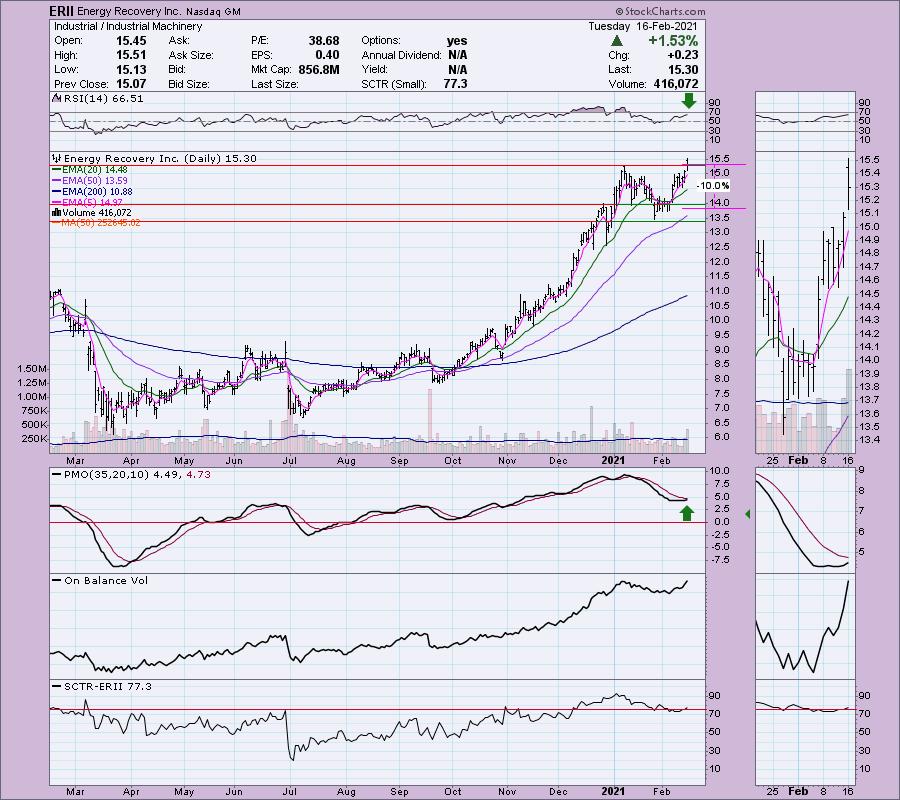
ERII is unchanged in after hours trading. Here is another impressive breakout. Price did settle right on prior overhead resistance. It did start the day on that intraday high, so we got a breakout and then a pullback to the breakout point. It should be setting up for a continuation. The PMO is rising and hasn't quite given us the BUY signal. The RSI is positive and rising. The OBV is going to set a new high right along with price. The SCTR is in the "hot zone" above 75.
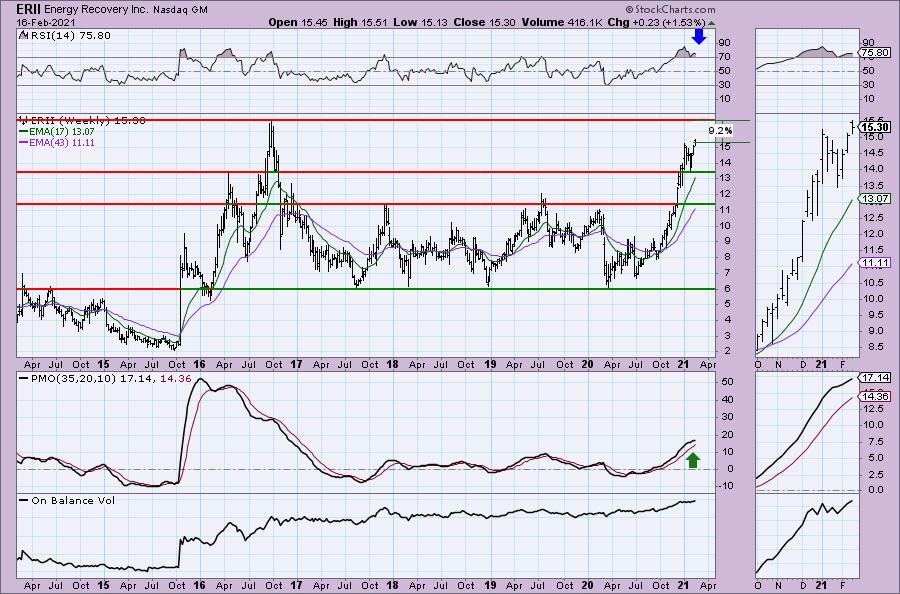
Interestingly price bounced right on support at the early 2016 top. It is preparing to test resistance at the 2016 high. The PMO is rising and is not overbought. The RSI is overbought, but I still believe we will at least challenge that prior top for a 9%+ gain.
Don't forget, on Thursdays I look at reader-requested symbols, so shoot me an email at erin@decisionpoint.com. I read every email I receive and try to answer them all!
SEI Investments Co. (SEIC)
EARNINGS: 4/22/2021 (AMC)
SEI Investments Co. engages in the provision of investment processing, investment management and investment operations platforms. It operates through the following business segments: Private Banks, Investment Advisors, Institutional Investors, Investment Managers and Investments in New Businesses. The Private Banks segment provides outsourced investment processing and investment management platforms to banks and trust institutions, independent wealth advisers and financial advisors worldwide. The Investment Advisors segment provides investment management and investment processing platforms to affluent investors through a network of independent registered investment advisors, financial planners and other investment professionals. The Institutional Investors segment provides investment management and administrative outsourcing platforms to retirement plan sponsors, healthcare systems and not-for-profit organizations worldwide. The Investment Managers segment provides investment operations outsourcing platforms to fund companies, banking institutions and both traditional and non-traditional investment managers worldwide. The Investments in New Businesses segment focuses on the provision of investment management programs to ultra-high-net-worth families residing in the United States, developing internet-based investment services and advice platforms, entering new markets and conducting other research and development activities. The company was founded by Alfred P. West, Jr. in 1968 and is headquartered in Oaks, PA.
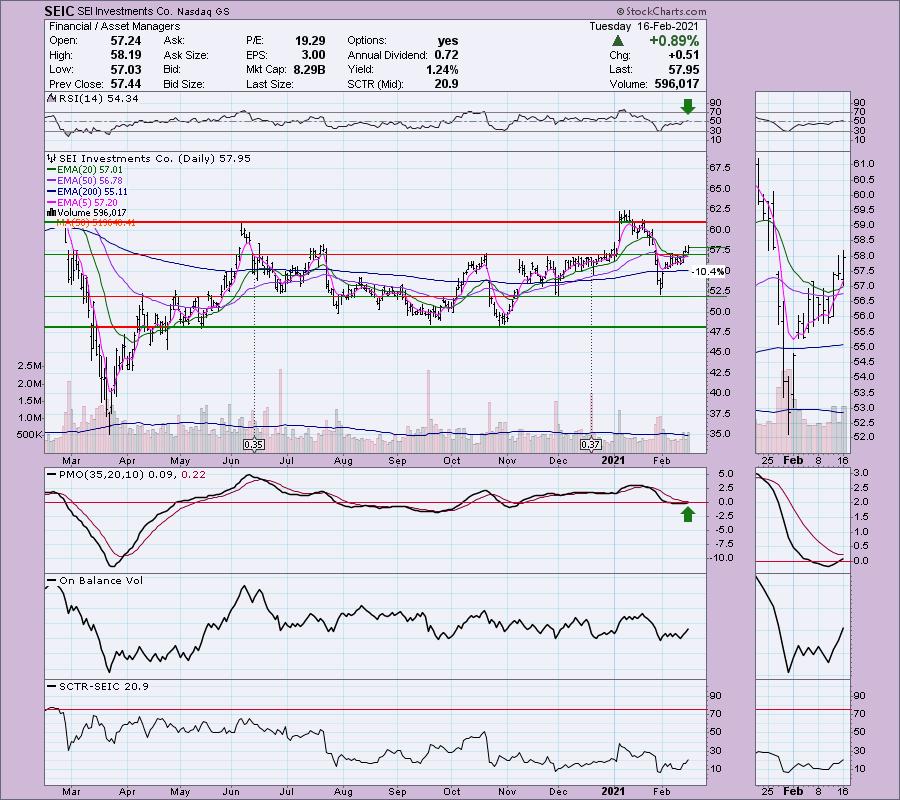
SEIC is unchanged in after hours trading. It's not a particularly sexy stock as it has been in a trading range for some time. However, it is set up nicely right now and could breakout from the range this time around. The PMO is back in positive territory and is preparing for a crossover BUY signal. The RSI has just entered positive territory. I've set to the stop rather deep, mainly so you can see how far away support is. I generally don't hold onto anything that dips below its 200-EMA.
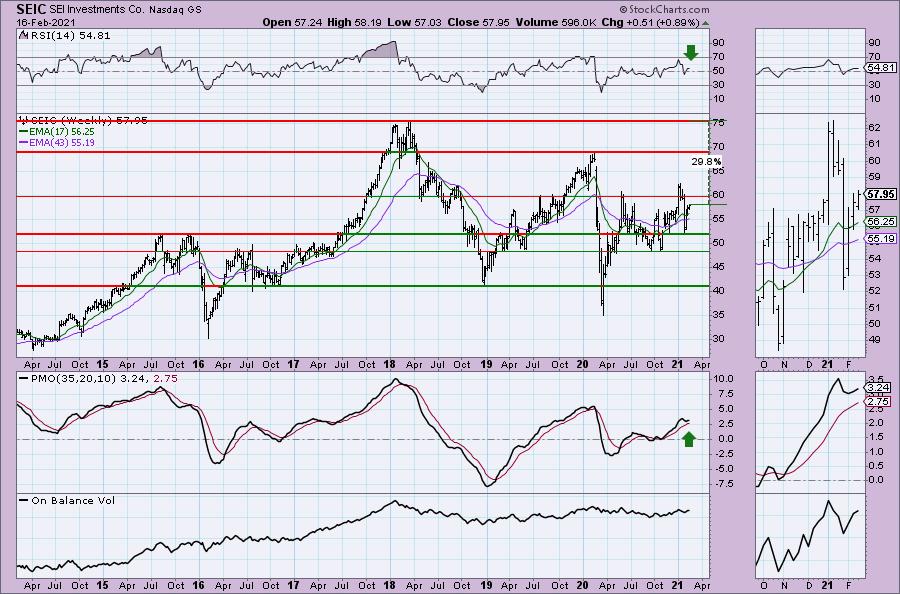
I do believe we will at least test the 2020 high which is a nice gain, but there is certainly no reason why it couldn't challenge its all-time high from 2018. The weekly PMO has bottomed above the signal line which is especially bullish and the RSI is in positive territory.
SPDR S&P Metals and Mining ETF (XME)
EARNINGS: N/A
XME tracks an equal-weighted index of U.S. metals and mining companies. It holds firms classified as operating in the Metals and Mining sector by GICS, including coal firms.
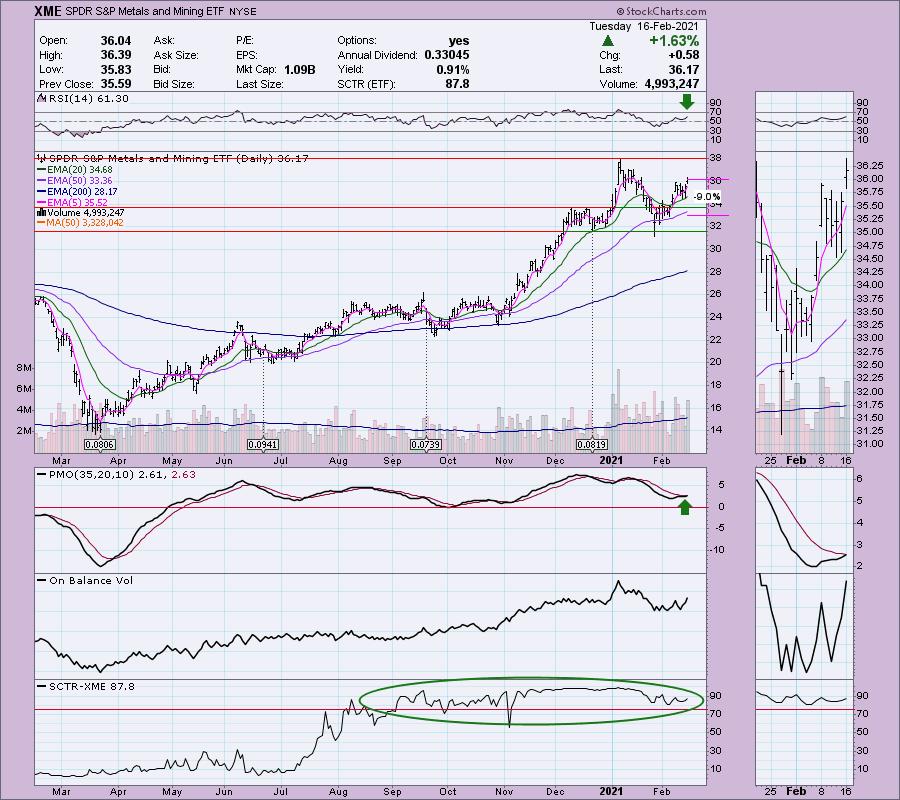
XME is up +0.14% in after hours trading. As noted in the intro, I'm not hot on Gold Miners, so an ETF that covers more than just Gold Miners makes sense to me. This one was planted in my lap on the PMO Crossover Scan. The PMO just triggered that BUY signal. The RSI is positive. The OBV is not great, but not negative either. I like the little flag in the thumbnail with today's breakout confirming and executing the pattern. The SCTR for this ETF is healthy. Remember, the SCTR "universe" for XME are ETFs, not stocks. The stop level is below the 50-EMA.
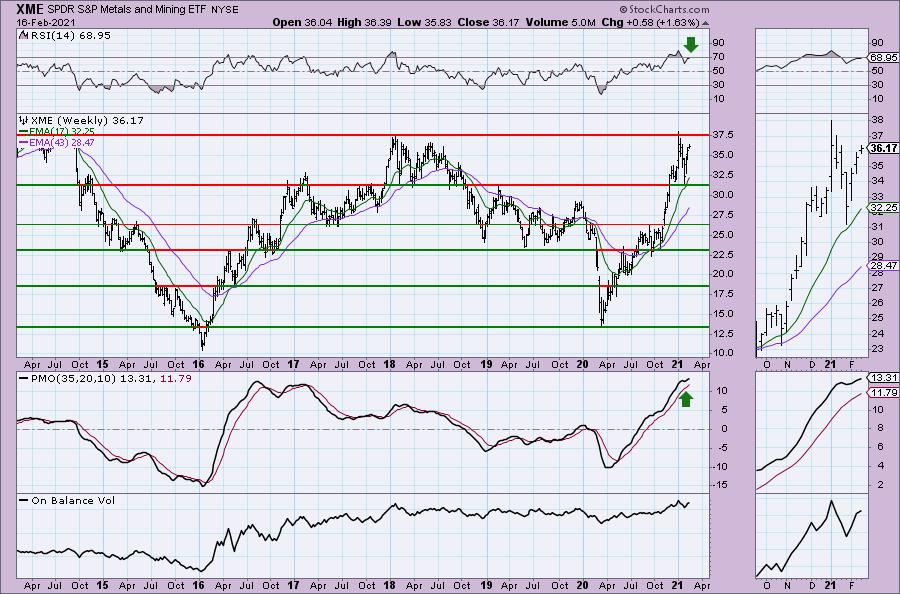
The weekly PMO is admittedly overbought, but we do have a bottom above the signal line which is especially bullish. The RSI is not overbought at this point. I would look for a breakout from the 2018 high.
Full Disclosure: I'm about 85% invested and 15% is in 'cash', meaning in money markets and readily available to trade with. I didn't add any Diamonds and my stops are intact. I'm considering a position in XME and CSX.
Current Market Outlook:
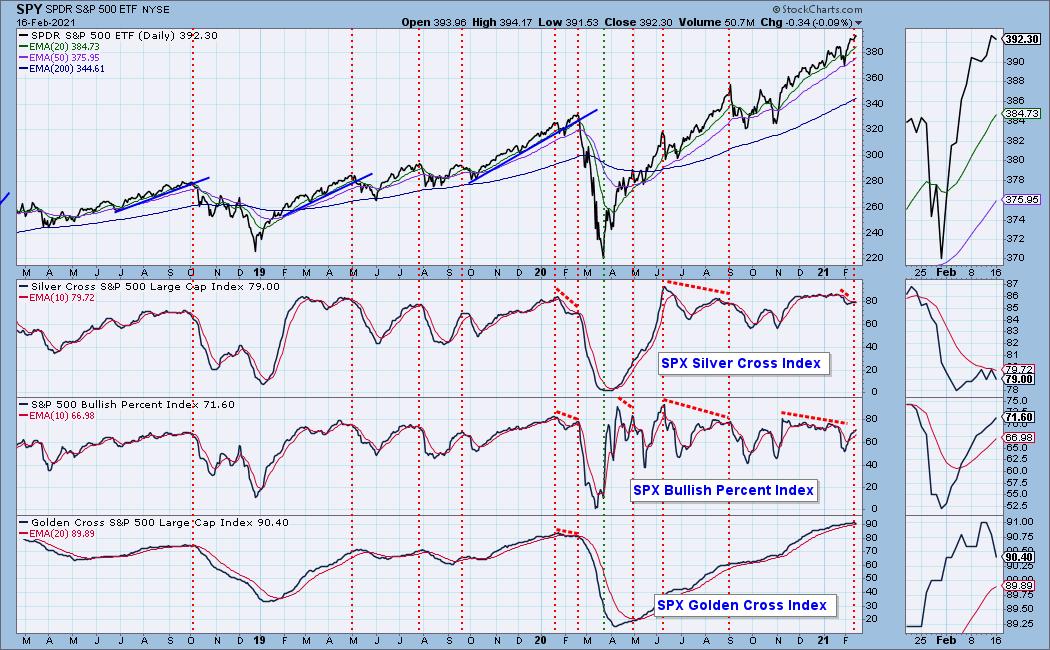
Market Environment: It is important to consider the odds for success by assessing the market tides. The following chart uses different methodologies for objectively showing the depth and trend of participation for intermediate- and long-term time frames.
- The Silver Cross Index (SCI) shows the percentage of SPX stocks on IT Trend Model BUY signals (20-EMA > 50-EMA)
- The Golden Cross Index (GCI) shows the percentage of SPX stocks on LT Trend Model BUY signals (50-EMA > 200-EMA)
- The Bullish Percent Index (BPI) shows the percentage of SPX stocks on Point & Figure BUY signals.
Don't forget that as a "Diamonds" member, you have access to our GCI/SCI curated ChartList on DecisionPoint.com. You'll find it under "Members Only" links on the left side on the Blogs and Links Page.
Here is the current chart:
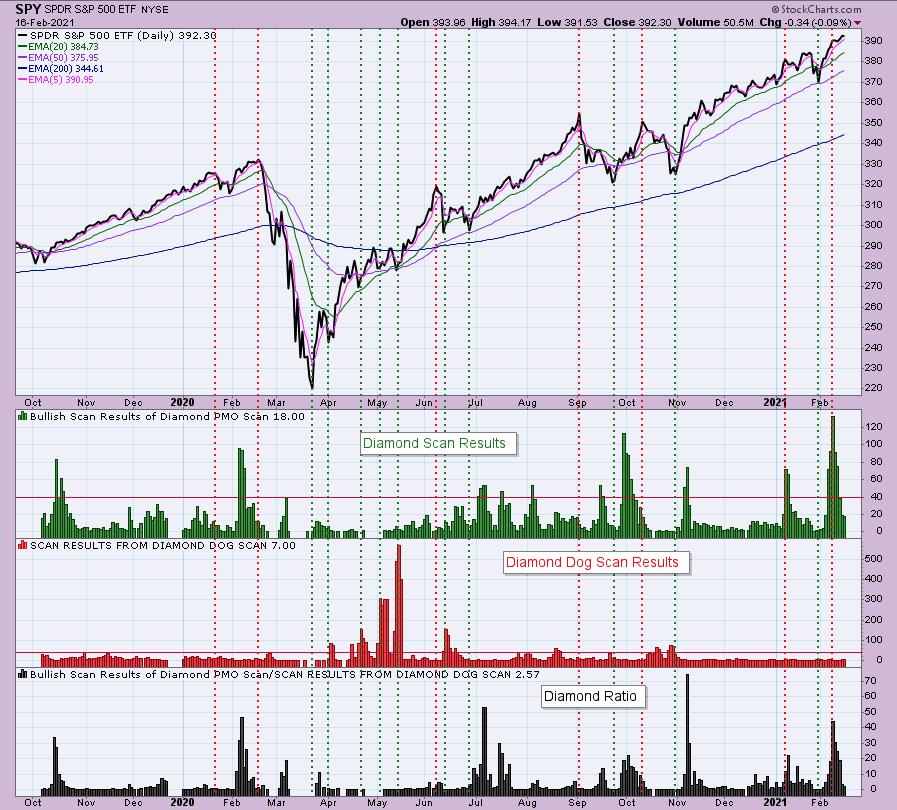
Diamond Index:
Technical Analysis is a windsock, not a crystal ball.
Happy Charting!
- Erin
erin@decisionpoint.com
Watch the latest episode of DecisionPoint with Carl & Erin Swenlin on Mondays 7:00p EST or on the DecisionPoint playlist on the StockCharts TV YouTube channel here!
NOTE: The stocks reported herein are from mechanical trading model scans that are based upon moving average relationships, momentum and volume. DecisionPoint analysis is then applied to get five selections from the scans. The selections given should prompt readers to do a chart review using their own analysis process. This letter is not a call for a specific action to buy, sell or short any of the stocks provided. There are NO sure things or guaranteed returns on the daily selection of "diamonds in the rough."
Helpful DecisionPoint Links:
DecisionPoint Shared ChartList and DecisionPoint Chart Gallery
Price Momentum Oscillator (PMO)
Swenlin Trading Oscillators (STO-B and STO-V)
For more links, go to DecisionPoint.com!f
