
For those of you who have attended the DP Trading Rooms and Diamond Mines as well as viewers of the DecisionPoint Show, you are well aware of my recent "Diamond of the Week" pick of Netflix (NFLX). I hadn't officially added it to our spreadsheet, but I am today. I've updated the chart and modified the analysis somewhat. Today, I found some excellent On-Balance Volume (OBV) positive divergences. We don't usually get to see these until they've already begun the rally, so I was excited to see some early positive divergences that could line us up for the next rally off lows.
As a quick review, the OBV measures volume on a continuous basis. On positive days all of the volume of the day is added to the OBV. On negative days all of the volume of the day is subtracted from the OBV running total. A positive divergence is when we have rising bottoms on the OBV, but declining bottoms on price. These typically precede lengthy rallies.
Today's "Diamonds in the Rough" are: BE, CRI, DELL, NTCT and WMB + Bonus NFLX.
 Diamond Mine Information:
Here is Friday's (11/6/2020) recording link. Access Passcode: #g8G^J&3
Register in advance for the next "DecisionPoint Diamond Mine" trading room on Friday (11/13/2020) 12:00p ET:
Here is the registration link for Friday, 11/13/2020. Password: warmer
Please do not share these links! They are for Diamonds subscribers ONLY!

It's Free!
***Click here to register for this recurring free DecisionPoint Trading Room on Mondays at Noon ET!***
Did you miss the 11/9 free trading room? Here is a link to the recording. Access Code: UxEj0^3e. For best results, copy and paste the access code to avoid typos.
Welcome to DecisionPoint Daily Diamonds, wherein I highlight five "diamonds in the rough." These are selected from the results of my DecisionPoint scans, which search for stocks that could benefit from the trend and condition of the market. Remember, these are not recommendations to buy or sell, but are the most interesting of the stocks that surfaced in my scans. My objective is to save you the work of the initial, tedious culling process, but you need to apply your own analysis to see if these stocks pique your interest as well. There are no guaranteed winners here!
Bloom Energy Corp. (BE)
EARNINGS: 2/3/2021 (AMC)
Bloom Energy Corp. engages in the manufacture and installation of on-site distributed power generators. Its product, Bloom Energy Server, converts standard low-pressure natural gas or biogas into electricity through an electrochemical process without combustion. The company was founded by K. R. Sridhar, John Finn, Jim McElroy, Matthias Gottmann, and Dien Nguyen on January 18, 2001 and is headquartered in San Jose, CA.
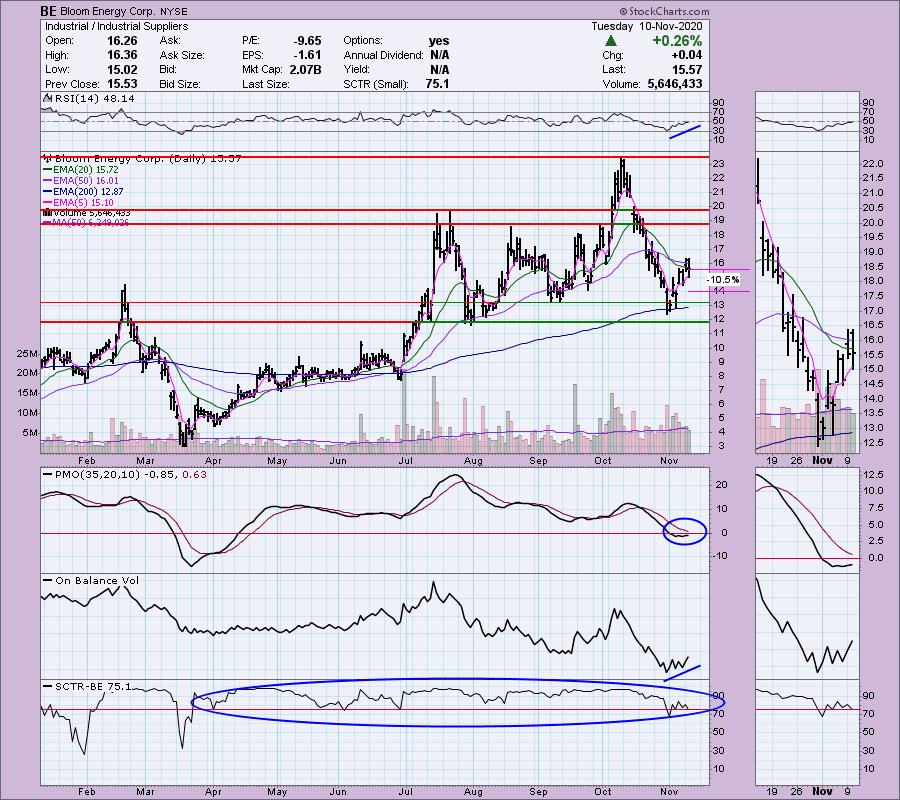
Up +1.48% in after hours trading, BE has a nice "V" bottom pattern. These will "execute" when the right side of the "V" moves 1/3 of the way up toward the top of the left side of the "V". We are slightly early on this one, but it won't be long should it continue to rally higher. The RSI has just about turned positive and the PMO is trying to curve upward as it is flat right now. The OBV is confirming the current rally with rising bottoms. The stop is a little tricky here. In order to prevent a deep stop, I decided to go with the $14 level that matches the second bottom in September.
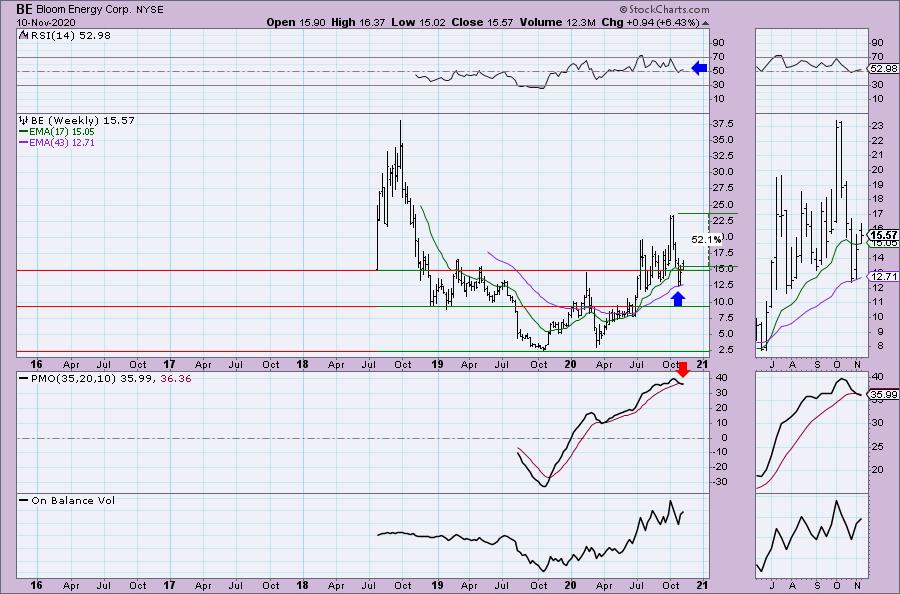
This isn't the best set up for a longer-term investment. The weekly PMO just triggered a sell signal. However, we can see that price found support along the 43-week EMA.
Carter Holdings Inc. (CRI)
EARNINGS: 2/24/2021 (BMO)
Carter's, Inc. engages in the marketing of apparel for babies and young children. It operates through the following segments: U.S. Retail; U.S. Wholesale; and International. The U.S. retail segment consists of sales of products in retail and online stores. The U.S. Wholesale segment includes sales in the United States of products to wholesale partners. The International segment comprises sales of products outside the United States, largely through retail stores in Canada and Mexico, eCommerce sites in Canada and China, and sales to international wholesale accounts and licensees. The company was founded by William Carter in 1865 and is headquartered in Atlanta, GA.
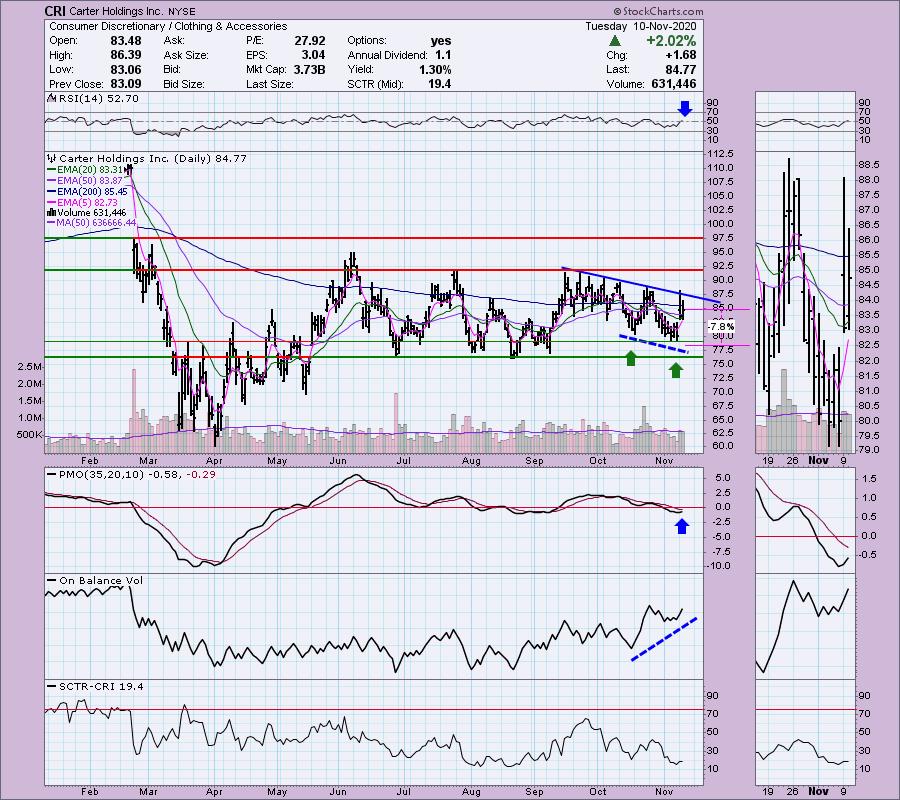
This is the first OBV positive divergence chart today. Notice the steeply rising OBV bottoms that are matched with declining price bottoms. We've seen two days of rally off that positive divergence, but typically we see more. The declining tops trendline hasn't been broken yet, but we now have a positive RSI and rising PMO. Additionally I think you could make a case for a double-bottom chart pattern forming. I'd prefer a better SCTR, but given the 50-EMA is below the 200-EMA, it isn't surprising. The stop is set just below the double-bottom formation.
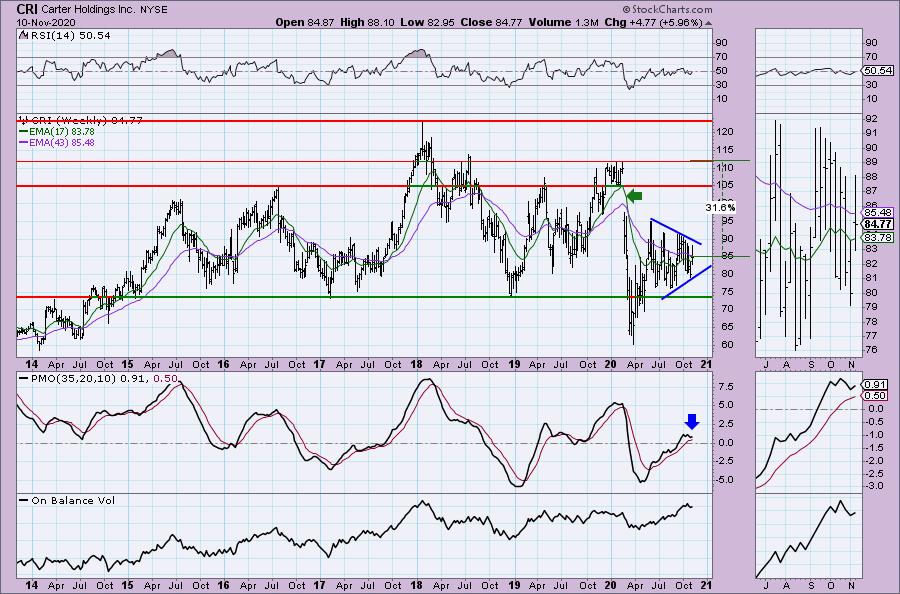
The weekly chart is mostly neutral. The RSI is in middle ground and the PMO has flattened, although it is bottoming again this week. We have a symmetrical triangle off the bear market low. These are usually continuation patterns, so I would look for an upside breakout. If price could get back to its 2020 high, that would be a sizable 31%+ gain.
Don't forget, on Thursdays I look at reader-requested symbols, so shoot me an email at erin@decisionpoint.com. I read every email I receive and try to answer them all!
Dell Technologies, Inc. (DELL)
EARNINGS: 11/24/2020 (AMC)
Dell Technologies, Inc. is a holding company, which engages in the provision of information technology hardware, software, and service solutions through its subsidiaries. It operates through the following segments: Infrastructure Solutions Group (ISG), Client Solutions Group (CSG), and VMware. The ISG segment includes servers, networking, and storage, as well as services and third-party software and peripherals that are closely tied to the sale of ISG hardware. The CSG segment consists of sales to commercial and consumer customers of desktops, thin client products, and notebooks. The VMware segment provides compute, cloud management, networking and security, storage and availability, and other end-user computing offerings. The company was founded by Michael Saul Dell in 1984 and is headquartered in Round Rock, TX.
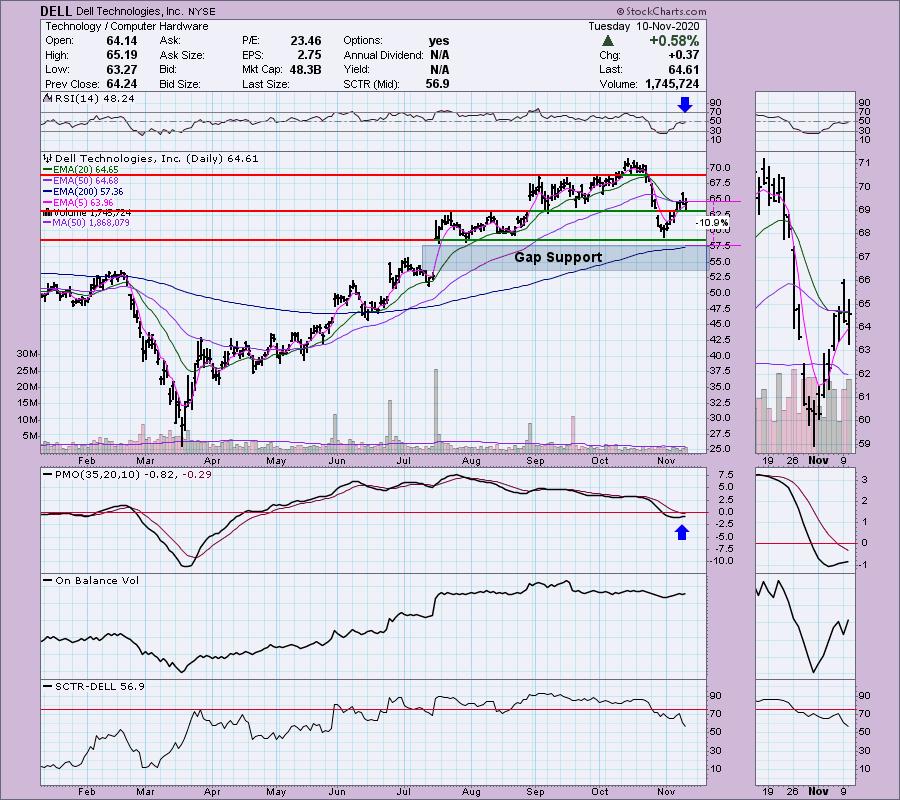
"Dude, you're getting a Dell!" I am always reminded of Dell's version of "Flo the insurance lady", a young college age boy talking to other students about computers (can't remember if he had a name). I'm leery of Technology stocks right now but I don't want to miss the boat if we see them begin to rally like Dell. This is another "V" bottom and in this case it has executed. Price is holding support at the July/August tops and there is gap support below that. Still, I set the stop above gap support to prevent it from being more than 11%. The SCTR doesn't thrill me, but the RSI is nearing positive territory and the PMO is curling up for a BUY signal.
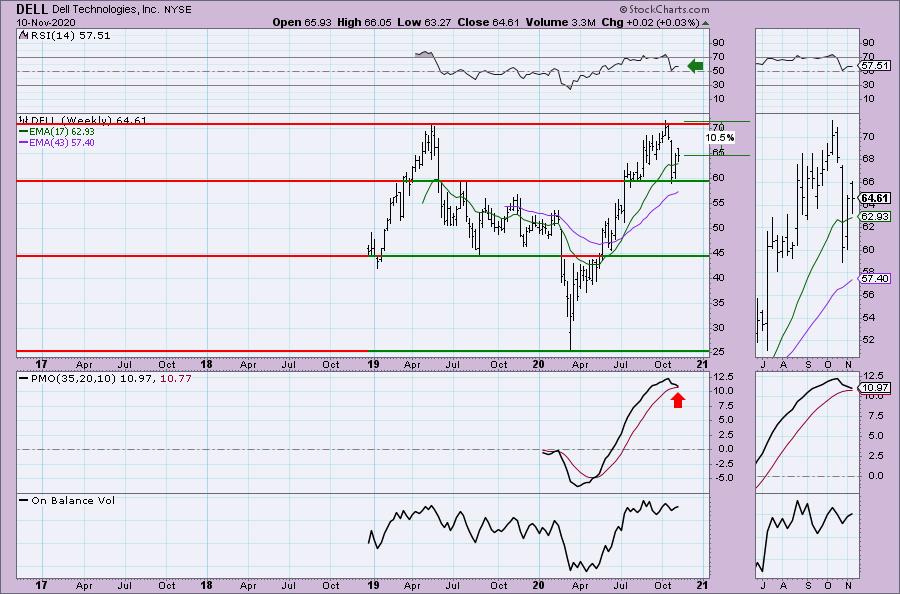
Another mixed weekly chart. Today my picks were from my "Momentum Sleepers" scan so you'll notice that not all of the weekly charts are completely bullish. In this case, support is holding and the RSI is positive. However, that PMO is pretty ugly (oxymoron, right?).
NetScout Systems, Inc. (NTCT)
EARNINGS: 1/28/2021 (BMO)
NetScout Systems, Inc. engages in the provision of application and network performance management solutions. Its integrated hardware and software solutions are used by commercial enterprises, governmental agencies and telecommunication service providers. The company was founded by Anil K. Singhal and Narendra Popat in June 1984 and is headquartered in Westford, MA.
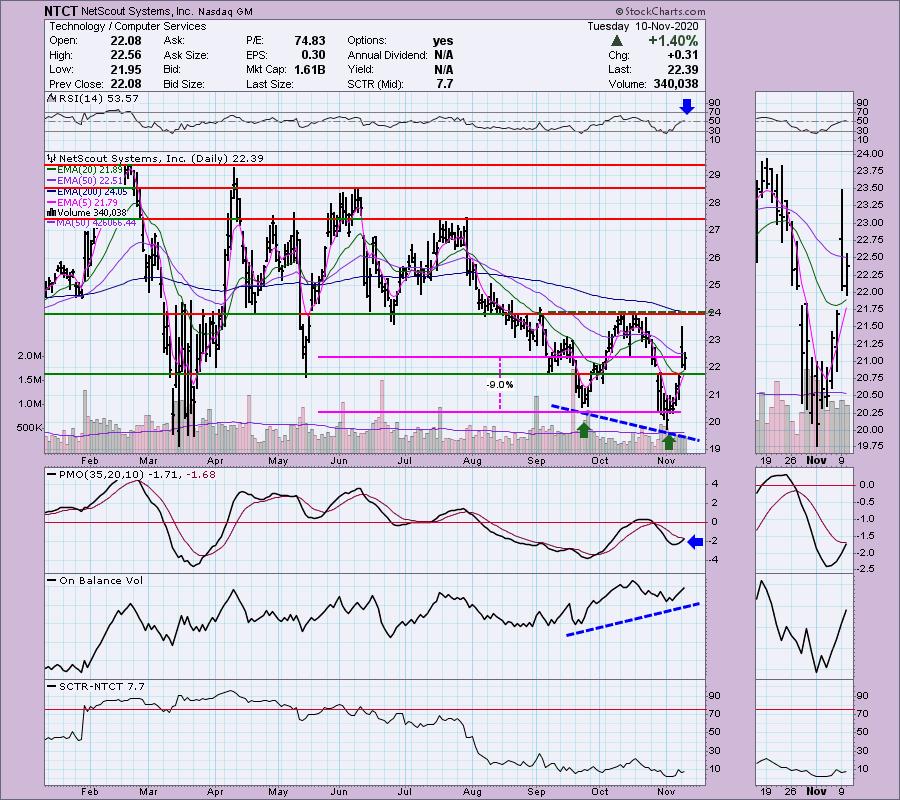
Here's another very strong positive divergence with the OBV. The rally on this one has been in place since the beginning of November, but now we have a positive RSI and a PMO that is about ready to generate a crossover SELL signal. The double-bottom is huge. If it triggers on a move above the confirmation line at $24, the minimum upside target would be around $28.50 which lines up perfectly with overhead resistance at the June top. The stop is set just below the first bottom.
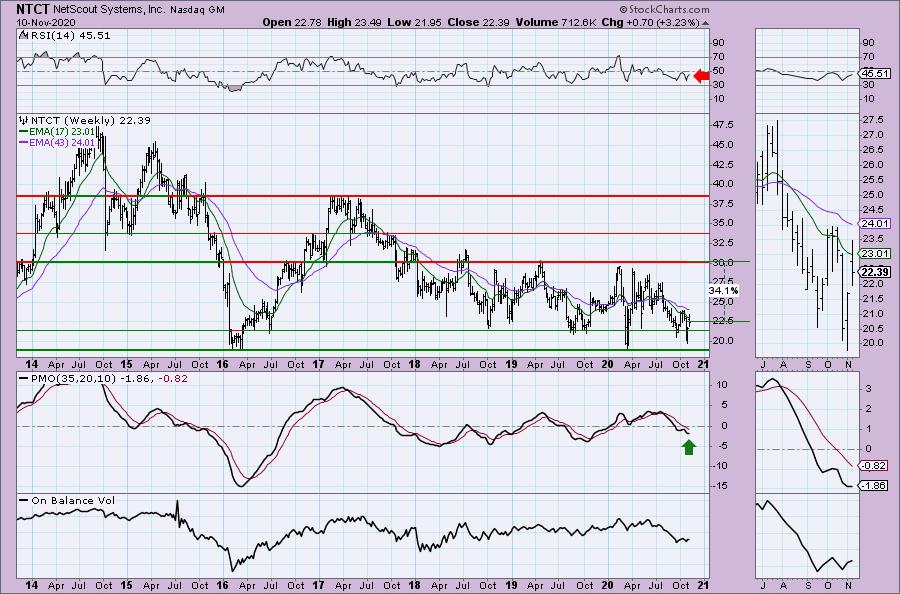
The weekly PMO is flattening and could turn up in near-term oversold territory. The RSI is currently negative which tells me to be careful in the intermediate term. It's a pretty straight forward trading range and should price get to the 2019/2020 tops, that would be a tidy 34% gain.
Williams Cos., Inc. (WMB)
EARNINGS: 2/17/2021 (AMC)
The Williams Cos., Inc. operates as an energy infrastructure company, which explores, produces, transports, sells and processes natural gas and petroleum products. It operates through three segments: Williams Partners; and Others. The Williams Partners segment includes gas pipeline and domestic midstream businesses. The gas pipeline business includes interstate natural gas pipelines and pipeline joint venture investments, and the midstream business provides natural gas gathering, treating and processing services; NGL production, fractionation, storage, marketing and transportation and deepwater production handling and crude oil transportation services. The Other segment comprises of corporate operations; olefins pipeline assets; and Canada assets. The company was founded by David Williams and Miller Williams in 1908 and is headquartered in Tulsa, OK.
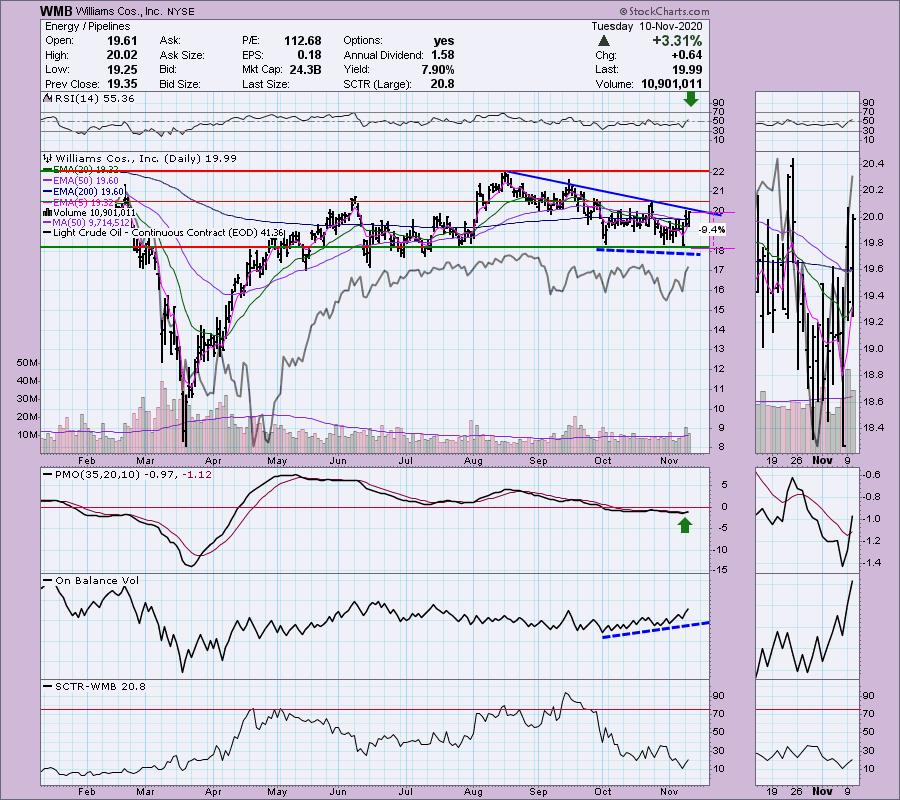
WMB is currently up +0.25% in after hours trading. Energy has ruled the last two trading days and everyone is looking for the next big breakout. I opted to pick a company that has been mimicking the $WTIC (West Texas Crude is the solid gray line) price movement. If Oil is really going to break out, this could be a great vehicle. The yield is outstanding and the price action is looking favorable. The RSI has just hit positive territory again and the PMO generated a new crossover BUY signal today. We have a nice positive divergence with the OBV and in this case, we haven't really seen the breakout rally that OBV positive divergences lead to. The stop is doable at just over 9% which would require price to break down just below the trading range.
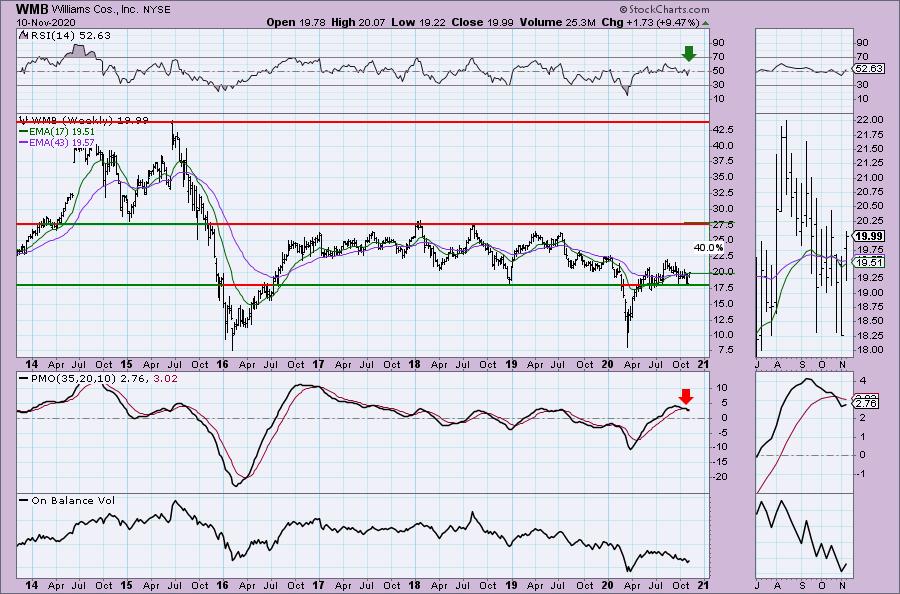
The weekly RSI is mostly neutral. The weekly PMO is on a SELL signal, but we can see it has turned up on this week's 9.47% rally. I could be getting on this right in time for a pullback, but we can see that the $18 support level is strong. If price can get back to the top of the trading range, that would be a 40% gain. That will likely be tied to what Oil does which does add an element of risk.
Netflix, Inc (NFLX)
EARNINGS: 1/19/2021 (AMC)
Netflix, Inc. is a streaming entertainment service company, which provides subscription service streaming movies and television episodes over the Internet and sending DVDs by mail. It operates through the following segments: Domestic Streaming, International Streaming and Domestic DVD. The Domestic Streaming segment derives revenues from monthly membership fees for services consisting solely of streaming content to its members in the United States. The International Streaming segment includes fees from members outside the United States. The Domestic DVD segment covers revenues from services consisting solely of DVD-by-mail. The company was founded by Marc Randolph and Wilmot Reed Hastings Jr., on August 29, 1997 and is headquartered in Los Gatos, CA.
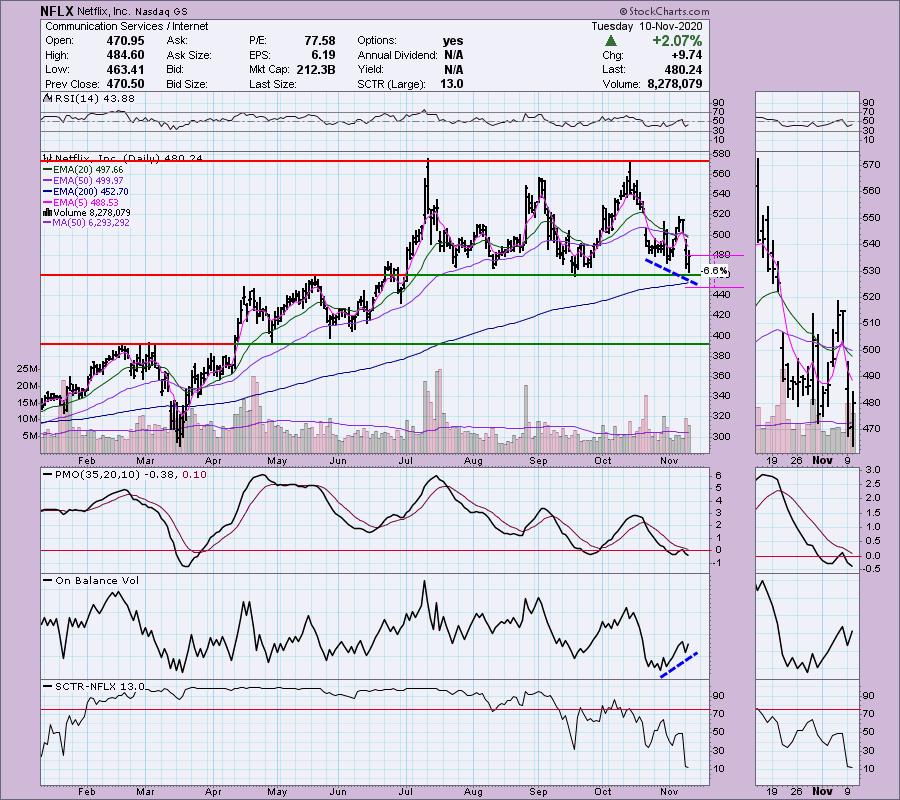
I wrote about Netflix in the Friday Diamonds Recap and then presented it on Monday for the "Your Daily Five" show on StockChartsTV as well as on the "DecisionPoint Show". I wanted to make sure it was added to this week's spreadsheet. I wasn't able to get in it today simply due to conflicts in my schedule, but I'll be adding this one very soon. This is certainly not a typical "diamond in the rough", but it was one on Friday and I still like it. Price is bouncing off very important and strong support at the bottom of a wide trading range. The RSI is still negative but is trying to rise right now. And yes, there is an especially bearish PMO top below the signal line. However, right now it is setting up a beautiful positive OBV divergence. We technically have not put in a true bottom yet, but I believe it will. The nice thing, you can set a tight stop and avoid big time risk.
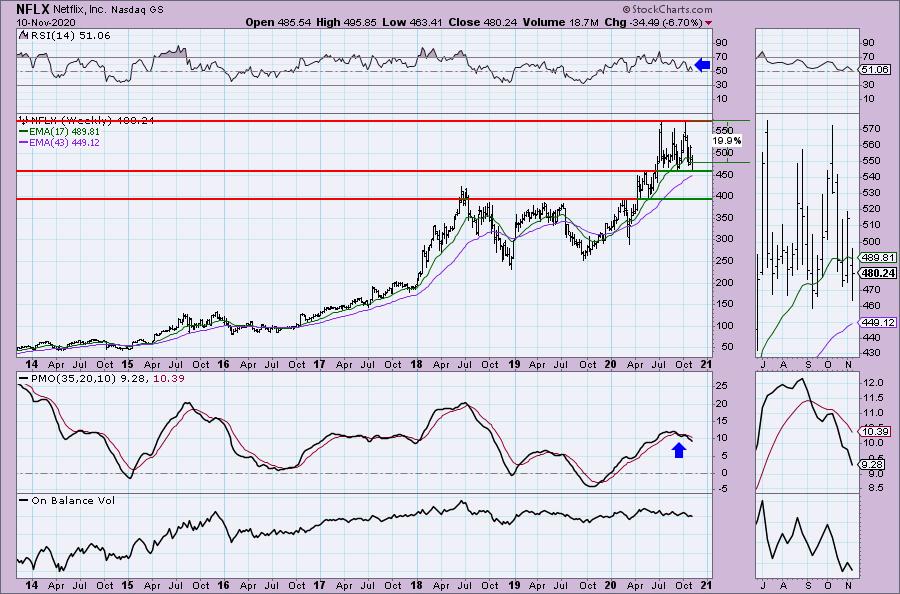
I'd be happy with a test of all-time highs at a near 20% gain. The weekly PMO isn't good, which tells me to be happy with a move to new all-time highs. I'll recheck the weekly chart when we see price hit that resistance level.
Full Disclosure: I plan on adding NFLX tomorrow. I'm about 40% invested and 60% is in 'cash', meaning in money markets and readily available to trade with.
Current Market Outlook:
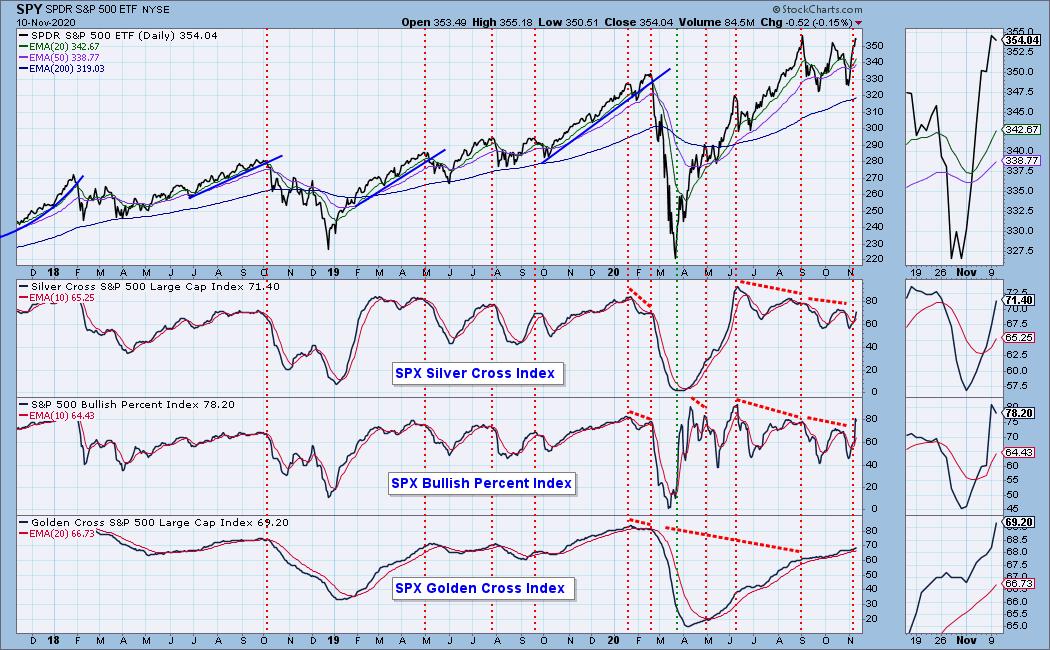
Market Environment: It is important to consider the odds for success by assessing the market tides. The following chart uses different methodologies for objectively showing the depth and trend of participation for intermediate- and long-term time frames.
- The Silver Cross Index (SCI) shows the percentage of SPX stocks on IT Trend Model BUY signals (20-EMA > 50-EMA)
- The Golden Cross Index (GCI) shows the percentage of SPX stocks on LT Trend Model BUY signals (50-EMA > 200-EMA)
- The Bullish Percent Index (BPI) shows the percentage of SPX stocks on Point & Figure BUY signals.
Don't forget that as a "Diamonds" member, you have access to our GCI/SCI curated ChartList on DecisionPoint.com. You'll find it under "Members Only" links on the left side on the Blogs and Links Page.
Here is the current chart:
Diamond Index:
- Diamond Scan Results: 3
- Diamond Dog Scan Results: 1
- Diamond Bull/Bear Ratio: 3.00
I'm in the process of trying to plot the Diamond Index, but with time at a premium, it is on the back burner.
Technical Analysis is a windsock, not a crystal ball.
Happy Charting!
- Erin
erin@decisionpoint.com
Watch the latest episode of DecisionPoint with Carl & Erin Swenlin on Mondays 7:00p EST or on the DecisionPoint playlist on the StockCharts TV YouTube channel here!
NOTE: The stocks reported herein are from mechanical trading model scans that are based upon moving average relationships, momentum and volume. DecisionPoint analysis is then applied to get five selections from the scans. The selections given should prompt readers to do a chart review using their own analysis process. This letter is not a call for a specific action to buy, sell or short any of the stocks provided. There are NO sure things or guaranteed returns on the daily selection of "diamonds in the rough."
Helpful DecisionPoint Links:
DecisionPoint Shared ChartList and DecisionPoint Chart Gallery
Price Momentum Oscillator (PMO)
Swenlin Trading Oscillators (STO-B and STO-V)
For more links, go to DecisionPoint.com!