
I don't normally throw headlines like this around, however today I uncovered a stock in the Diamond PMO Scan results that is definitely a "must-see". I won't call it a "must-buy" as that should be evaluated by you and in all honesty the market is spooked right now, so I would be very cautious about opening new positions. I found a few other diamonds in the rough that are worth a review, but you need to check out the Lumber Liquidators (LL) chart.
Today's "Diamonds in the Rough": AGCO, LL, ROL, TT, and YETI.
 Diamond Mine Information:
Recording from 10/2/2020 is at this link. Access Passcode: kvm=m6zU
Register in advance for the next "DecisionPoint Diamond Mine" trading room on Friday (10/9/2020) 12:00p ET:
Here is the registration link for Friday, 10/9/2020. Password: diamonds
Please do not share these links! They are for Diamonds subscribers ONLY!

IT'S FREE!
***Click here to register for this recurring free DecisionPoint Trading Room!***
Did you miss the 10/5 trading room? Here is a link to the recording (password: J942MF*c). For best results, copy and paste the password to avoid typos.
Welcome to DecisionPoint Daily Diamonds, wherein I highlight five "diamonds in the rough." These are selected from the results of my DecisionPoint scans, which search for stocks that could benefit from the trend and condition of the market. Remember, these are not recommendations to buy or sell, but are the most interesting of the stocks that surfaced in my scans. My objective is to save you the work of the initial, tedious culling process, but you need to apply your own analysis to see if these stocks pique your interest as well. There are no guaranteed winners here!
AGCO Corp. (AGCO)
EARNINGS: 11/3/2020 (BMO)
AGCO Corp. engages in the manufacture and distribution of agricultural equipment and related replacement parts. It operates through the following geographic segments: North America; South America; Europe and Middle East; and Asia, Pacific, and Africa. The Asia/Pacific/Africa segment includes the regions of Australia and New Zealand. The firm's products include tractors, combines, self-propelled sprayers, hay tools, forage equipment, seeding and tillage equipment, implements, and grain storage and protein production systems. Its brands include Challenger, Fendt, GSI, Massey Ferguson, Valtra, and Fella. The company was founded by Robert J. Ratliff in 1990 and is headquartered in Duluth, GA.
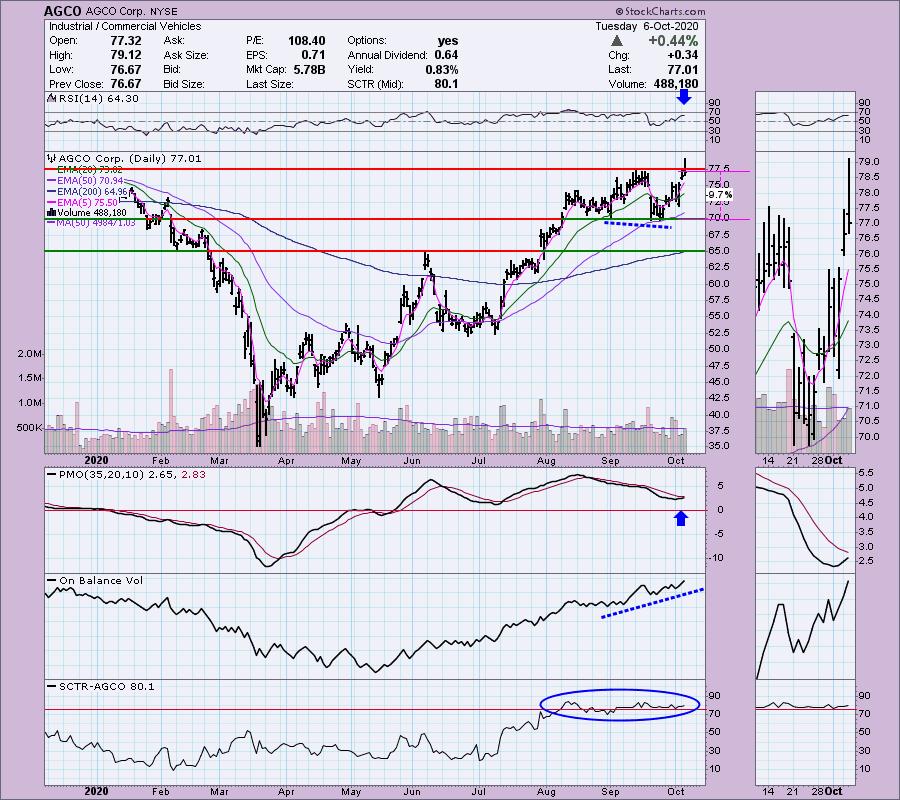
Most of today's charts have OHLC bars with long wicks (similar to shooting star candle) which tells us that price closed near the day's lows. AGCO had a nice breakout but ended up closing back below resistance. I still like this chart and this industry group. The PMO is rising and nearing a BUY signal above the zero line and the RSI is in positive territory above net neutral (50). There's a nice OBV positive divergence that led into this current rally. You can set a stop just below support at $70 and keep it less than 10%.
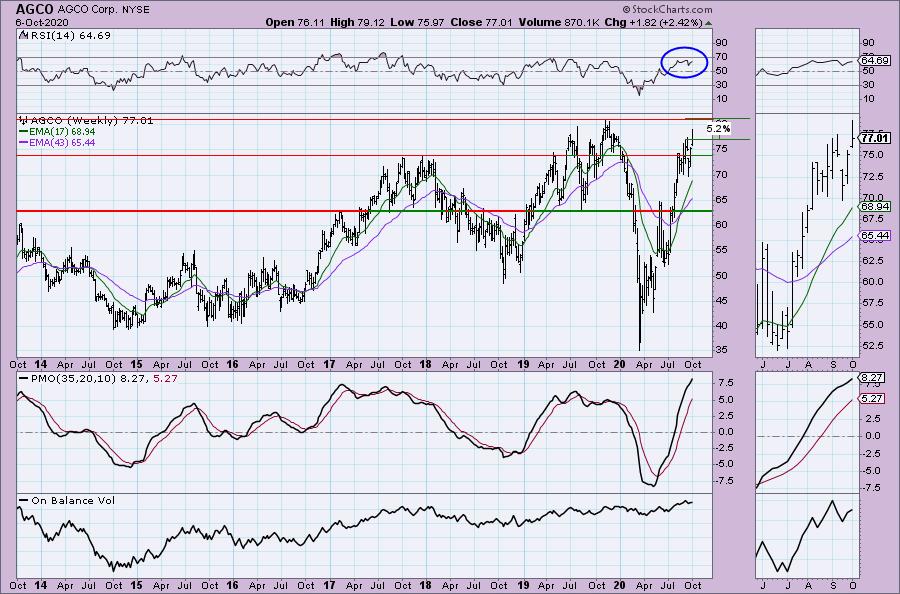
RSI is positive on the weekly chart and the PMO is rising. It's a little over 5% away from its all-time high.
Lumber Liquidators Holdings, Inc. (LL)
EARNINGS: 11/4/2020 (BMO)
Lumber Liquidators Holdings, Inc. operates as a multi channel specialty retailer of hardwood flooring and hardwood flooring enhancements and accessories in the United States. The firm offers exotic and domestic hardwood species, engineered hardwood, laminate, vinyl plank, bamboo and cork direct to the consumer. It also provides flooring enhancements and accessories, including moldings, noise reducing underlay, adhesives and flooring tools. The company was founded by Thomas David Sullivan in 1993 and is headquartered in Richmond, VA.
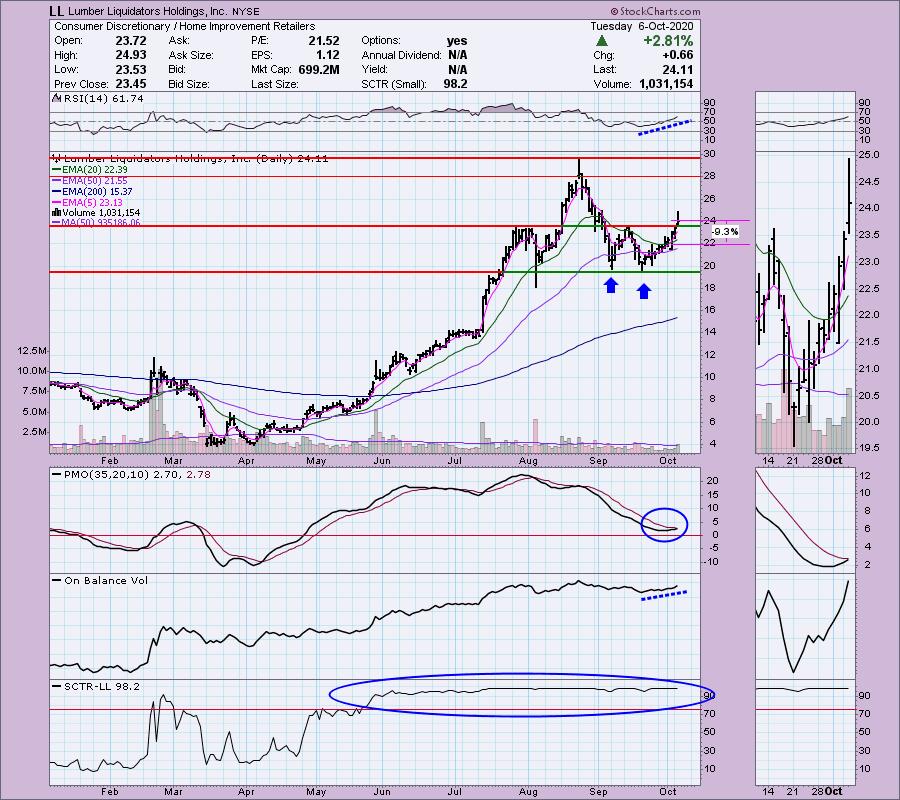
Up 0.12% in after hours trading, LL has a great looking chart. The RSI has been steadily rising and is smack in the middle of positive territory. We have a textbook double-bottom formation that just triggered as price broke above the confirmation line. The minimum upside target of this pattern is $28. I believe it'll go back to $30. The PMO has gradually turned up right above the zero line. We have confirmation by the OBV and a SCTR that is first-rate.
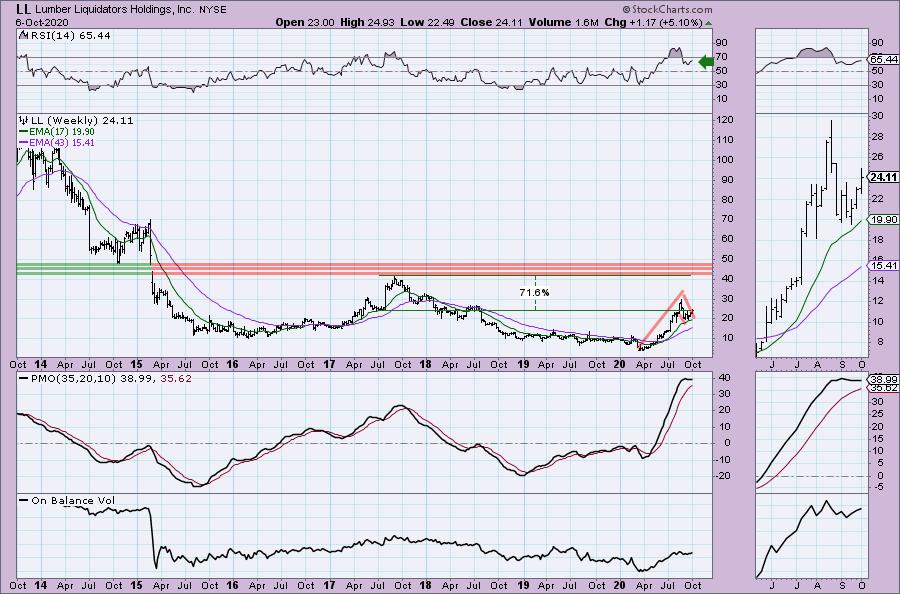
The weekly chart has a positive RSI. The late August pullback took it out of overbought territory. That pullback also formed a nice little flag. If it were to execute, that would take it past the gap. I won't go so far as to suggest that type of rally, but even half that would be very worthwhile. I think that price movement since mid-2017 could constitute a saucer with this pullback as a possible handle. In either case, the patterns are bullish. The PMO is very overbought which I don't care for, but it flattened and avoided a SELL signal on the pullback which is positive.
Don't forget, on Thursdays I look at reader-requested symbols, so shoot me an email at erin@decisionpoint.com. I read every email I receive and try to answer them all!
Rollins, Inc. (ROL)
EARNINGS: 10/28/2020 (BMO)
Rollins, Inc. engages in the provision of pest and termite control services through its wholly-owned subsidiaries to both residential and commercial customers in United States, Canada, Central America, South America, the Caribbean, the Middle East, Asia, the Mediterranean, Europe, Africa, Mexico, and Australia. The company was founded by John W. Rollins Jr. and O. Wayne Rollins Sr. in 1948 and is headquartered in Atlanta, GA.
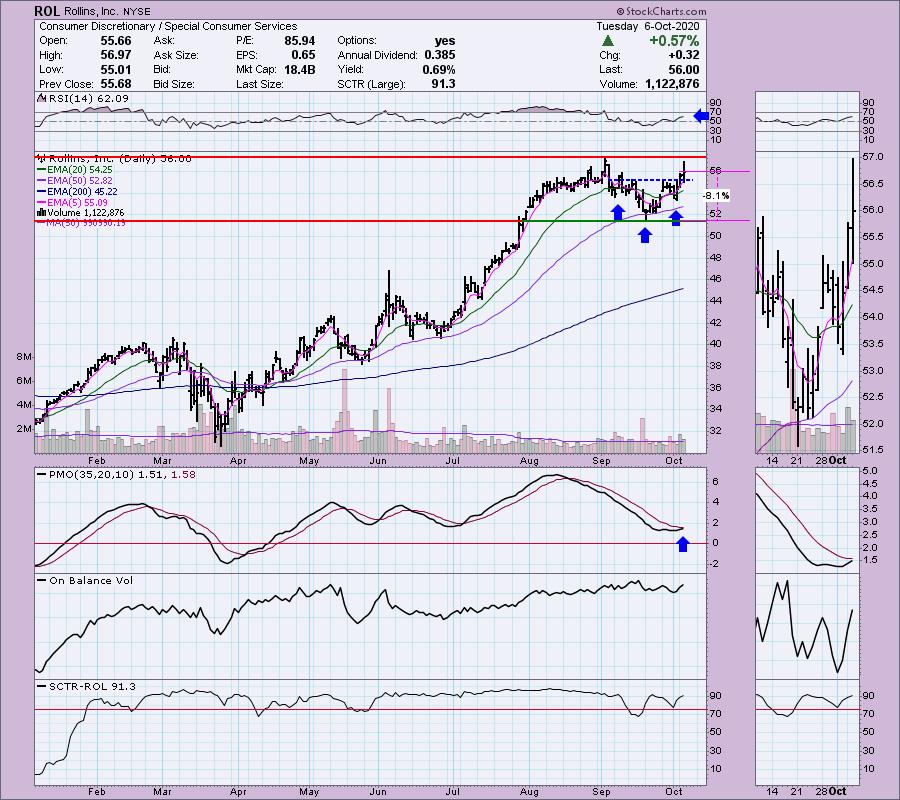
ROL was a diamond in the rough in the May 7th, 2020 Diamond Report. At that time the price was $41.44, so that is a current gain of 35%. Looking at the chart, it looks ready to make another move to the upside. We have what could be considered a reverse head and shoulders. Granted it is not coming off a longer-term decline, but you could also consider it a basing pattern that began in August. I'm looking for a breakout here. The RSI is positive and the PMO is nearing a BUY signal. The SCTR has been in the "hot zone" most of the past 9 months. Not the best looking OBV, but I don't see a negative divergence setting up on this current rally.
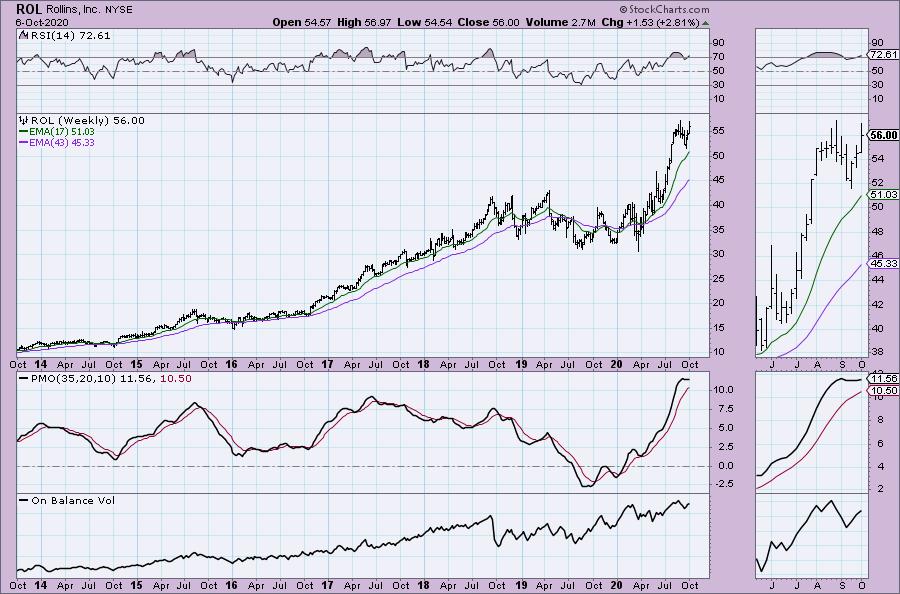
Another possible bull flag continuation pattern. The PMO has flattened and is overbought, but isn't falling anymore. Beware that the RSI is fairly overbought. The recent pullback didn't really relieve those conditions. However, I would point back to 2017 and you can see it spent most of the year very overbought.
Trane Technologies Inc (TT)
EARNINGS: 10/27/2020 (BMO)
Trane Technologies Plc engages in the provision of products, services, and solutions to enhance the quality, energy efficiency and comfort of air in homes and buildings, transport and protect food and perishables and increase industrial productivity and efficiency. It operates through Climate and Industrial segments. The Climate segment delivers energy-efficient products and innovative energy services. The Industrial segment delivers products and services that enhance energy efficiency, productivity and operations. It distributes its products under the following brand names: Ingersoll-Rand, Trane, Thermo King, American Standard, ARO, and Club Car. The company was founded in 1871 and is headquartered in Swords, Ireland.
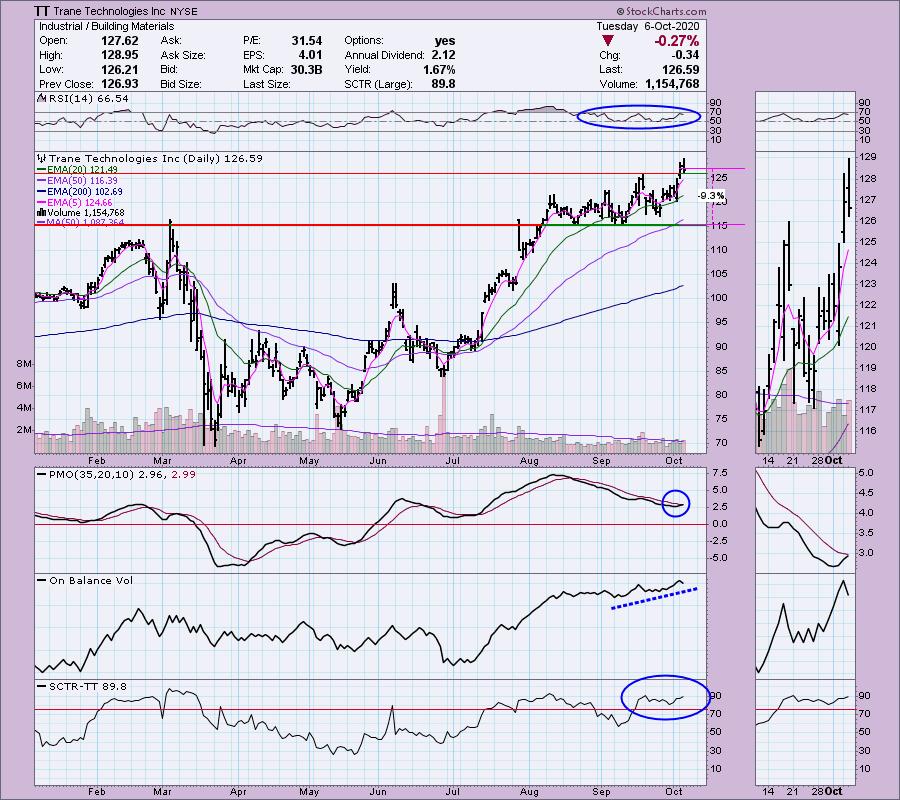
I like Trane on this breakout and today it got caught up in the end of day distress and pulled back toward the original breakout area. The PMO is ready to give us a BUY signal. The RSI has been positive since July. The OBV has been confirming the rising trend and the SCTR is back in the "hot zone".
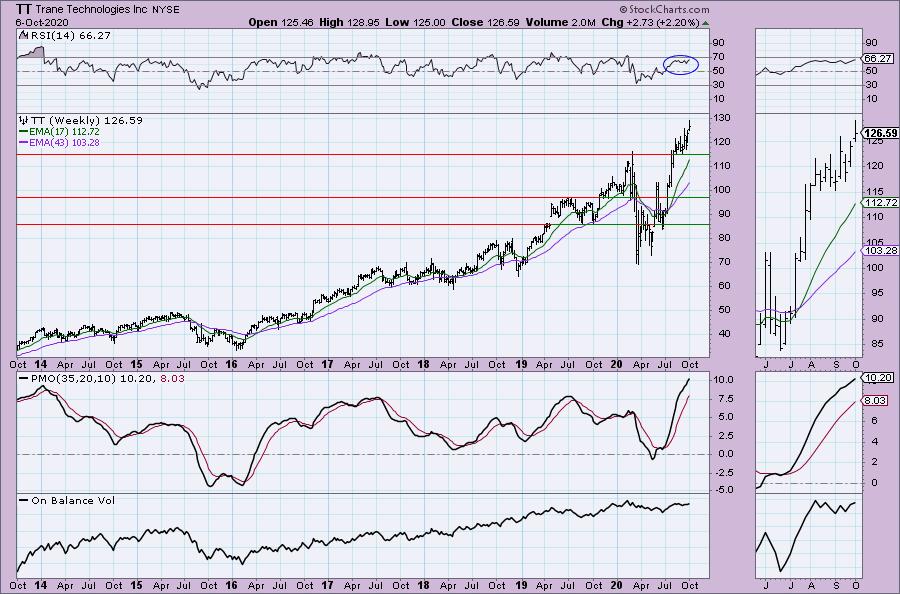
The PMO is overbought but still rising strongly. The RSI is positive and not overbought.
Yeti Holdings Inc. (YETI)
EARNINGS: 11/5/2020 (BMO)
YETI Holdings, Inc. engages in the design, marketing, and distribution of products for the outdoor and recreation market. Its products include coolers, drinkware, travel bags, backpacks, multipurpose buckets, outdoor chairs, blankets, dog bowls, apparel, and accessories. The company was founded by Roy J. Seiders and Ryan R. Seiders in 2006 and is headquartered in Austin, TX.
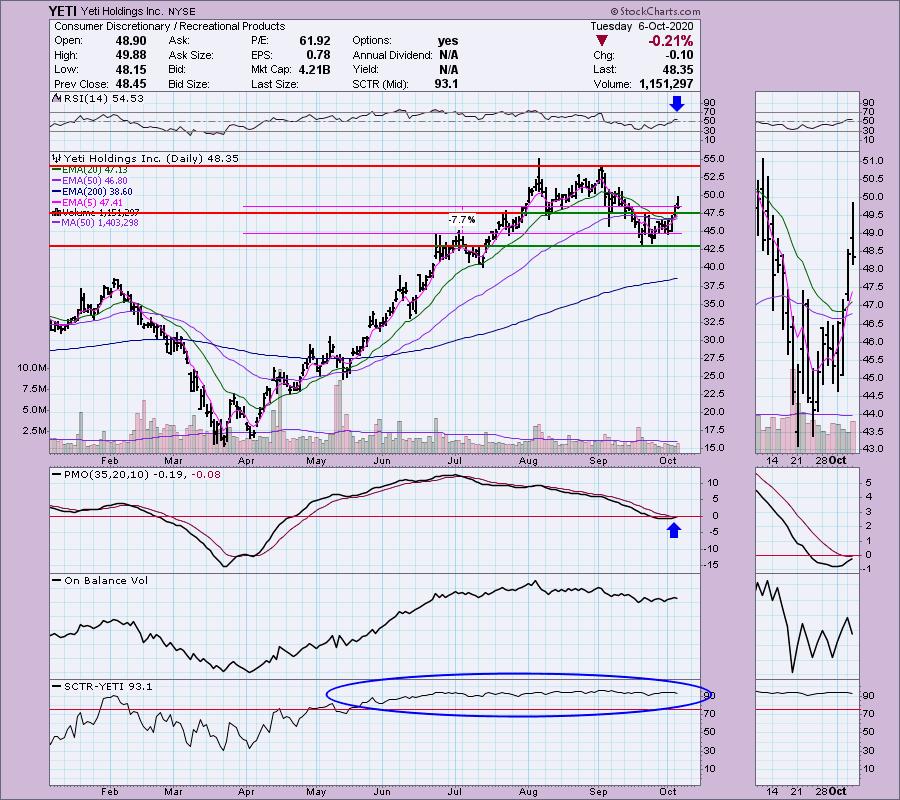
YETI was down -0.33% in after hours trading, so it could give us a better entry that is closer to the breakout area of $47.50. The PMO has turned up and is ready to give us a nice BUY signal. The RSI just entered positive territory and the OBV is confirming the move. The SCTR is in the "hot zone" above 75. I set the stop at the June top.
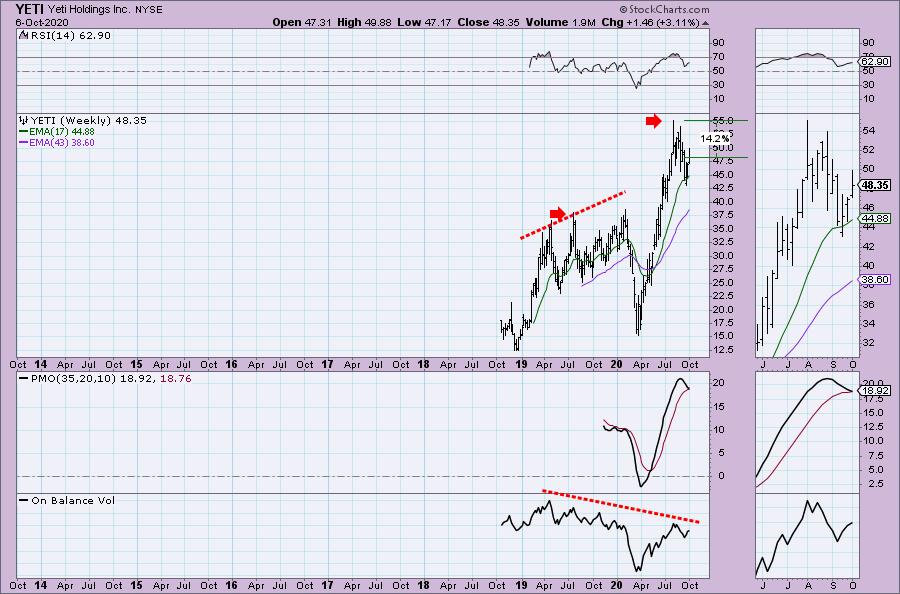
The weekly PMO is ugly, but there isn't enough data to determine overbought/oversold. I think my first impression of the OBV is that there is a strong reverse divergence (not bullish), but I'm going to forgive it and chalk it up to IPO excitement and accumulation volume.
Full Disclosure: I set a limit order on HOG and got in near the low today on the big end of day pullback. I'm about 55% invested and 45% is in 'cash', meaning in money markets and readily available to trade with. Depending on morning market action, I'll purchase LL. If the market continues today's end of day disaster, I'll be working on divesting any vulnerable positions.
Current Market Outlook:
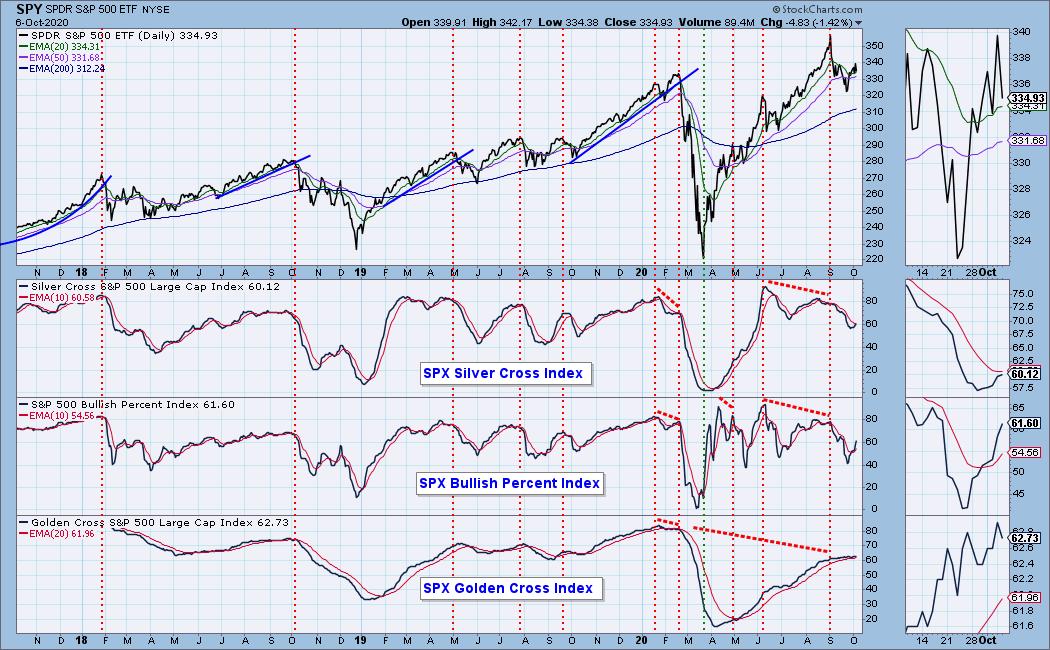
Market Environment: It is important to consider the odds for success by assessing the market tides. The following chart uses different methodologies for objectively showing the depth and trend of participation for intermediate- and long-term time frames.
- The Silver Cross Index (SCI) shows the percentage of SPX stocks on IT Trend Model BUY signals (20-EMA > 50-EMA)
- The Golden Cross Index (GCI) shows the percentage of SPX stocks on LT Trend Model BUY signals (50-EMA > 200-EMA)
- The Bullish Percent Index (BPI) shows the percentage of SPX stocks on Point & Figure BUY signals.
Don't forget that as a "Diamonds" member, you have access to our GCI/SCI curated ChartList on DecisionPoint.com. You'll find it under "Members Only" links on the left side on the Blogs and Links Page.
Here is the current chart:
Diamond Index:
- Diamond Scan Results: 43
- Diamond Dog Scan Results: 3
- Diamond Bull/Bear Ratio: 14.33
Technical Analysis is a windsock, not a crystal ball.
Happy Charting!
- Erin
erin@decisionpoint.com
Watch the latest episode of DecisionPoint with Carl & Erin Swenlin on Mondays 7:00p EST or on the DecisionPoint playlist on the StockCharts TV YouTube channel here!
NOTE: The stocks reported herein are from mechanical trading model scans that are based upon moving average relationships, momentum and volume. DecisionPoint analysis is then applied to get five selections from the scans. The selections given should prompt readers to do a chart review using their own analysis process. This letter is not a call for a specific action to buy, sell or short any of the stocks provided. There are NO sure things or guaranteed returns on the daily selection of "diamonds in the rough."
Helpful DecisionPoint Links:
DecisionPoint Shared ChartList and DecisionPoint Chart Gallery
Price Momentum Oscillator (PMO)
Swenlin Trading Oscillators (STO-B and STO-V)
For more links, go to DecisionPoint.com!