
Terrible day for the market--the indicators tell me this is going to get worse before it gets better. Consequently, I threw in three shorting opportunities today. I'm not a fan of shorting, it doesn't suit my investment profile and your profit potential is "bounded", meaning there's a point (zero) that is the best you can do on a short; you're not going to see too many of your shorts go to 'zero'. However, many do short and with the markets this weak, it will be very hard for me to come up with the few winners that are left out there. So, as we move forward and I continue to see market weakness or an oncoming correction/bear market, let's consider the 'diamonds in the rough' as watch list material. I do not have high confidence in any picks right now. This was my mentality during the March bear market.
Today's "Diamonds in the Rough": CHGG, GRA (Short), PSN (Short), QIWI, and TBPH (Short).
 Diamond Mine Information:
Recording from Today (9/18/2020) is at this link. Access Passcode: 0CFU!90Q
Register in advance for the next "DecisionPoint Diamond Mine" trading room on Friday (9/18) 12:00p EST:
Here is this week's registration link. Password: diamonds
Please do not share these links! They are for Diamonds subscribers ONLY!

Click here to register in advance for the recurring free DecisionPoint Trading Room (Next one is 9/28)! Did you miss the 9/21 trading room? Here is a link to the recording (password: 2Ai3a=r4).
Welcome to DecisionPoint Daily Diamonds, wherein I highlight five "diamonds in the rough." These are selected from the results of my DecisionPoint scans, which search for stocks that could benefit from the trend and condition of the market. Remember, these are not recommendations to buy or sell, but are the most interesting of the stocks that surfaced in my scans. My objective is to save you the work of the initial, tedious culling process, but you need to apply your own analysis to see if these stocks pique your interest as well. There are no guaranteed winners here!
Chegg, Inc. (CHGG)
EARNINGS: 11/2/2020 (AMC)
Chegg, Inc. engages in the operations of learning platform for students. It intends to empower students to take control of their education and help the students study, college admissions exams, accomplish their goals, get grades, and test scores. The firm offers required and non-required scholastic materials including textbooks in any format; access to online homework help and textbook solutions; course organization and scheduling; college and university matching tools; and scholarship connections. Its services include Chegg study, writing, tutors, and math solver. The company was founded by Osman Rashid and Aayush Phumbhra on July 29, 2005 and is headquartered in Santa Clara, CA.
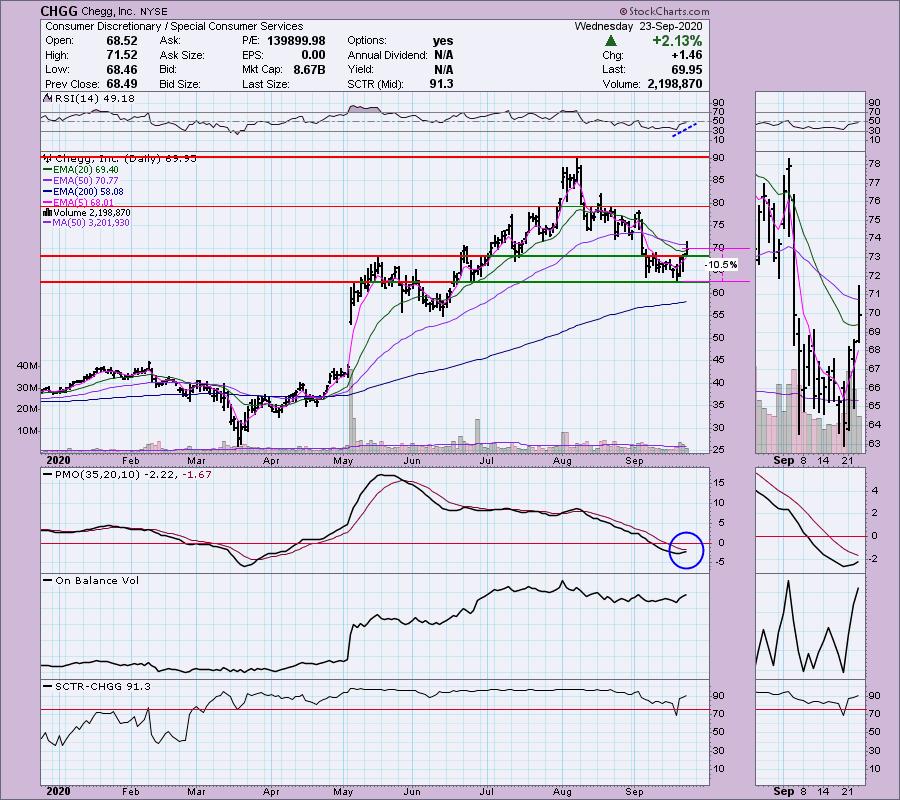
Up +0.06% in after hours trading, CHGG was a Diamond in April 27th DP Diamonds Report at $41.85. That's a +67% gain with help from the rebound off the bear market bottom. I like today's breakout and close above the 20-EMA. The RSI is nearly positive and the PMO has turned up. The OBV isn't telling us much, but the SCTR is in the "hot zone" above 75. It is a rather deep stop at 10.5%, but if you time your entry, you should be able to shave that a little bit.
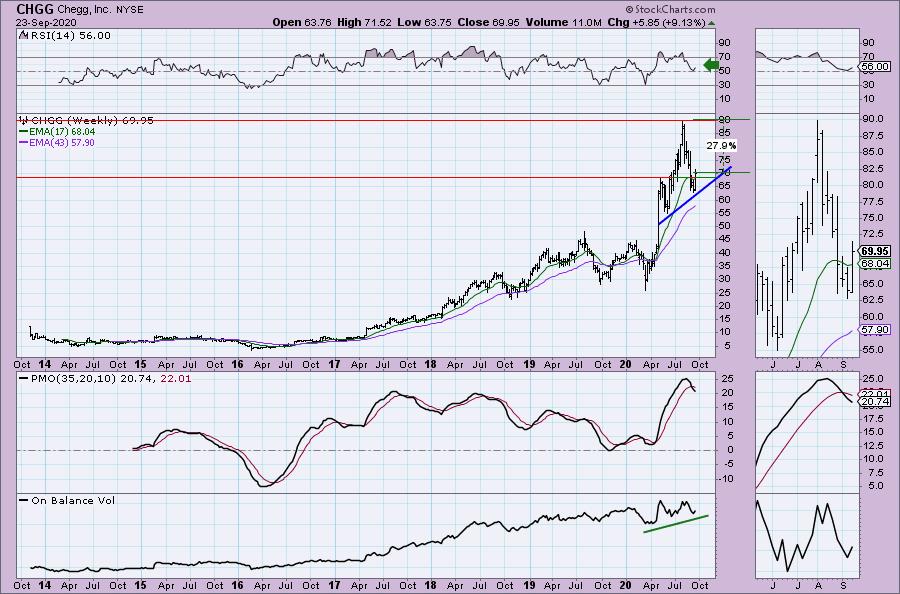
The weekly PMO doesn't look good at all, but the RSI bounced up to stay in positive territory and the OBV is confirming the rising trend so far.
W.R. Grace & Co. (GRA) - (SHORT)
EARNINGS: 10/22/2020 (BMO)
W.R. Grace & Co. engages in the production and sale of chemicals and materials. It operates through the Grace Catalysts Technologies and Grace Materials Technologies segments. The Grace Catalysts Technologies segment includes catalysts and related products and technologies used in refining, petrochemical and other chemical manufacturing applications. The Grace Materials Technologies segment includes materials, including silica-based and silica-alumina-based materials, used in coatings, consumer, industrial, and pharmaceutical applications. The company was founded by William Russell Grace in 1854 and is headquartered in Columbia, MD.
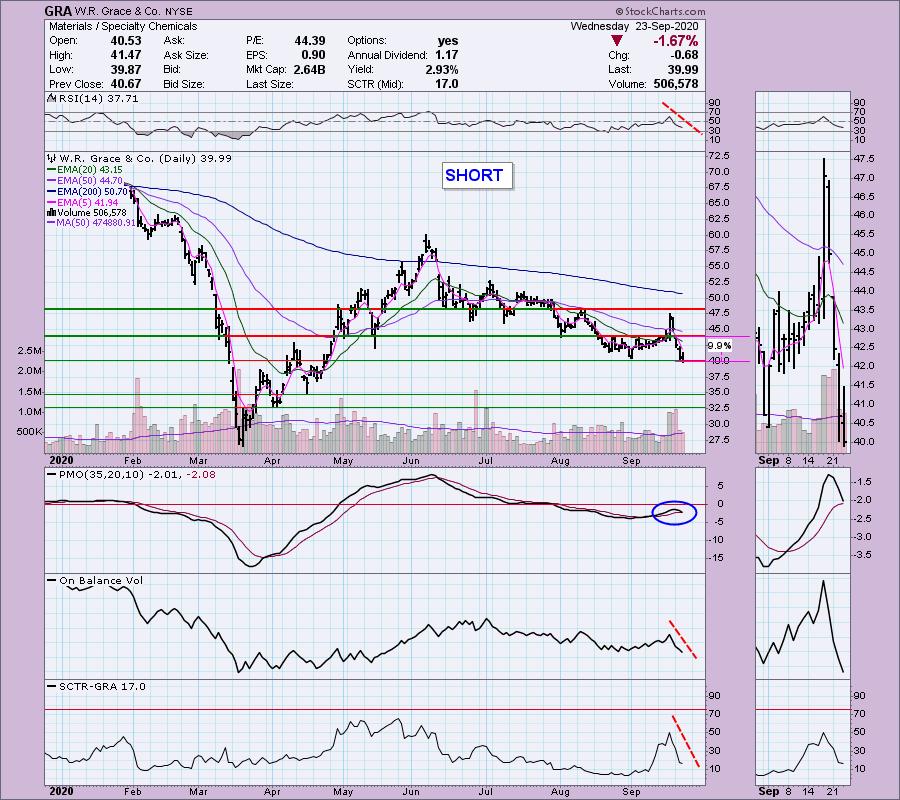
In the thumbnail, you can see that price closed below support at the 9/1 low. It is the lowest close since April. The PMO is configured very negatively which of course is good for a short. The RSI and OBV are both declining and getting weaker. In this case, I set the stop above the current price since we are looking at a short. The drop dead area for this short would be at the top of the previous consolidation zone.
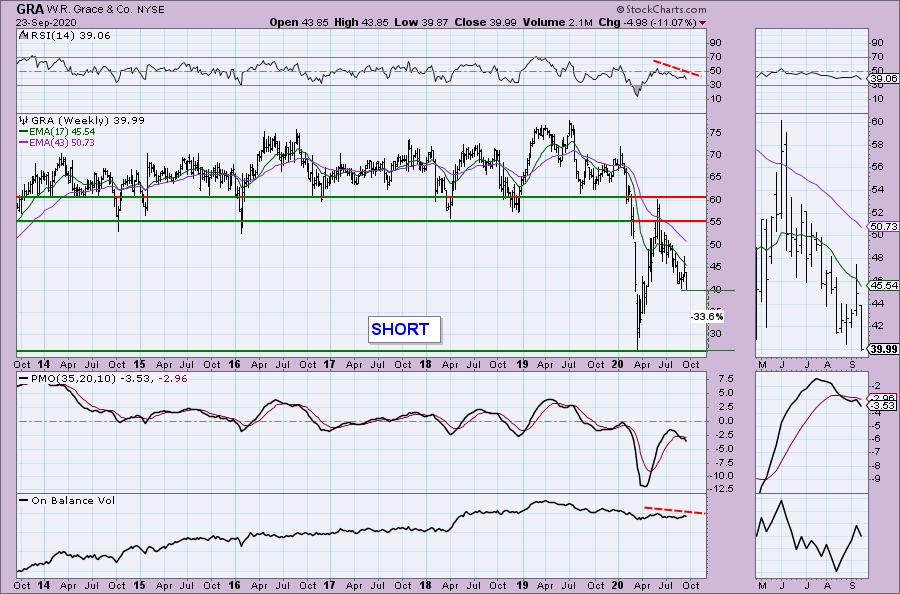
The weekly PMO has topped below its signal line and is accelerating downward. I do not see support until it hits its bear market low. The fact that even off the rebound of the bear market bottom, price never was able to recapture the previous trading range between $55 and $75. The OBV is confirming the declining trend.
Don't forget, on Thursdays I look at reader-requested symbols, so shoot me an email at erin@decisionpoint.com. I read every email I receive and try to answer them all!
Parsons Corp. (PSN)
EARNINGS: 11/4/2020 (BMO)
Parsons Corp. provides engineering, design, planning, and construction management services. It offers solutions for commercial, federal, transportation, and water resources. The firm delivers engineering, construction, systems and resource integration, project and program management, and environmental services to customers. Its business segments include Federal Solutions and Critical Infrastructure. The Federal Solutions segment provides advanced technologies, including cybersecurity, missile defense systems, C5ISR, space launch and situational awareness, geospatial intelligence, RF signals intelligence, nuclear and chemical waste remediation, and engineering services. The Critical Infrastructure segment provides integrated design and engineering services for complex physical and digital infrastructure around the globe. The company was founded by Ralph Monroe Parsons on June 12, 1944 and is headquartered in Centreville, VA.
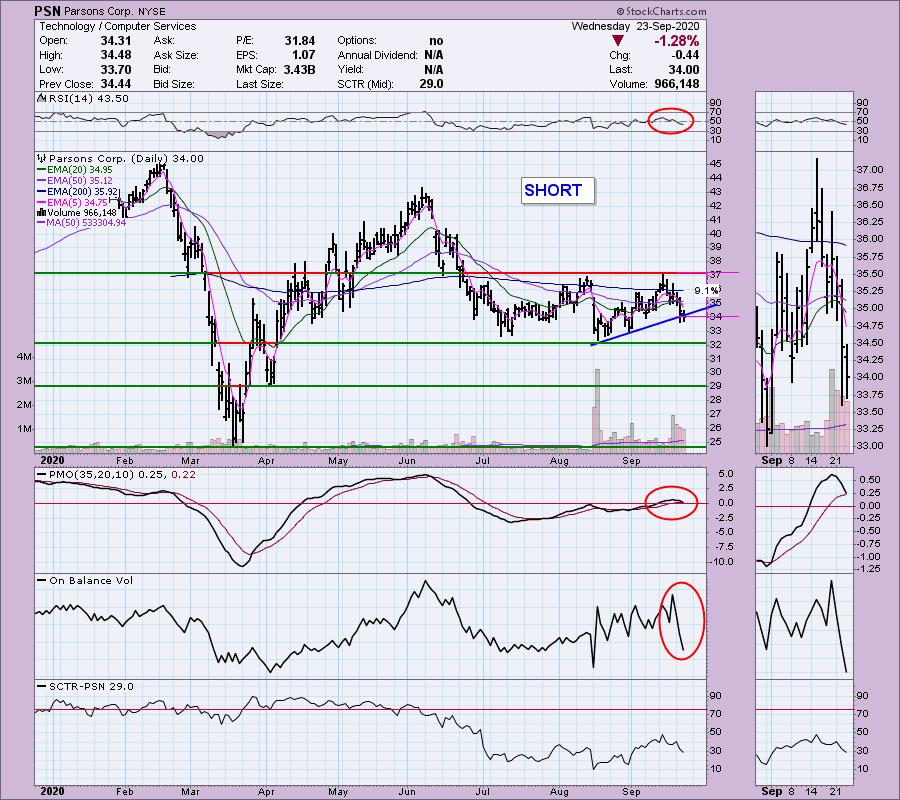
Here is another possible shorting opportunity. The rising trend was broken yesterday and today price closed beneath the rising trendline. The PMO is nearing a SELL signal and the RSI has entered negative territory below net neutral (50). The stop level for the short is at the tops from August/September. I would also like to point out that there is an ascending triangle formation. These are bullish patterns, so if this breakdown continues it will mean a bearish conclusion to a bullish chart pattern which I find especially bearish. Support is nearby at $32, so watch to make sure that level doesn't hold. The OBV shows major selling on PSN which is also bearish.
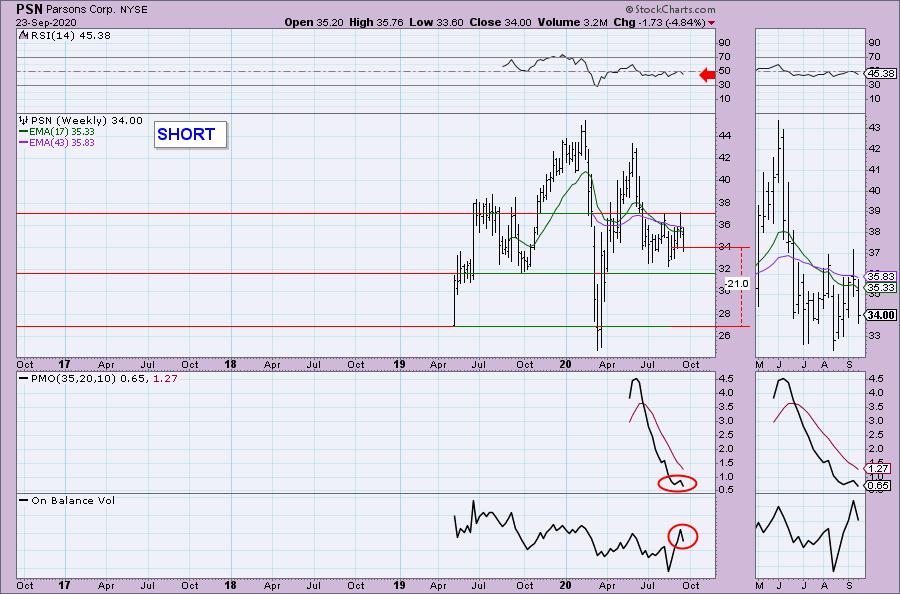
The weekly RSI is negative and the PMO has topped below the signal line. Notice that the last top on the OBV is higher than the previous top that came in at the April top. It's a reverse divergence that tells us that despite high positive volume coming in, price was unable to even challenge its previous price top. That's bearish.
Qiwi plc (QIWI)
EARNINGS: 11/19/2020 (BMO)
Qiwi Plc is a holding company, which engages in the provision of payment and financial services. It operates through the following segments: Payment Services (PS), Consumer Financial Services (CFS), Small and Medium Enterprises (SME), Rocketbank (RB), and Corporate and Other (CO). The PS segment provides virtual distribution services through the QIWI Wallet and other QIWI applications. The CFS segment encompasses financial services rendered to individuals, currently presented by Sovest installment card project. The SME segment offers a range of services to small and medium businesses. The RB segment consists of digital banking services, including debit cards and deposits to retail customers. The CO segment represents expenses related to corporate operations of QIWI Group. The company was founded on February 26, 2007 and is headquartered in Nicosia, Cyprus.
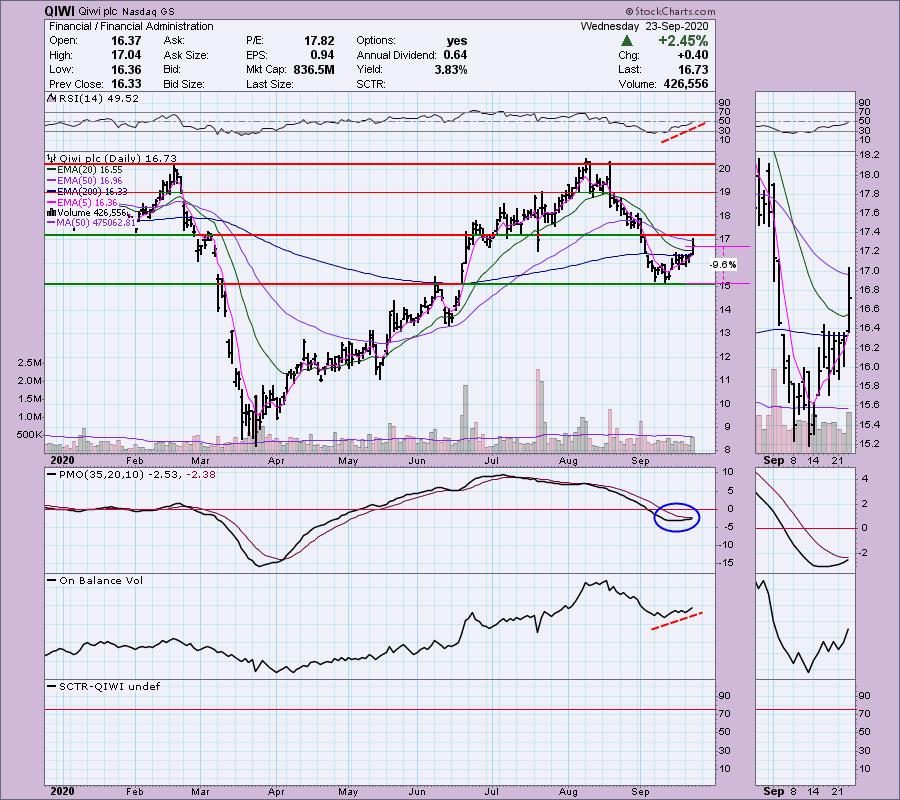
Hmmmm as I start writing about QIWI, I see that it is down -1.38% in after hours trading and this is not one of my shorts today. That would put price at $16.50 which is still above the previous price cluster. This is the pullback after the breakout that can be used to find a good entry. Unfortunately, like with PETS yesterday, I know this Diamond will get hurt on the pullback as far as reporting it on the spreadsheet Friday but I'm looking for higher prices. The RSI is rising steadily, although it isn't positive right now. The OBV is confirming the rally and the PMO is nearing a crossover BUY signal.
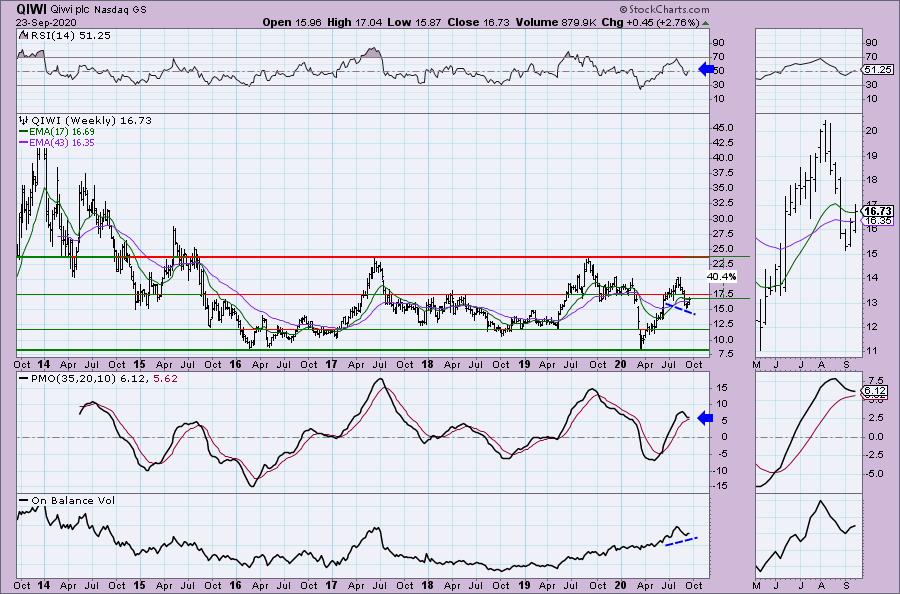
The weekly PMO is working hard to avoid a SELL signal. The RSI has just entered positive territory and the OBV has a positive divergence with price bottoms.
Theravance Biopharma, Inc. (TBPH) - SHORT
EARNINGS: 11/3/2020 (AMC)
Theravance Biopharma, Inc. operates as a biopharmaceutical company. It focuses on the discovery, research, development, and commercialization of organ-selective medicines. Its products include telavancin under the VIBATIV brand, revefenacin under the TD 4208 brand, and neprilysin. The company was founded in July 2013 and is headquartered in George Town, Cayman Islands.
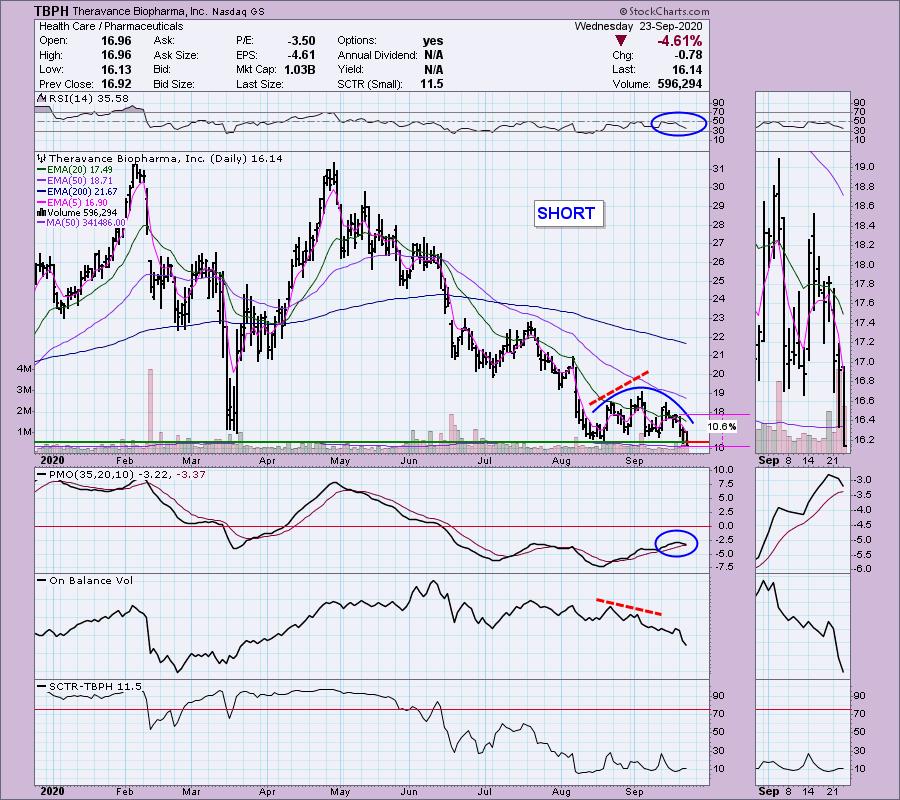
I have to say this one looked especially ugly with today's breakdown below support. The RSI is negative and the PMO is heading lower for a crossover SELL signal. The OBV had a negative divergence set up at the September top. Right now, the rounded top looks pretty ugly. The stop level to the upside is deeper than I'd like. I suggest using the 20-EMA as a stop level on this short.
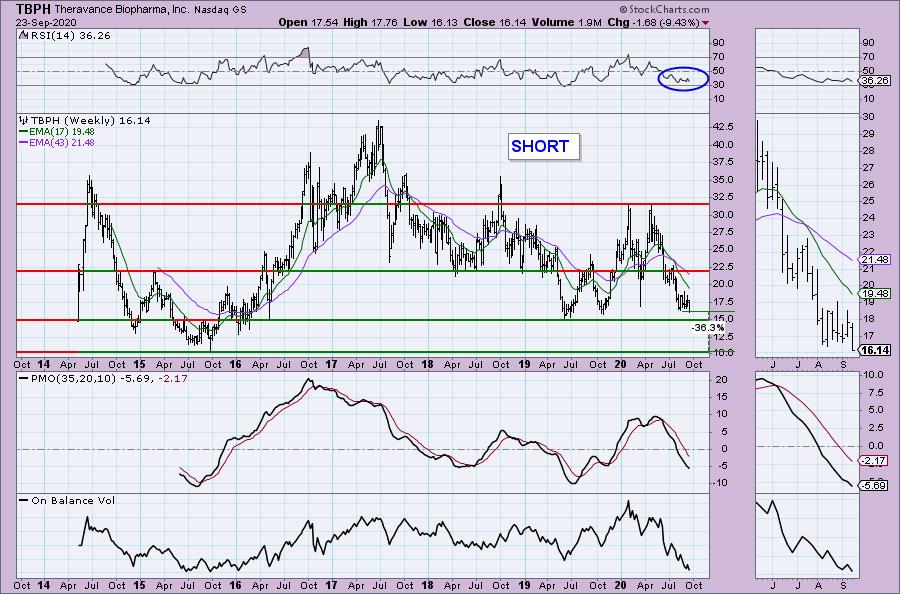
This one is reaching its 2019 lows and certainly could indicate a possible rebound. However, the market is very negative and the indicators on TBPH are very negative. The PMO is declining, the RSI is negative and negative volume is at levels seen back at the 2015 low. If it doesn't hold support, the potential gain on this short could be nice.
Full Disclosure: I am not adding any new positions. I'm about 40% invested and 60% is in 'cash', meaning in money markets and readily available to trade with.
Current Market Outlook:
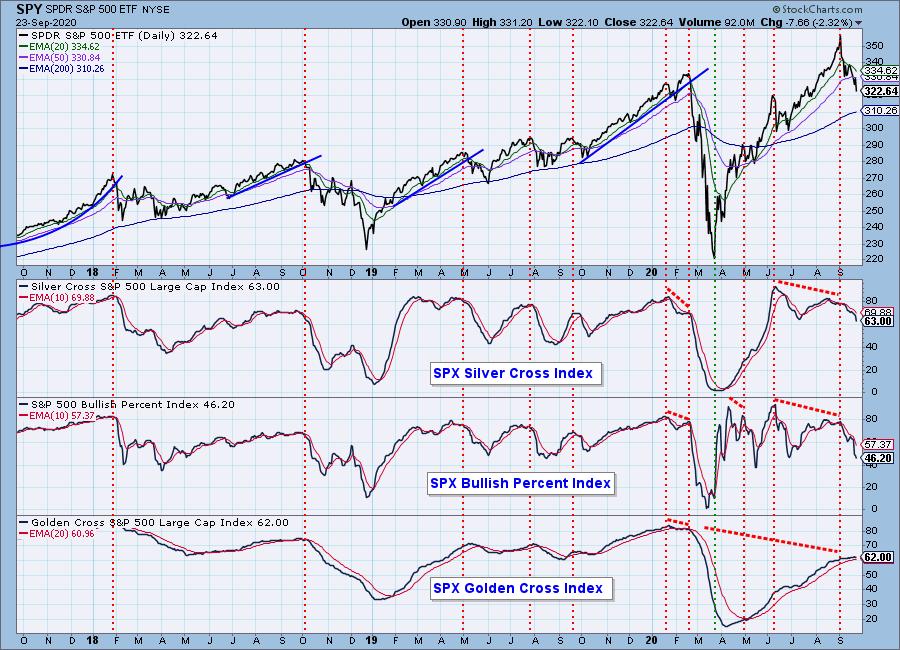
Market Environment: It is important to consider the odds for success by assessing the market tides. The following chart uses different methodologies for objectively showing the depth and trend of participation for intermediate- and long-term time frames.
- The Silver Cross Index (SCI) shows the percentage of SPX stocks on IT Trend Model BUY signals (20-EMA > 50-EMA)
- The Golden Cross Index (GCI) shows the percentage of SPX stocks on LT Trend Model BUY signals (50-EMA > 200-EMA)
- The Bullish Percent Index (BPI) shows the percentage of SPX stocks on Point & Figure BUY signals.
Don't forget that as a "Diamonds" member, you have access to our GCI/SCI curated ChartList on DecisionPoint.com. You'll find it under "Members Only" links on the left side on the Blogs and Links Page.
Here is the current chart:
Diamond Index:
- Diamond Scan Results: 7
- Diamond Dog Scan Results: 12
- Diamond Bull/Bear Ratio: 0.58
Technical Analysis is a windsock, not a crystal ball.
Happy Charting!
- Erin
erin@decisionpoint.com
Watch the latest episode of DecisionPoint with Carl & Erin Swenlin on Mondays 7:00p EST or on the DecisionPoint playlist on the StockCharts TV YouTube channel here!
NOTE: The stocks reported herein are from mechanical trading model scans that are based upon moving average relationships, momentum and volume. DecisionPoint analysis is then applied to get five selections from the scans. The selections given should prompt readers to do a chart review using their own analysis process. This letter is not a call for a specific action to buy, sell or short any of the stocks provided. There are NO sure things or guaranteed returns on the daily selection of "diamonds in the rough."
Helpful DecisionPoint Links:
DecisionPoint Shared ChartList and DecisionPoint Chart Gallery
Price Momentum Oscillator (PMO)
Swenlin Trading Oscillators (STO-B and STO-V)
For more links, go to DecisionPoint.com!