
Remember last week when I had 53 Diamond PMO Scan results? Well that number has been steadily falling as the market continues to display weakness. Today I had only seven results and I didn't like any of them. So, what to do? I ran my Momentum Sleepers Scan. There I found 44 stocks/ETFs to review. I have narrowed that down to the top five based on my analysis of the indicators and price action. The one problem with the Momentum Sleepers Scan, it finds 'beat down' stocks that are showing a build up of upside momentum in the short term. Consequently, the weekly charts look pretty ugly; that means they aren't a good idea for a longer-term hold strategy. Additionally, while we had a spectacular day in the markets, the overall internals of the major indexes is very weak. I am not interested in babysitting a short-term investment right now, but if I were, these were the stocks that floated to the top today as diamonds in the rough.
Today's "Diamonds in the Rough": LRCX, MSCI, PETS, PFPT, and TEAM.
P.S. I did look for some shorting opportunities using the Diamond Dog Scan, but with no luck. Even with 36 results, I didn't see any that were bearish enough to present.
 Diamond Mine Information:
Recording from Today (9/18/2020) is at this link. Access Passcode: 0CFU!90Q
Register in advance for the next "DecisionPoint Diamond Mine" trading room on Friday (9/18) 12:00p EST:
Here is this week's registration link. Password: diamonds
Please do not share these links! They are for Diamonds subscribers ONLY!

Click here to register in advance for the recurring free DecisionPoint Trading Room (Next one is 9/28)! Did you miss the 9/21 trading room? Here is a link to the recording (password: 2Ai3a=r4).
Welcome to DecisionPoint Daily Diamonds, wherein I highlight five "diamonds in the rough." These are selected from the results of my DecisionPoint scans, which search for stocks that could benefit from the trend and condition of the market. Remember, these are not recommendations to buy or sell, but are the most interesting of the stocks that surfaced in my scans. My objective is to save you the work of the initial, tedious culling process, but you need to apply your own analysis to see if these stocks pique your interest as well. There are no guaranteed winners here!
Lam Research Corp. (LRCX)
EARNINGS: 10/21/2020 (AMC)
Lam Research Corp. engages in manufacturing and servicing of wafer processing semiconductor manufacturing equipment. It operates through the following geographical segments: the United States, China, Europe, Japan, Korea, Southeast Asia, and Taiwan. It offers thin film deposition, plasma etch, photoresist strip, and wafer cleaning. The company was founded by David Lam on January 21, 1980 and is headquartered in Fremont, CA.
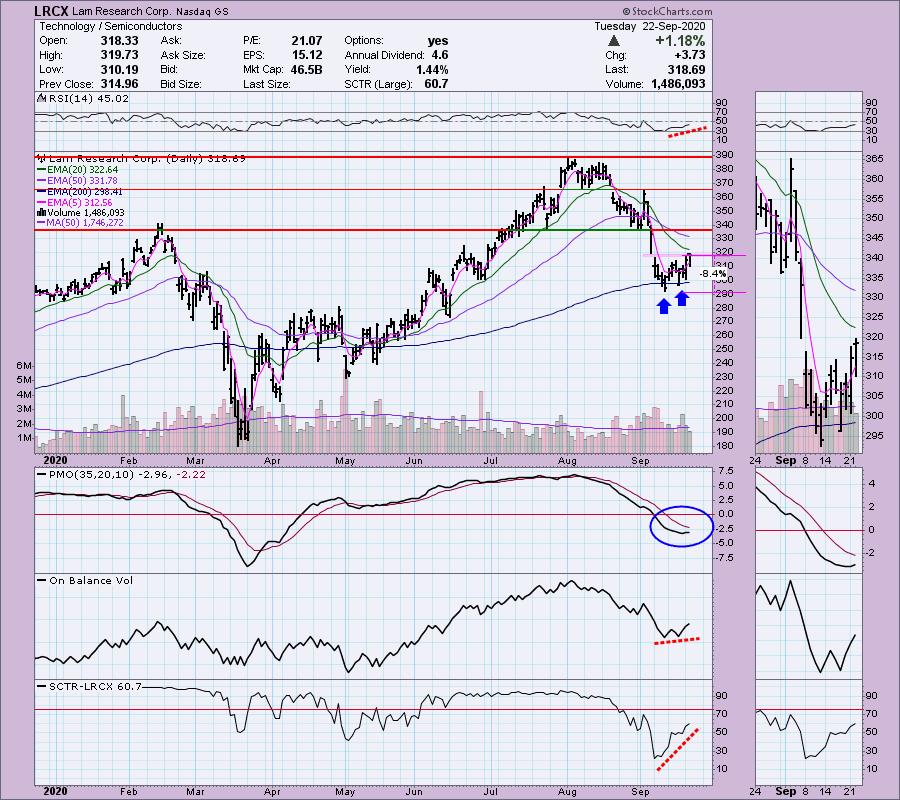
Down -0.03% in after hours trading, LRCX was a diamond in the rough in the June 8th Diamond Report. This one turned out lovely if you managed to get out near the top. I think LRCX is ready to rally again. It is holding the 200-EMA as support and has formed a small bullish double-bottom. The 50-EMA > 200-EMA which gives it a bullish bias. The gap I've colored in pink nearly filled today. We do have overhead resistance nearing and given it is somewhat beat down, the RSI isn't positive yet. It is rising though. The PMO is curling up toward a positive crossover BUY signal. The SCTR has certainly improved as well. The OBV is confirming the rising trend.
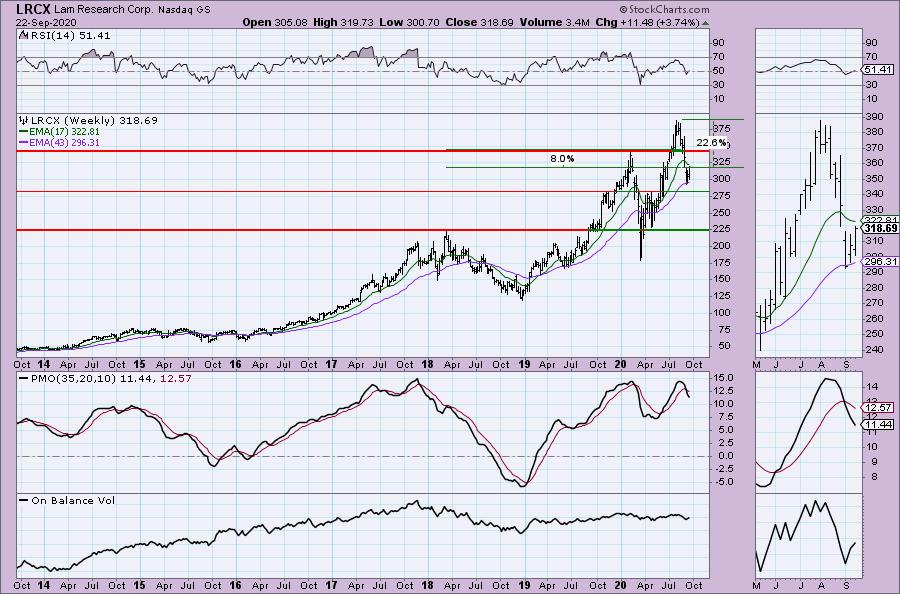
As I said, the weekly charts on these selections aren't great. In this case, should the short-term rally stick, the upside potential is 22%. However, if it only can challenge resistance at the early 2020 top, that would be an 8% gain.
MSCI, Inc. (MSCI)
EARNINGS: 10/29/2020 (BMO)
MSCI, Inc. engages in the provision of investment decision support tools, including indices, portfolio risk and performance analytics and corporate governance products and services. The company operates through the following business segments: Index; Analytics; Environmental, Social, and Governance (ESG); and Real Estate. The Index segment involves in the index-linked product creation and performance benchmarking, as well as portfolio construction and rebalancing, and asset allocation. The Analytics segment offers risk management, performance attribution and portfolio management content, applications and services. The ESG segment offers products and services that help institutional investors understand how ESG factors can impact the long-term risk of investments. The Real Estate segment includes research, reporting, market data and benchmarking offerings that provide real estate performance analysis for funds, investors and managers.. The company was founded by Andrew Thomas Rudd in 1998 and is headquartered in New York, NY.
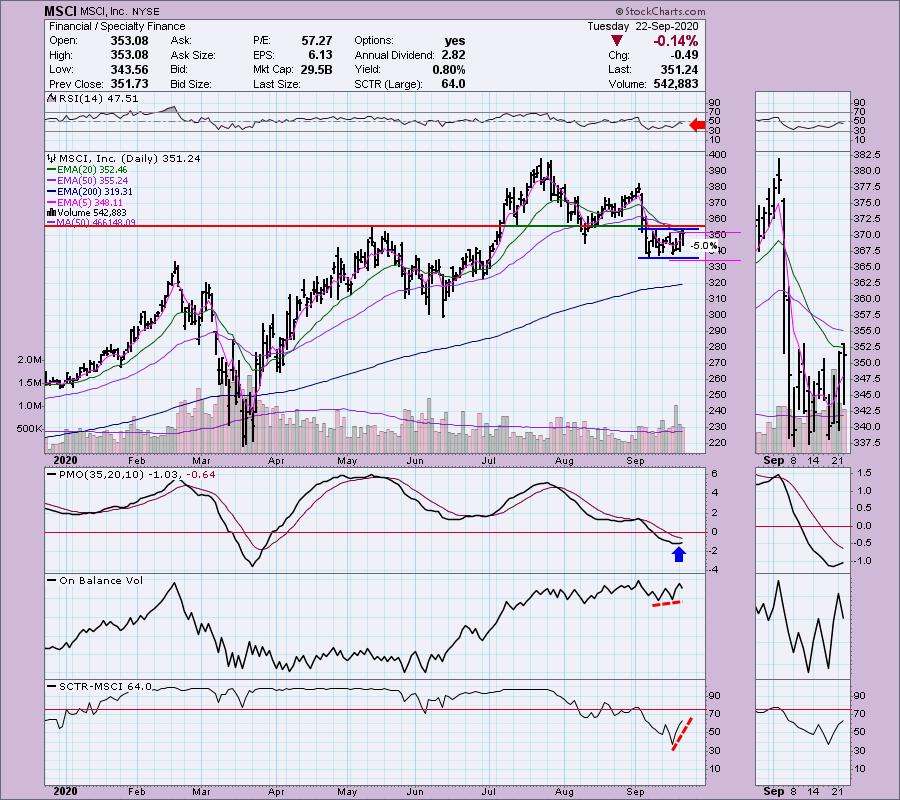
MSCI was a diamond in the rough in the September 1st Diamond Report at $377.56. Clearly the timing on that one was terrible. It went up the following day and then tanked the next two. (I will always own up to a bad 'call', but I will also stand by my analysis at the time it was presented). Since that decline, it has formed a rectangle consolidation zone. As I recently discovered, that is a reversal pattern in which case we should look for an upside breakout. The stop level is very manageable at 5%. The OBV is confirming a rally and the PMO is just beginning to rise. The RSI is still negative, but close to moving positive. The SCTR has jumped higher despite price just moving sideways.
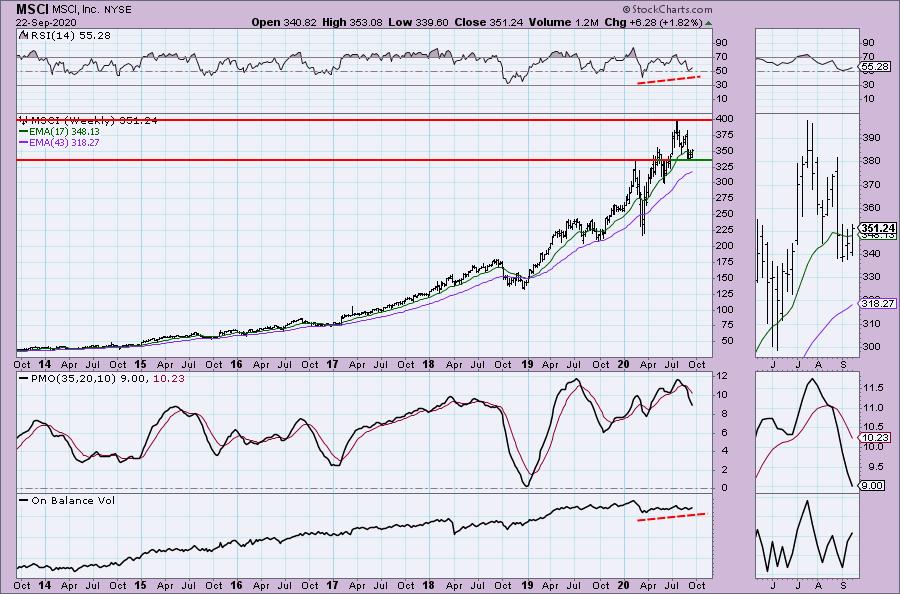
The RSI is positive and rising bottoms are healthy. The PMO leaves a lot to be desired, but the OBV bottoms are rising, even if slightly.
Don't forget, on Thursdays I look at reader-requested symbols, so shoot me an email at erin@decisionpoint.com. I read every email I receive and try to answer them all!
PetMed Express, Inc. (PETS)
EARNINGS: 10/19/2020 (BMO)
PetMed Express, Inc. engages in the provision of markets prescription and non-prescription pet medications, health products and supplies for dogs and cats. Its non-prescription medications include flea and tick control products, bone and joint care products, vitamins, treats, nutritional supplements, hygiene products, and supplies. The prescription medications include heartworm preventatives, arthritis, thyroid, diabetes and pain medications, heart/blood pressure, and other specialty medications, as well as generic substitutes. The firm markets its products through national television, online and direct mail or print advertising campaigns. The company was founded in January 1996 and is headquartered in Delray Beach, FL.
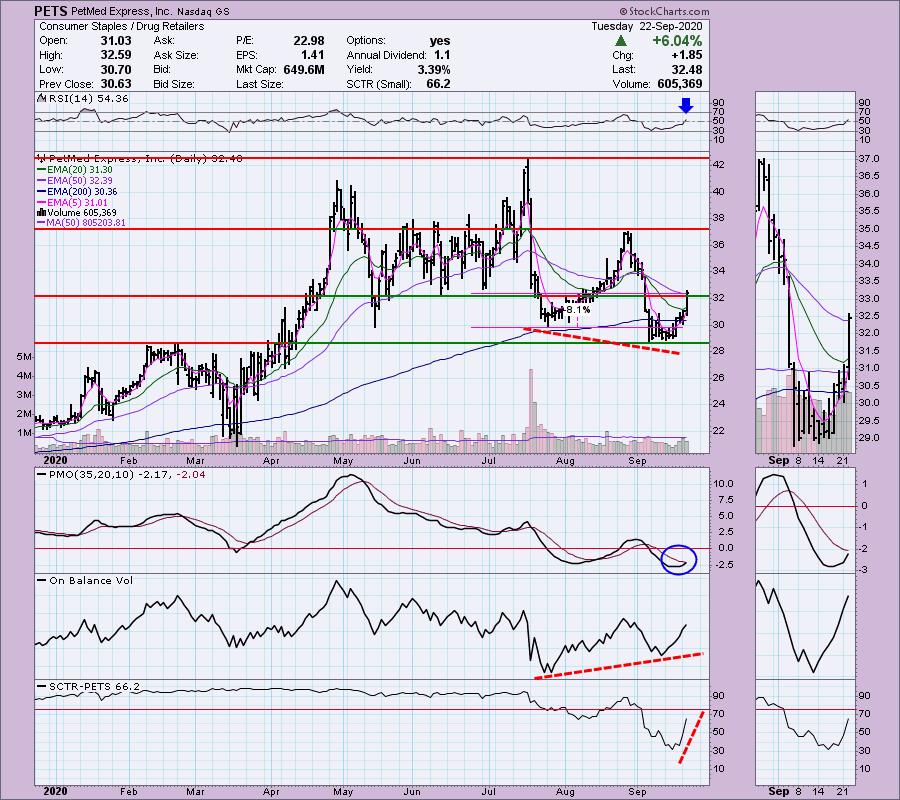
This is probably one of my favorite diamonds in the rough today. I hesitated to include it simply because it was up over 6% today and that could eat into my points on the Friday Diamond Recap, as it likely will pullback somewhat before running higher. However, it is a strong chart. The big move today vaulted not only the 20/50-EMAs, but also overhead resistance at the June lows. The stop level I chose is matched up with the July low. It would be a 12.5% stop if we moved it to this month's low. The RSI has just reached positive territory. The OBV has a positive divergence with price bottoms. The PMO is rising and the SCTR is quickly improving.
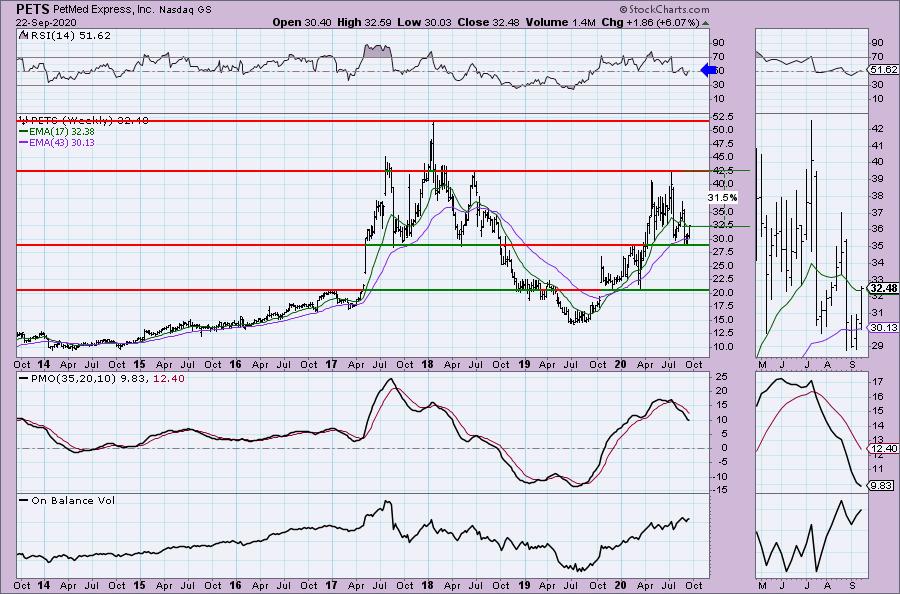
The weekly PMO is pointed downward but it does appear to be decelerating somewhat on the recent rally. The RSI is positive.
Proofpoint, Inc. (PFPT)
EARNINGS: 10/29/2020 (AMC)
Proofpoint, Inc. is a cybersecurity company. It engages in the provision of cloud-based solutions. The firm's security and compliance platform comprises of an integrated suite of threat protection, information protection, and brand protection solutions. Its solutions also includes email protection, advanced threat protection, email authentication, data loss prevention, SaaS application protection, response orchestration and automation, digital risk, web browser isolation, email encryption, archiving, eDiscovery, supervision, secure communication, phishing simulation and security awareness computer-based training. The company was founded by Eric Hahn in May 2002 and is headquartered in Sunnyvale, CA.
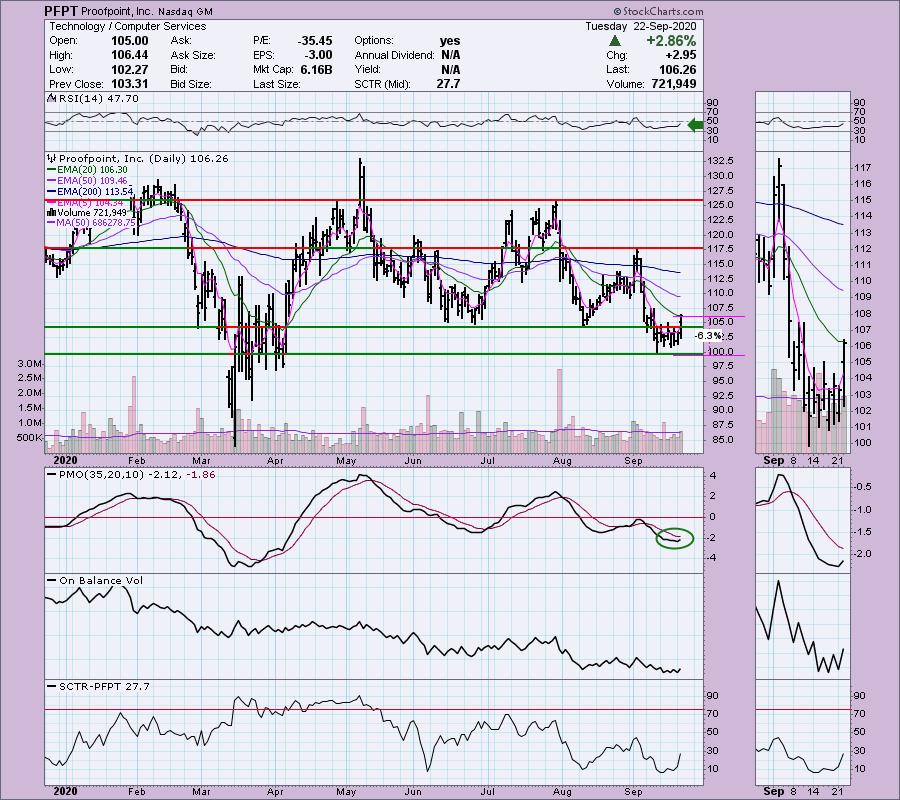
Here's another breakout from a bottom fish. Price just burst upward and out of a consolidation zone. It traded above the 20-EMA, but did close below it slightly. The PMO is showing great improvement in oversold territory. The RSI is negative still but it is rising. The SCTR is rising. The OBV isn't doing much right now so I read it as neutral. The stop just below the September low is very manageable at 6.3%.
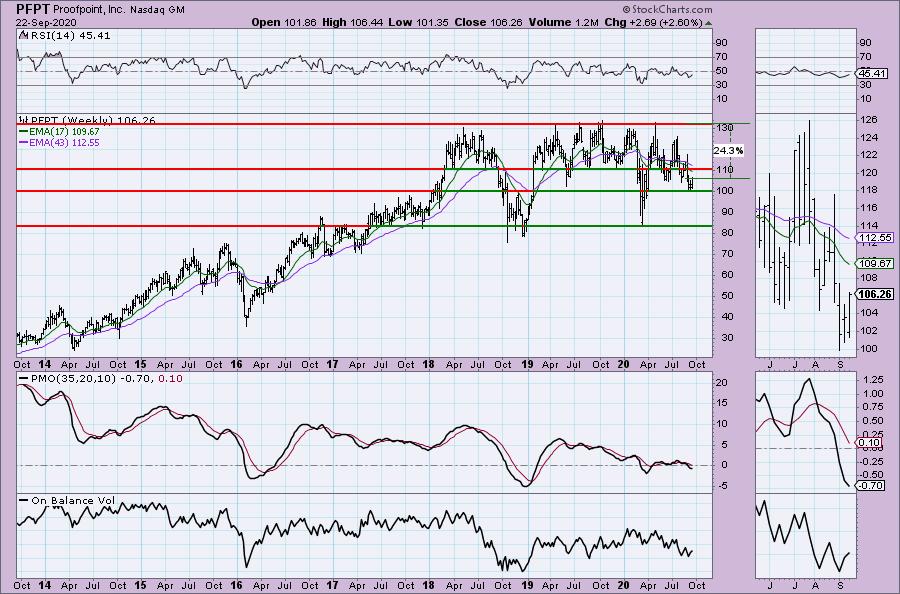
Unfortunately there isn't that much that is positive on the weekly chart. The RSI is still negative and while the PMO is decelerating, it is still falling and on a SELL signal. The OBV is confirming the recent declining trend.
Atlassian Corp. (TEAM)
EARNINGS: 10/15/2020 (AMC)
Atlassian Corp. Plc is a holding company, which engages in the design, development, license, and maintenance of software and provision software hosting services. Its products include JIRA software, align, core, and Service Desk, Confluence, Trello, Bitbucket, Sourcetree, bamboo, opsgenie, and statuspage. The company was founded by Michael Cannon-Brookes and Scott Farquhar in 2002 and is headquartered in Sydney, Australia.
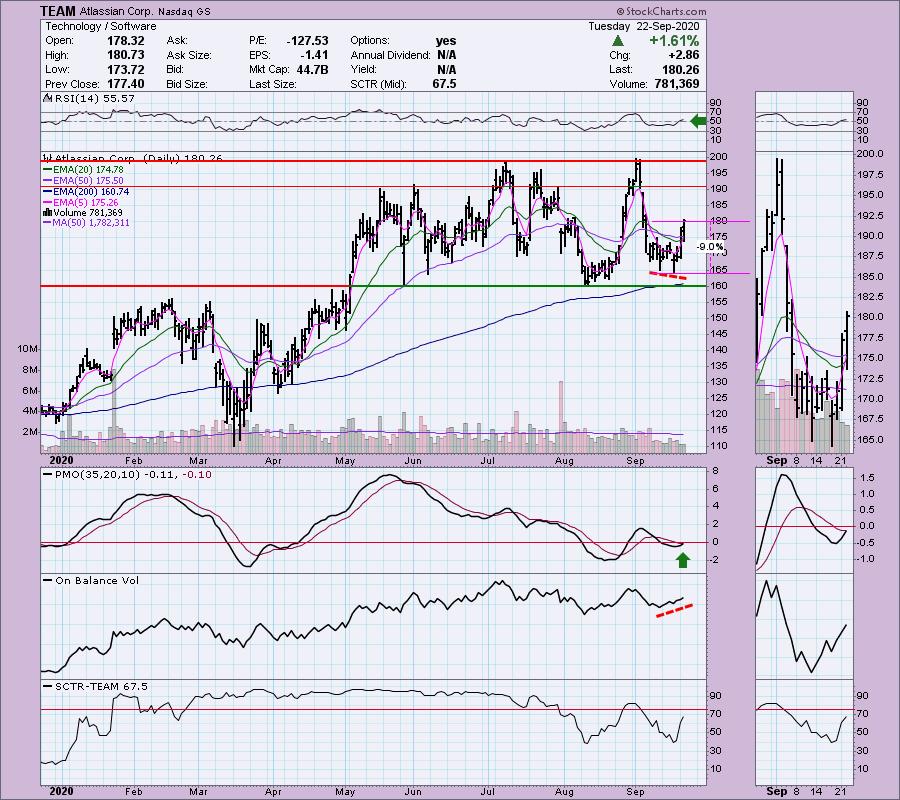
Down -0.14% in after hours trading, TEAM had a nice breakout day. The RSI is just now in positive territory, price traded mostly above the 20/50-EMAs which are readying for a positive crossover. That "silver cross" would give us an IT Trend Model BUY signal. The PMO is one hundredth of a point away from a BUY signal. There is an OBV positive divergence in play and the SCTR is rising. The stop level is a bit deep at 9% but manageable with proper position sizing.
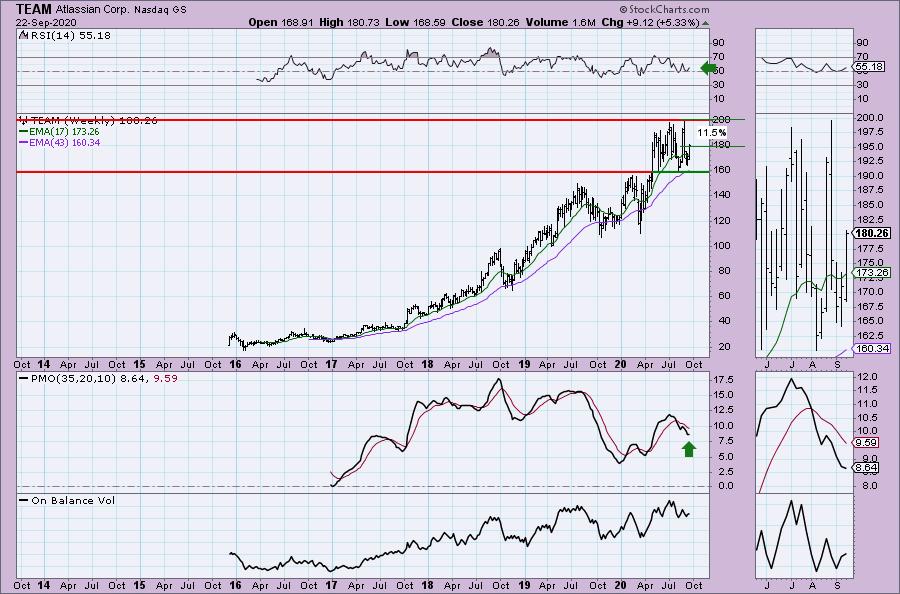
Another weekly chart with a PMO SELL signal and a decelerating PMO. The RSI is still positive and if it can get back to the all-time high, it would be a tidy 11.5% gain.
Full Disclosure: I am not adding any new positions. I'm about 50% invested and 50% is in 'cash', meaning in money markets and readily available to trade with.
Current Market Outlook:
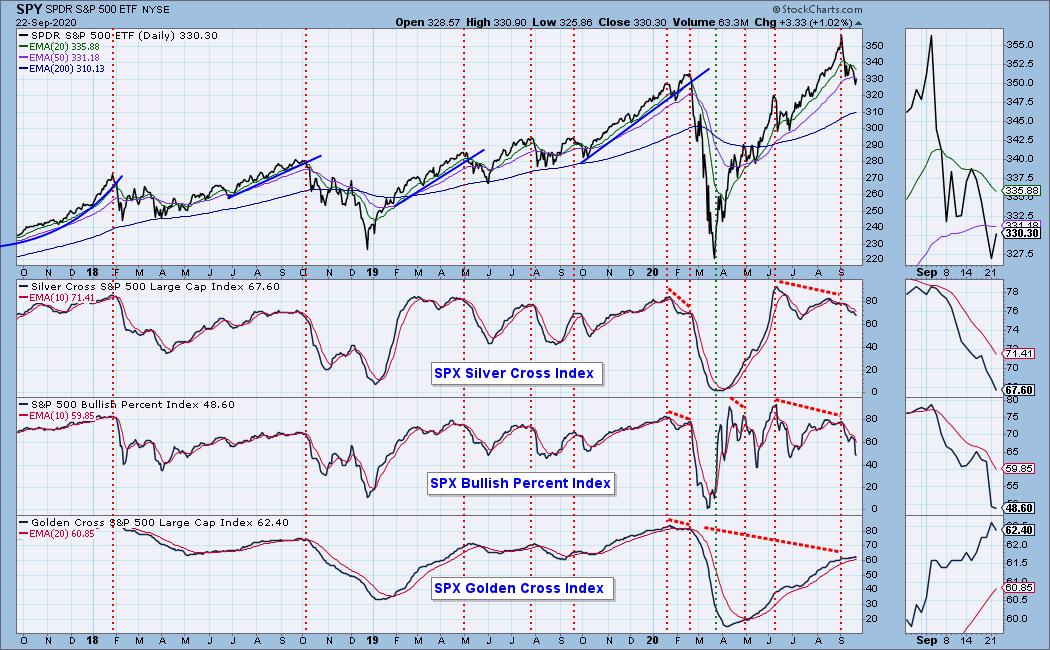
Market Environment: It is important to consider the odds for success by assessing the market tides. The following chart uses different methodologies for objectively showing the depth and trend of participation for intermediate- and long-term time frames.
- The Silver Cross Index (SCI) shows the percentage of SPX stocks on IT Trend Model BUY signals (20-EMA > 50-EMA)
- The Golden Cross Index (GCI) shows the percentage of SPX stocks on LT Trend Model BUY signals (50-EMA > 200-EMA)
- The Bullish Percent Index (BPI) shows the percentage of SPX stocks on Point & Figure BUY signals.
Don't forget that as a "Diamonds" member, you have access to our GCI/SCI curated ChartList on DecisionPoint.com. You'll find it under "Members Only" links on the left side on the Blogs and Links Page.
Here is the current chart:
Diamond Index:
- Diamond Scan Results: 7
- Diamond Dog Scan Results: 36
- Diamond Bull/Bear Ratio: 0.19
Technical Analysis is a windsock, not a crystal ball.
Happy Charting!
- Erin
erin@decisionpoint.com
Watch the latest episode of DecisionPoint with Carl & Erin Swenlin on Mondays 7:00p EST or on the DecisionPoint playlist on the StockCharts TV YouTube channel here!
NOTE: The stocks reported herein are from mechanical trading model scans that are based upon moving average relationships, momentum and volume. DecisionPoint analysis is then applied to get five selections from the scans. The selections given should prompt readers to do a chart review using their own analysis process. This letter is not a call for a specific action to buy, sell or short any of the stocks provided. There are NO sure things or guaranteed returns on the daily selection of "diamonds in the rough."
Helpful DecisionPoint Links:
DecisionPoint Shared ChartList and DecisionPoint Chart Gallery
Price Momentum Oscillator (PMO)
Swenlin Trading Oscillators (STO-B and STO-V)
For more links, go to DecisionPoint.com!df