
It's Reader Request Day! It's been a tough week, but so far, Diamonds are outperforming the SPX by 1.59%. Picking shorts yesterday was good for this week's Diamond portfolio (two of them were down 4.94% and the other down 3.78%), so my pick for the on Reader Request Day is a short. Thank you to my readers, George, Olivia and Jack for your selections this week. If you haven't registered for tomorrow's Diamond Mine, the information is below! Looking forward to your questions and requests as we do a thorough look back on this week's Diamonds.
Today's "Diamonds in the Rough": AAWW, BYD, MTN, NTUS (Short), and REK.
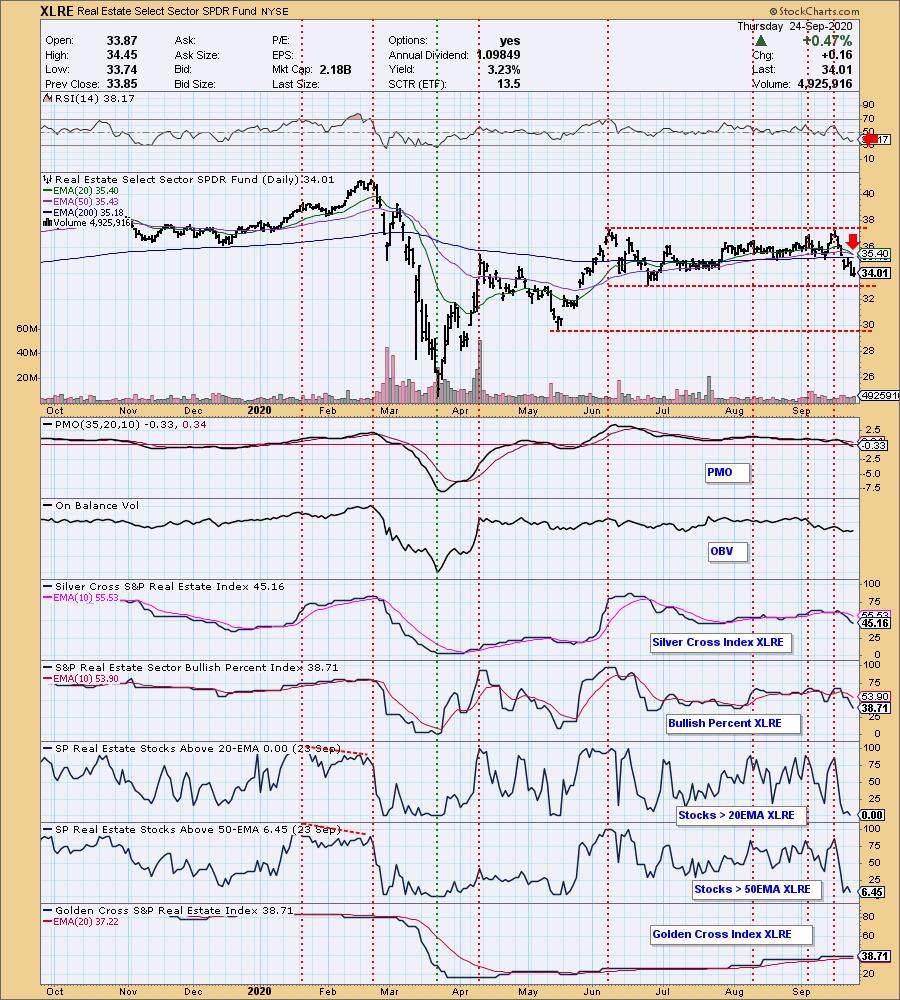
Before I get into the diamonds in the rough, one subscriber requested a ProShares Short Real Estate ETF (REK). I thought it would be helpful to look at the Real Estate sector as a whole. The chart is very negative which of course, is good for a shorting ETF. The 20-EMA just crossed below the 50-EMA while above the 200-EMA which generated a IT Trend Model NEUTRAL signal. Given XLRE has been in a sideways trading pattern most of the summer, it hasn't been a great place to be. The indicators are very negative, but they are oversold or getting oversold. XLRE could find support at that June low, but if it doesn't, REK will likely breakout nicely and continue higher.
 Diamond Mine Information:
Recording from Today (9/18/2020) is at this link. Access Passcode: 0CFU!90Q
Register in advance for the next "DecisionPoint Diamond Mine" trading room on Friday (9/18) 12:00p EST:
Here is this week's registration link. Password: diamonds
Please do not share these links! They are for Diamonds subscribers ONLY!

Click here to register in advance for the recurring free DecisionPoint Trading Room (Next one is 9/28)! Did you miss the 9/21 trading room? Here is a link to the recording (password: 2Ai3a=r4).
Welcome to DecisionPoint Daily Diamonds, wherein I highlight five "diamonds in the rough." These are selected from the results of my DecisionPoint scans, which search for stocks that could benefit from the trend and condition of the market. Remember, these are not recommendations to buy or sell, but are the most interesting of the stocks that surfaced in my scans. My objective is to save you the work of the initial, tedious culling process, but you need to apply your own analysis to see if these stocks pique your interest as well. There are no guaranteed winners here!
Atlas Air Worlwide Hldgs (AAWW)
EARNINGS: 11/5/2020 (BMO)
Atlas Air Worldwide Holdings, Inc. engages in the provision of outsourced aircraft and aviation operating services. It operates through the following segments: ACMI, Charter, and Dry Leasing. The ACMI segment offers aircraft, crew, maintenance and insurance services to customers. The Charter segment comprises planeload air cargo and passenger aircraft charters, including the U.S. Military Air Mobility Command (AMC), brokers, freight forwarders, direct shippers, airlines, sports teams and fans, and private charter customers. The Dry Leasing segment includes leasing of aircraft and engines. The company was founded by Michael Chowdry in 1993 and is headquartered in Purchase, NY.
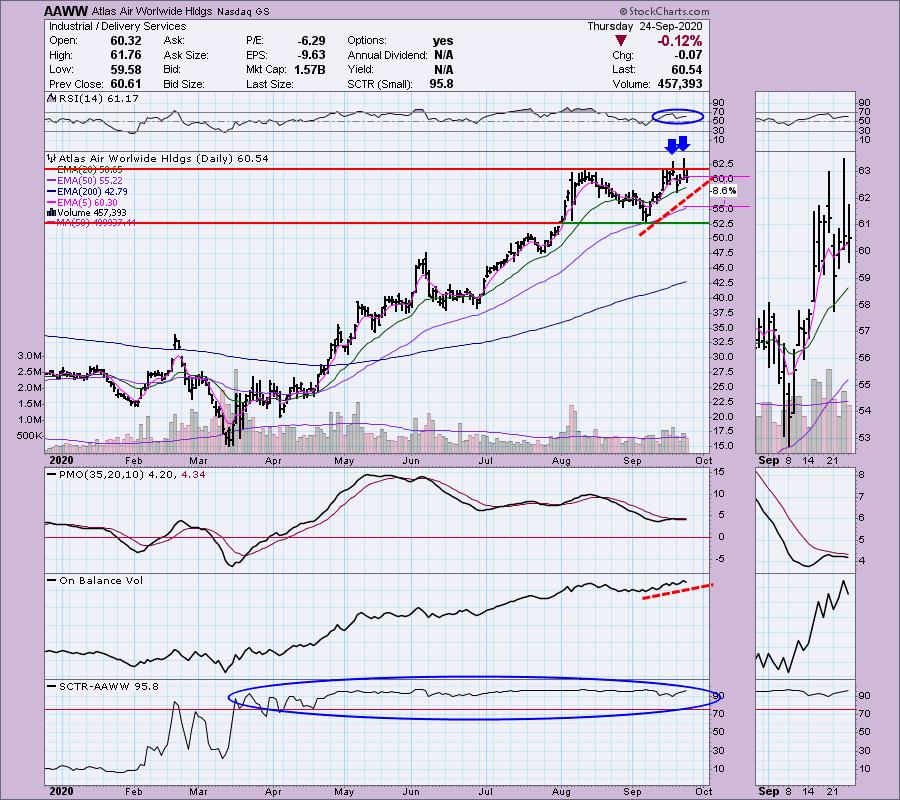
Down -0.07% so far in after hours trading, AAWW has a mixed chart. The good news is that it really hasn't broken down. It has been in a nice rising trend using the 50-EMA as support periodically. The PMO did top below the signal line and is still moving lower, but it is oversold and not accelerating downward. The RSI looks great and the OBV is confirming this short-term rising trend. The SCTR has remained strong for many months. A short-term worry could be the double-top that is forming. If price does break down here, it would form and intermediate-term double-top. The stop level is near the 50-EMA. We know that it likes to test that and move upward. If it fails at the 50-EMA, that would be the time to drop it.
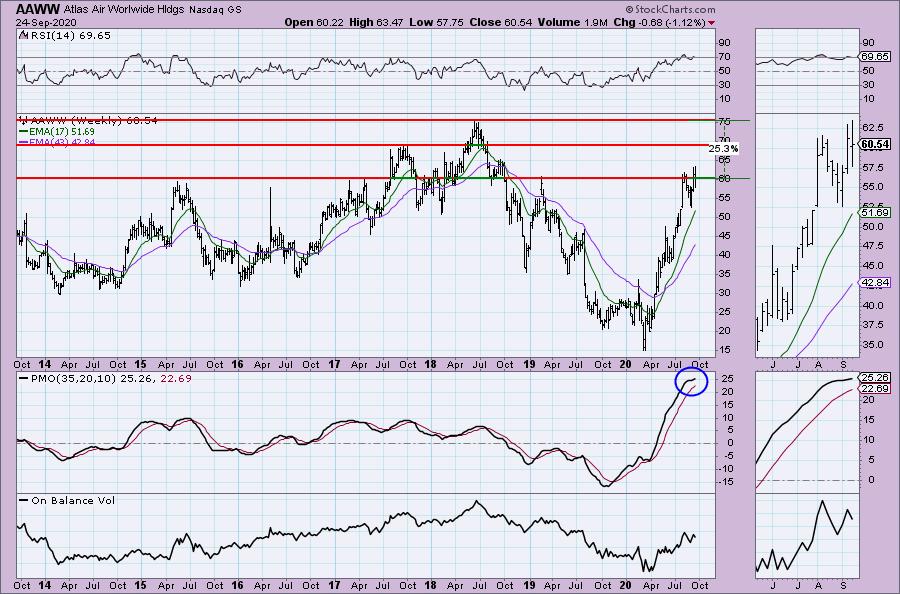
Pretty nice weekly chart with a PMO that is turning up. The OBV is confirming the longer-term rising trend with its own rising bottoms, but I have to say, I'm not liking the negative divergence in the thumbnail. With price breaking out above the 2019 top, it has enough bullish characteristics to continue higher...just watch the overbought RSI and PMO closely.
Boyd Gaming Corp. (BYD)
EARNINGS: 10/20/2020 (AMC)
Boyd Gaming Corp. engages in the management and operation of gaming and entertainment properties. It operates through the following segments: Las Vegas Locals, Downtown Las Vegas; and Midwest and South. The Las Vegas Locals segment consists of casinons that serve the resident population of the Las Vegas metropolitan area. The Downtown Las Vegas segment comprises of the following casinos: California Hotel and Casino, Fremont Hotel and Casino, and Main Street Station Casino, Brewery and Hotel. The Midwest &and South segment operates land-based casinos, dockside riverboat casinos, racinos, and barge-based casinos in the Midwest and southern United States. Its portfolio includes hotels, casino, breweries, resorts, and spa. The company was founded by William Samuel Boyd and Sam Boyd on January 1, 1975 and is headquartered in Las Vegas, NV.
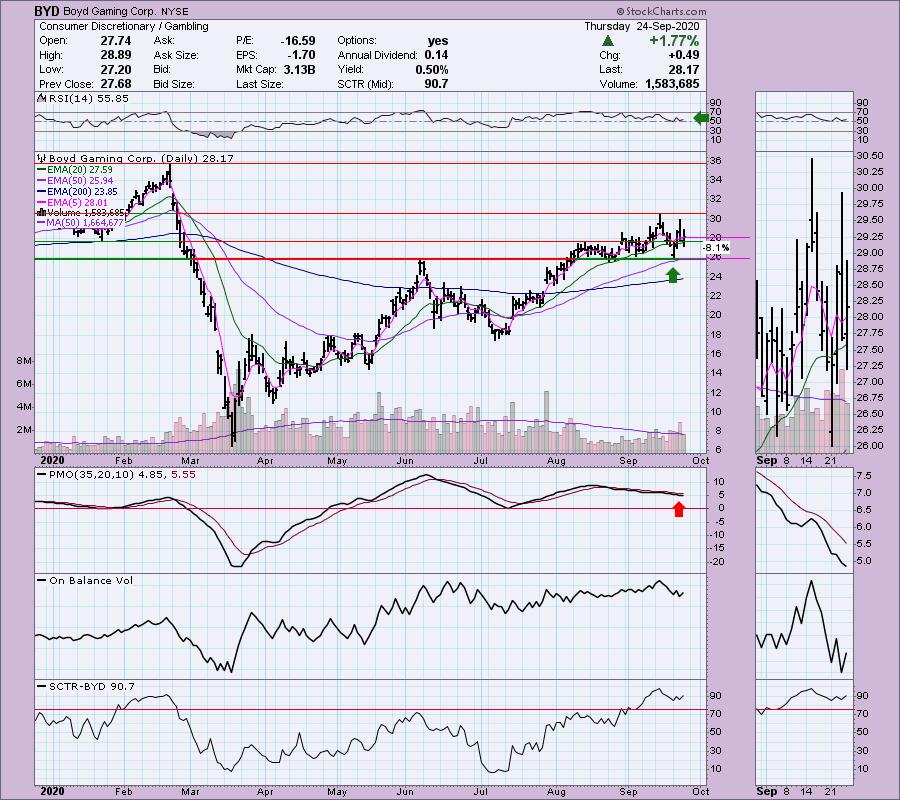
Currently BYD is up +0.71% in after hours trading. I like that it is holding support above the 50-EMA, but that short-term double-top could be a problem which is why I wouldn't keep it if it lost support at $26. The PMO suggests we will see a test of that support level before we see a breakout. The RSI is positive, but the OBV is confirming this short-term downtrend. The SCTR is very healthy though.
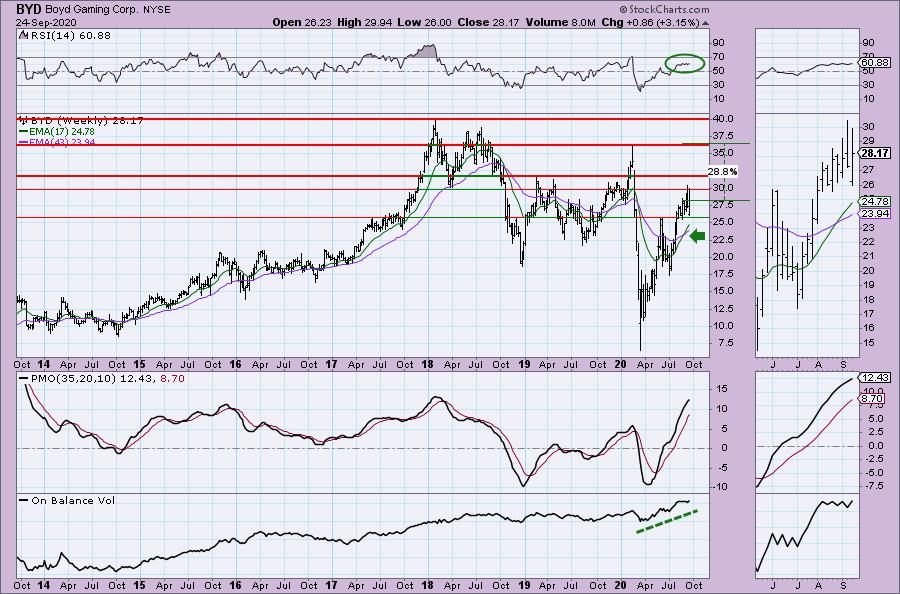
The weekly chart is quite bullish. All of the indicators are positive and not overbought.
Don't forget, on Thursdays I look at reader-requested symbols, so shoot me an email at erin@decisionpoint.com. I read every email I receive and try to answer them all!
Vail Resorts, Inc. (MTN)
EARNINGS: 6/4/2020 (AMC)
Vail Resorts, Inc. is a holding company, which engages in the operation of mountain resorts. It operates through the following segments: Mountain, Lodging, and Real Estate. The Mountain segment covers the operation of mountain resorts or ski areas, and related activities. The Lodging segment includes ownership of hotels, condominium management, Colorado resort ground transportation company, and mountain resort golf courses. The Real Estate segment holds real property at mountain resorts primarily throughout Summit and Eagle Counties in Colorado. The company was founded by Pete Seibert and Earl Eaton in March 1957 and is headquartered in Broomfield, CO.
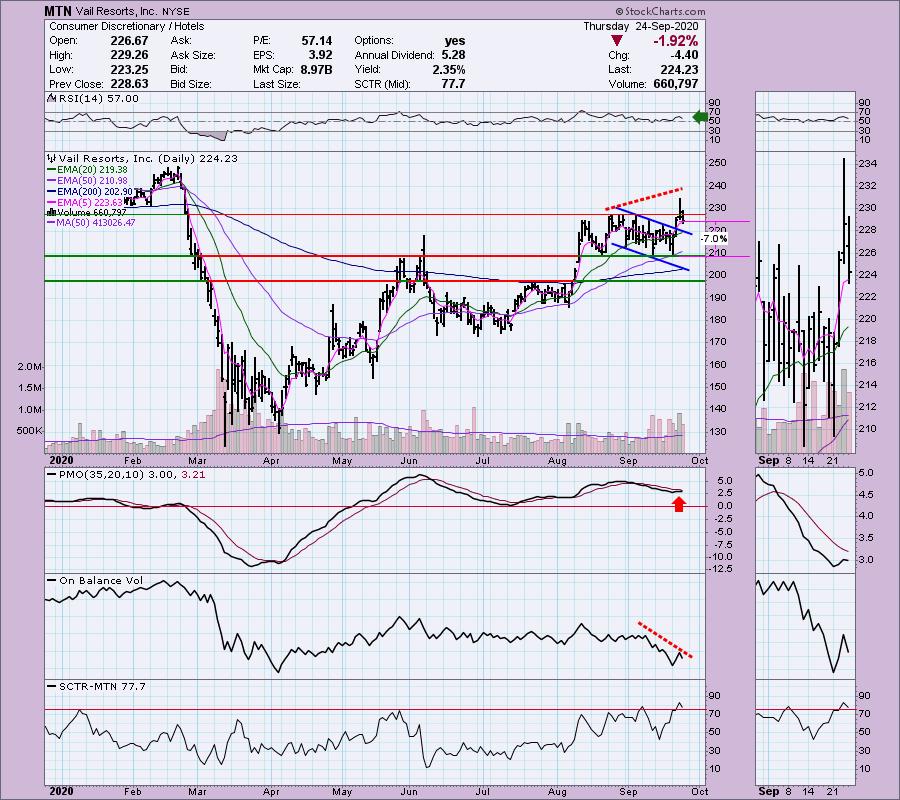
MTN reported earnings today but was down -1.92%. However, they reported after the market closed and currently it is up +1.24% in after hours trading. This one looked much better yesterday on the breakout above the September tops. The breakout from the declining trend channel is positive and it does remain above it. Unfortunately there are some problems. While the RSI is positive and the SCTR above 75, the PMO has turned down below its signal line (although a proper upside move tomorrow would negate that), and there is a negative OBV divergence on the breakout. Do you remember the "Pig's Ear" chart pattern I discussed last week? Well, I think you can make a case for that here with the fake out break out. It is a rectangular pattern area and those are reversal patterns. Be careful.
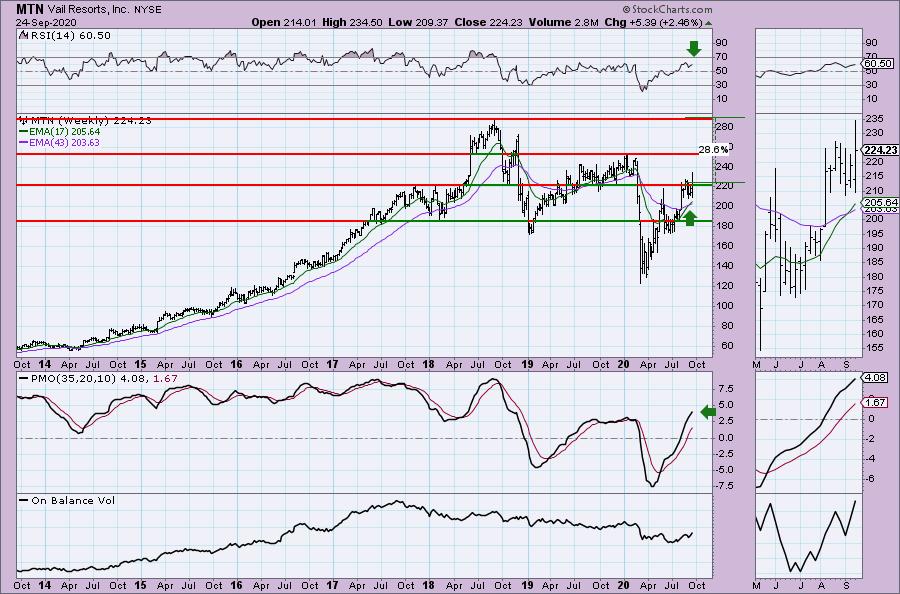
The weekly chart looks much better. The RSI is positive and we have a positive 17/43-week EMA crossover. I certainly like the PMO which is rising and not overbought. The OBV in the longer term is confirming the declining trend, but in the shorter term, we can see in the thumbnail that it is confirming with rising bottoms.
Natus Medical, Inc. (NTUS) - SHORT -
EARNINGS: 10/29/2020 (AMC)
Natus Medical, Inc. provides medical device solutions focuses on the diagnosis and treatment of central nervous and sensory system disorders for patients of all ages. Its products are used for the screening, diagnosis, detection, treatment, monitoring and tracking of common medical ailments in newborn care, hearing impairment, neurological dysfunction, sleep disorders, neuromuscular diseases and balance and mobility disorders. The company was founded by Maurizio Liverani, John Robert Camber Porter, William New, Jr., Brian Prinn and William W. Moore on May 26, 1987 and is headquartered in Pleasanton, CA.
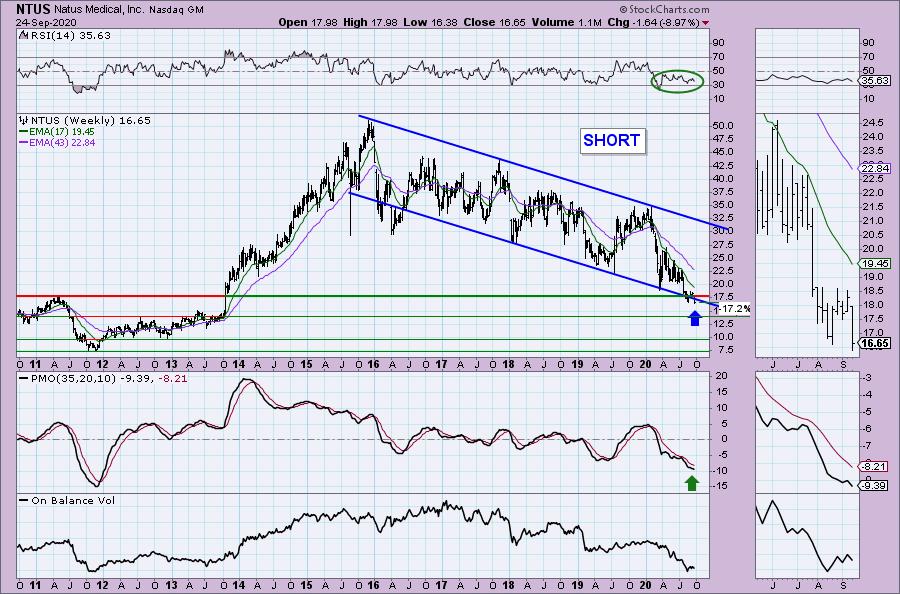
It's honestly fun to look for horrible charts. The PMO is nearing a SELL signal beneath the zero line. Price cannot even hold 5-EMA support. The RSI is negative and not really oversold yet. Price broke below support at the August low. The OBV is confirming the decline and the SCTR has been in the basement since the beginning of August. One thing that could be a problem is the rectangle which as I've noted can be a reversal pattern and with price this low, it isn't out of the question that we'd see a reversal. I wouldn't give it too much upside rope which is why I set the stop level around $18.
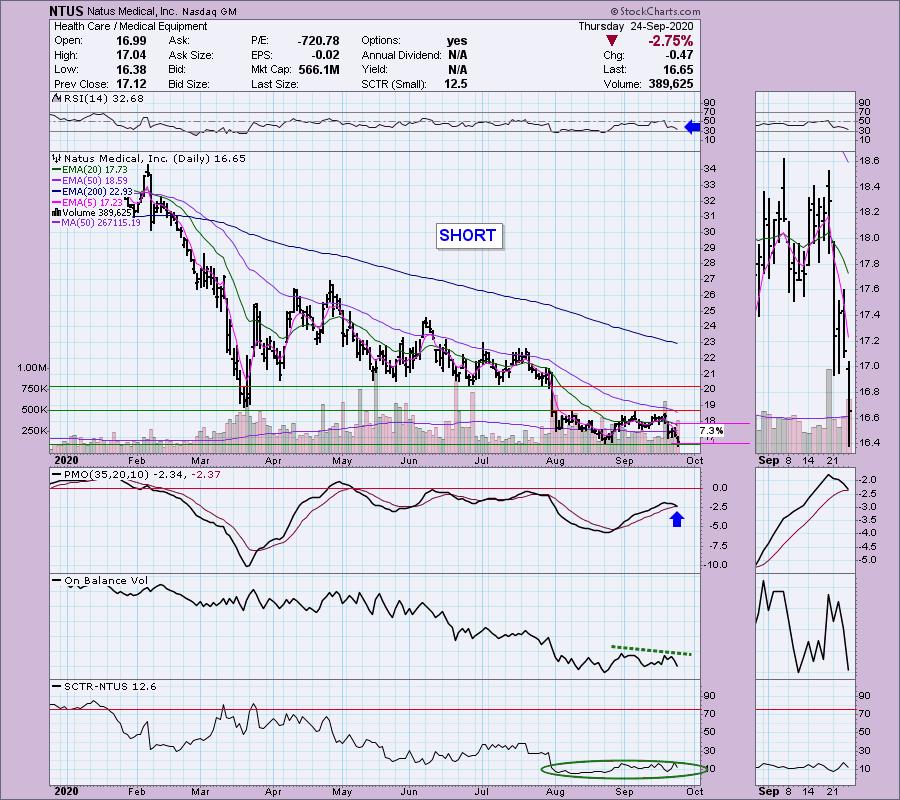
The weekly chart for a short looks great. The RSI has been oscillating in negative territory and isn't oversold. The weekly PMO just topped below its signal line. There is a very long-term declining trend channel and it appears that price, rather than bouncing, is breaking down out of the already bearish declining trend channel. Even if we could get it to drop to the 2012 top area, that would be a 17.2% gain, but if goes down that far, there is a good chance it could move even lower.
ProShares Short Real Estate (REK)
EARNINGS: N/A
REK provides inverse exposure to a market-cap weighted index of large US real estate companies, including REITs.
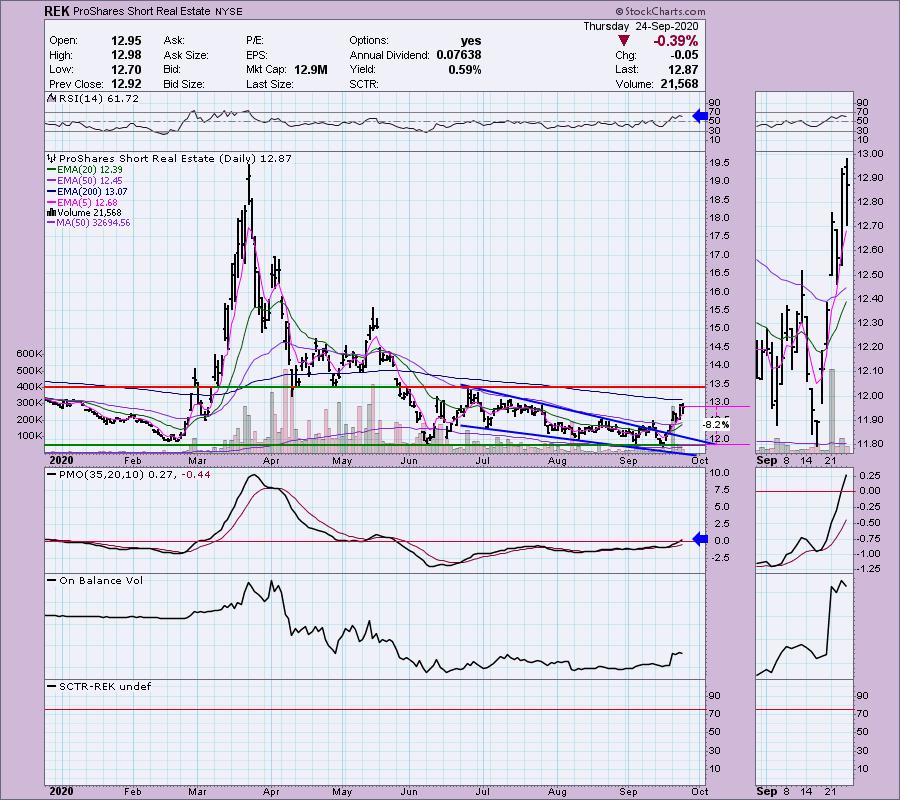
We already looked at XLRE and it did look quite bearish. Here we have a decisive breakout from a bullish falling wedge. The 20-EMA is nearing a positive crossover of the 50-EMA, what we call a "Silver Cross" IT Trend Model BUY signal. The PMO just moved into positive territory and the RSI is positive. Overhead resistance is looming at both the 200-EMA and $13.50 price level. I'm not convinced we will see a breakout above the June top, but given the nice pop in volume on this breakout, we could see REK do well. Just keep an eye on the XLRE chart in our Sector ChartList on the DecisionPoint.com website.
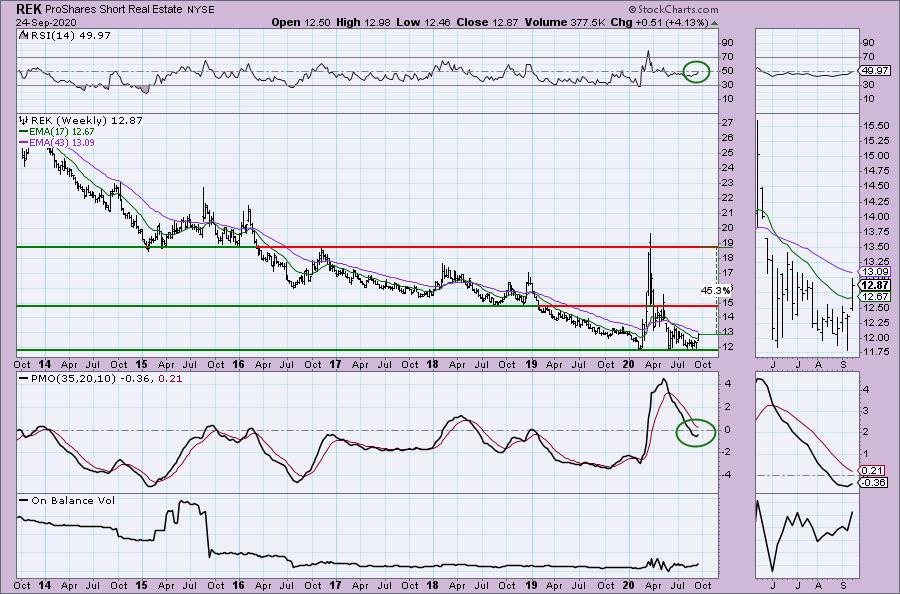
The weekly chart is enticing. The PMO is turning up just below the zero line. It has tested its lows from earlier this year and appears to be bouncing back with price above the 17-week EMA now. The RSI is very nearly positive. I don't think that we'll see a return to the 2020 high as it was an emotional spike during the bear market, but if the bottom falls out in real estate, it certainly could reach that level and higher.
Full Disclosure: I am not adding any new positions. I'm about 40% invested and 60% is in 'cash', meaning in money markets and readily available to trade with.
Current Market Outlook:
Market Environment: It is important to consider the odds for success by assessing the market tides. The following chart uses different methodologies for objectively showing the depth and trend of participation for intermediate- and long-term time frames.
- The Silver Cross Index (SCI) shows the percentage of SPX stocks on IT Trend Model BUY signals (20-EMA > 50-EMA)
- The Golden Cross Index (GCI) shows the percentage of SPX stocks on LT Trend Model BUY signals (50-EMA > 200-EMA)
- The Bullish Percent Index (BPI) shows the percentage of SPX stocks on Point & Figure BUY signals.
Don't forget that as a "Diamonds" member, you have access to our GCI/SCI curated ChartList on DecisionPoint.com. You'll find it under "Members Only" links on the left side on the Blogs and Links Page.
Here is the current chart:

Diamond Index:
- Diamond Scan Results: 5
- Diamond Dog Scan Results: 19
- Diamond Bull/Bear Ratio: 0.26
Technical Analysis is a windsock, not a crystal ball.
Happy Charting!
- Erin
erin@decisionpoint.com
Watch the latest episode of DecisionPoint with Carl & Erin Swenlin on Mondays 7:00p EST or on the DecisionPoint playlist on the StockCharts TV YouTube channel here!
NOTE: The stocks reported herein are from mechanical trading model scans that are based upon moving average relationships, momentum and volume. DecisionPoint analysis is then applied to get five selections from the scans. The selections given should prompt readers to do a chart review using their own analysis process. This letter is not a call for a specific action to buy, sell or short any of the stocks provided. There are NO sure things or guaranteed returns on the daily selection of "diamonds in the rough."
Helpful DecisionPoint Links:
DecisionPoint Shared ChartList and DecisionPoint Chart Gallery
Price Momentum Oscillator (PMO)
Swenlin Trading Oscillators (STO-B and STO-V)
For more links, go to DecisionPoint.com!