
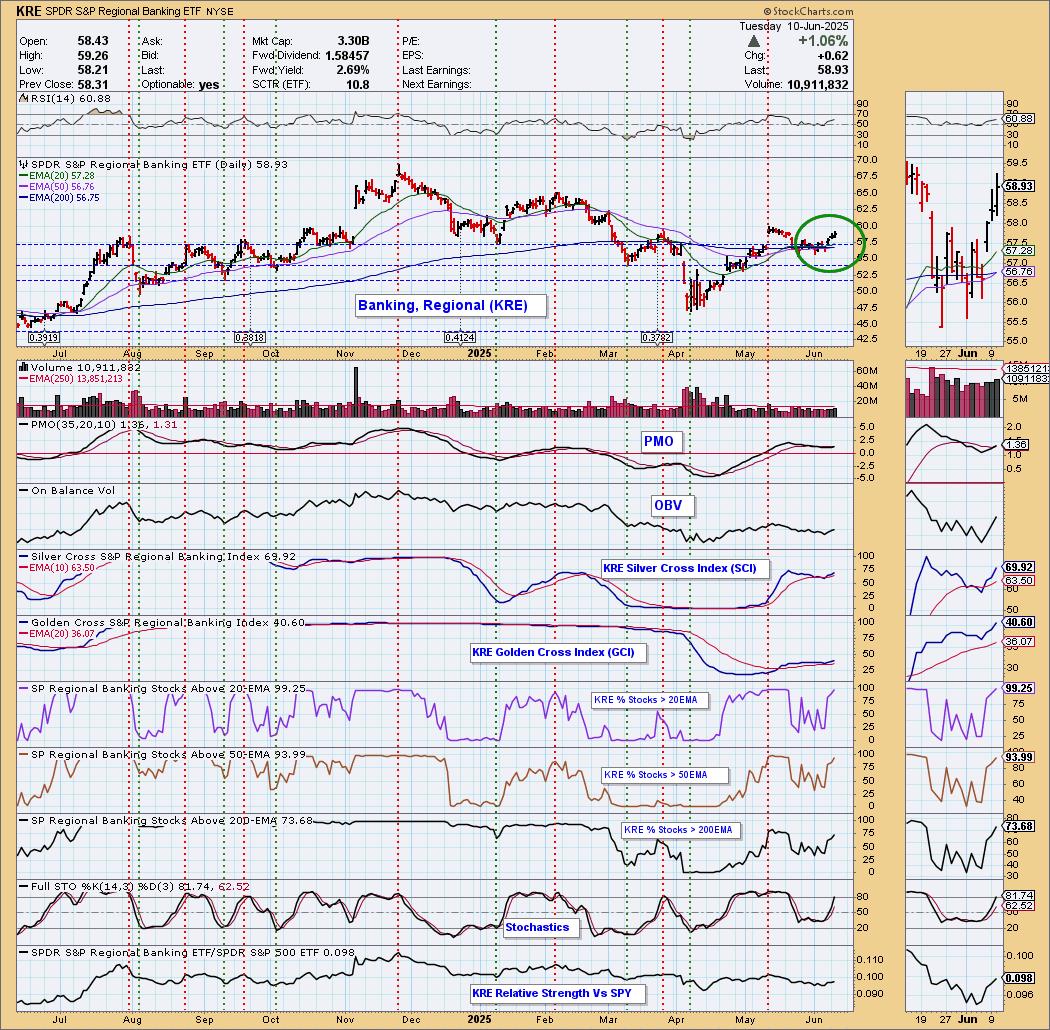
Today the Regional Banking ETF (KRE) 50-day EMA crossed up through the 200-day EMA (Golden Cross), generating an LT Trend Model BUY Signal. We do see a bullish flag formation and price is above key moving averages. The PMO has just given us a new Crossover BUY Signal and participation is very high. Stochastics are above 80 now. One thing to consider is that participation is about as good as it can get and while the rally looks good, it could be about the time that it will soon turn lower. Apply caution.
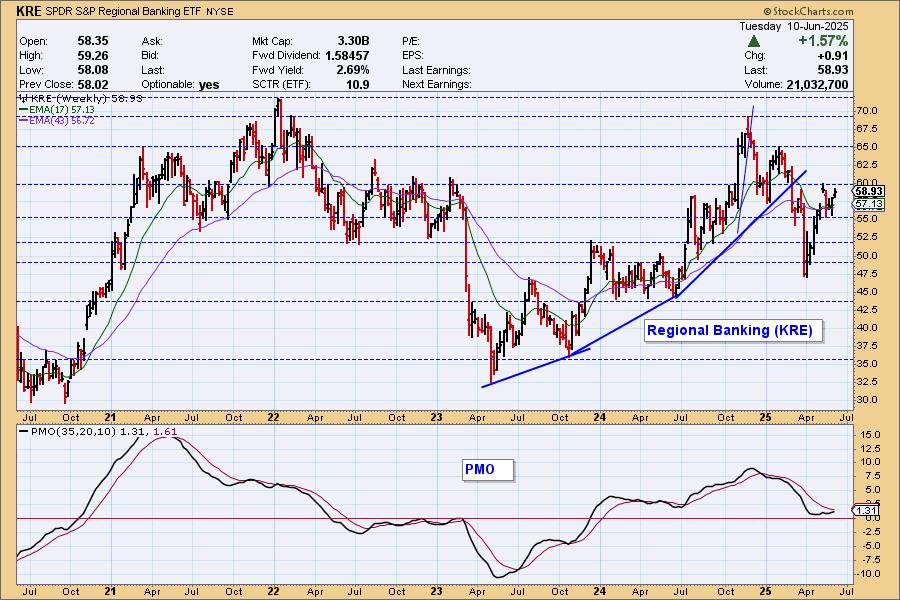
We have a bullish "V" Bottom on the weekly chart that also resembles a reverse head and shoulders. The weekly PMO is on its way up so it does seem to suggest we'll see price move higher from here.
The DecisionPoint Alert Weekly Wrap presents an end-of-week assessment of the trend and condition of the Stock Market, the U.S. Dollar, Gold, Crude Oil, and Bonds. The DecisionPoint Alert daily report (Monday through Thursday) is abbreviated and gives updates on the Weekly Wrap assessments.
MARKET/INDUSTRY GROUP/SECTOR INDEXES
CLICK HERE for Carl's annotated Market Index, Sector, and Industry Group charts.
THE MARKET (S&P 500)
IT Trend Model: NEUTRAL as of 3/4/2025
LT Trend Model: SELL as of 4/16/2025
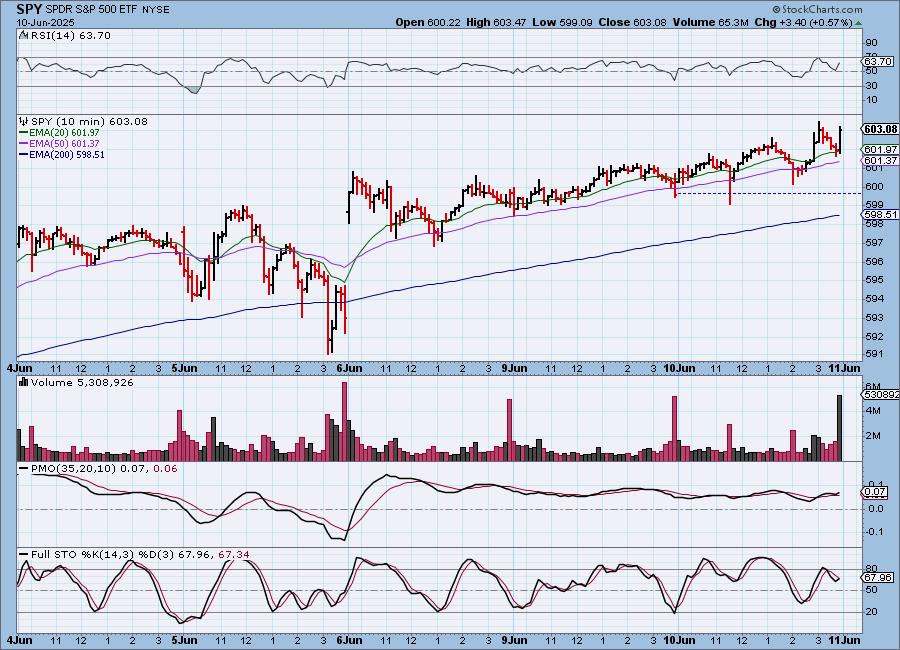
SPY 10-Minute Chart: It was a solid rally day with price in a rising trend and a close near the highs. The 10-minute PMO has turned up above its signal line which is especially bullish.
SPY Daily Chart: Price continues to move higher in a gentle rising trend. The RSI is not overbought so we could see higher prices from here without the index getting too overbought. The PMO is rising and is flat above the signal line which implies pure strength.
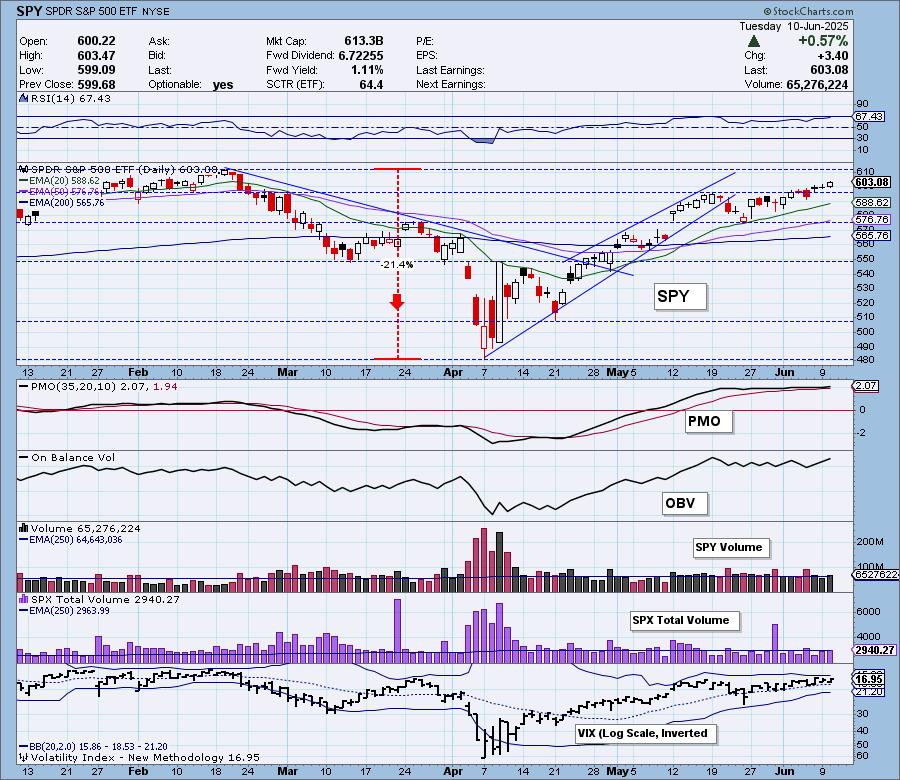
The VIX is still above its moving average on the inverted scale but the Bollinger Bands have shrunk so we could get a puncture in either direction should volatility be injected back into the market. Stochastics look very bullish as they rise vertically above 80.
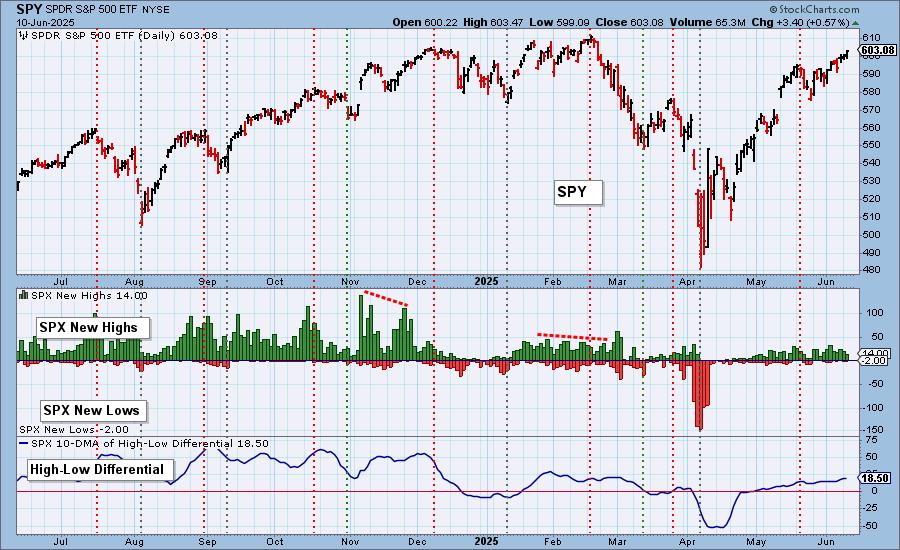
S&P 500 New 52-Week Highs/Lows: New Highs are in a declining trend and that sets up a short-term negative divergence. The High-Low Differential is still on the rise for now, but we don't like this negative divergence.
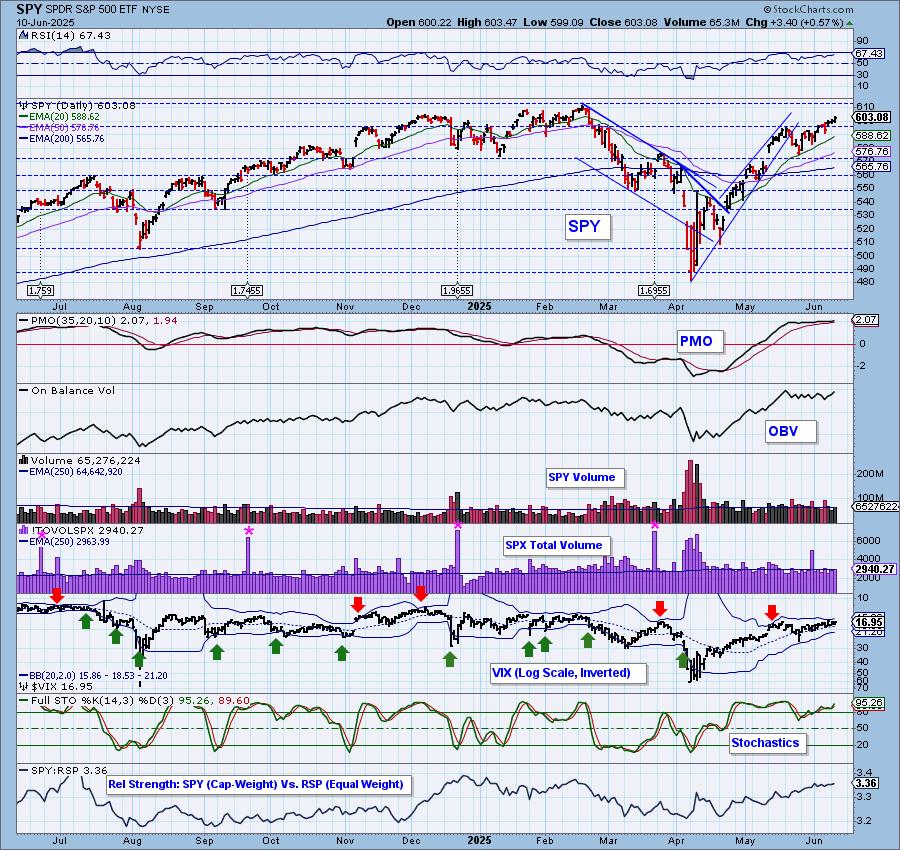
Climax* Analysis: There were two climax readings on the four relevant indicators today, giving us an upside exhaustion climax. Total Volume was on average so not a huge amount of conviction attached to this rally.
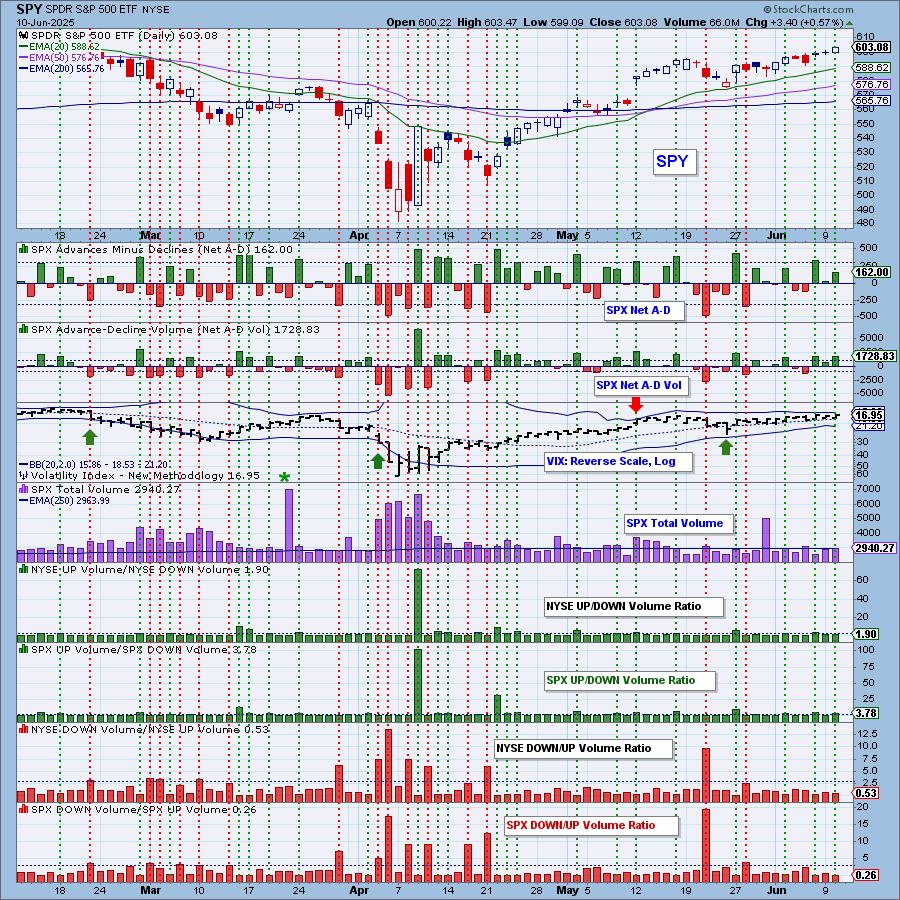
*A climax is a one-day event when market action generates very high readings in, primarily, breadth and volume indicators. We also include the VIX, watching for it to penetrate outside the Bollinger Band envelope. The vertical dotted lines mark climax days -- red for downside climaxes, and green for upside. Climaxes are at their core exhaustion events; however, at price pivots they may be initiating a change of trend.
Short-Term Market Indicators: The short-term market trend is UP and the condition is NEUTRAL.
The Swenlin Trading Oscillators (STOs) continue to rise although the STO-B barely inched upward. Negative divergences are still in play. Participation is healthy at 72% and it did see slight expansion on the rally. We have over 50% with rising PMOs, but given the rally we've been in, that number should be much higher.
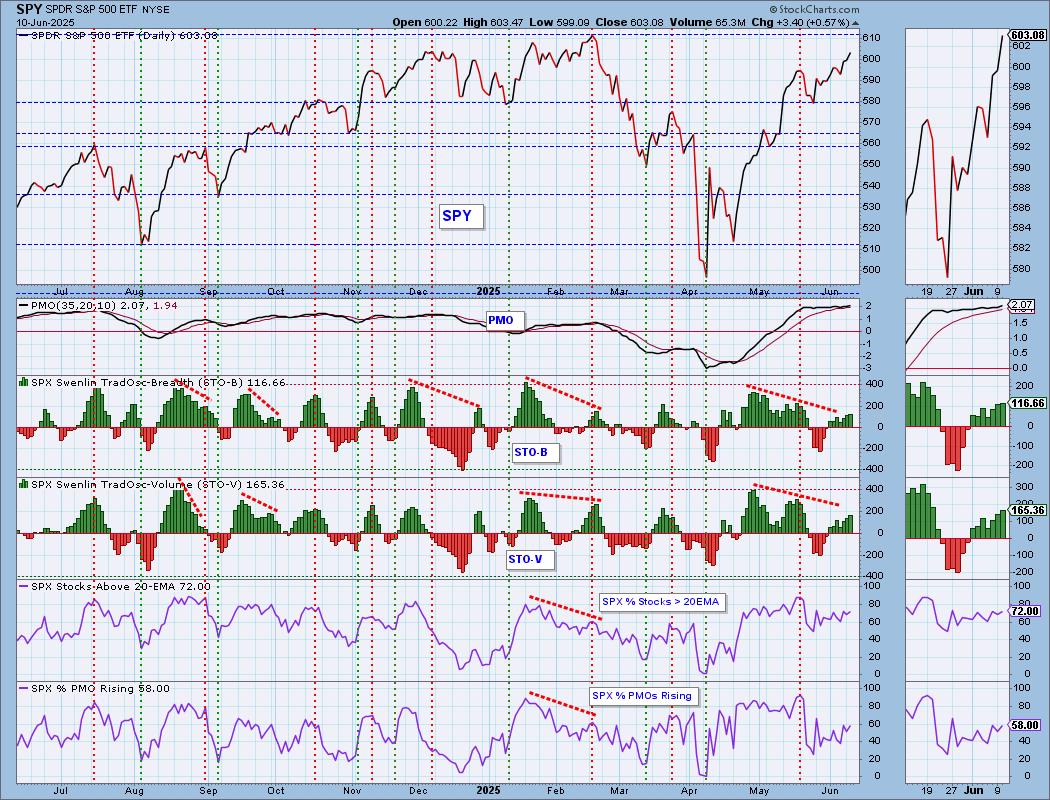
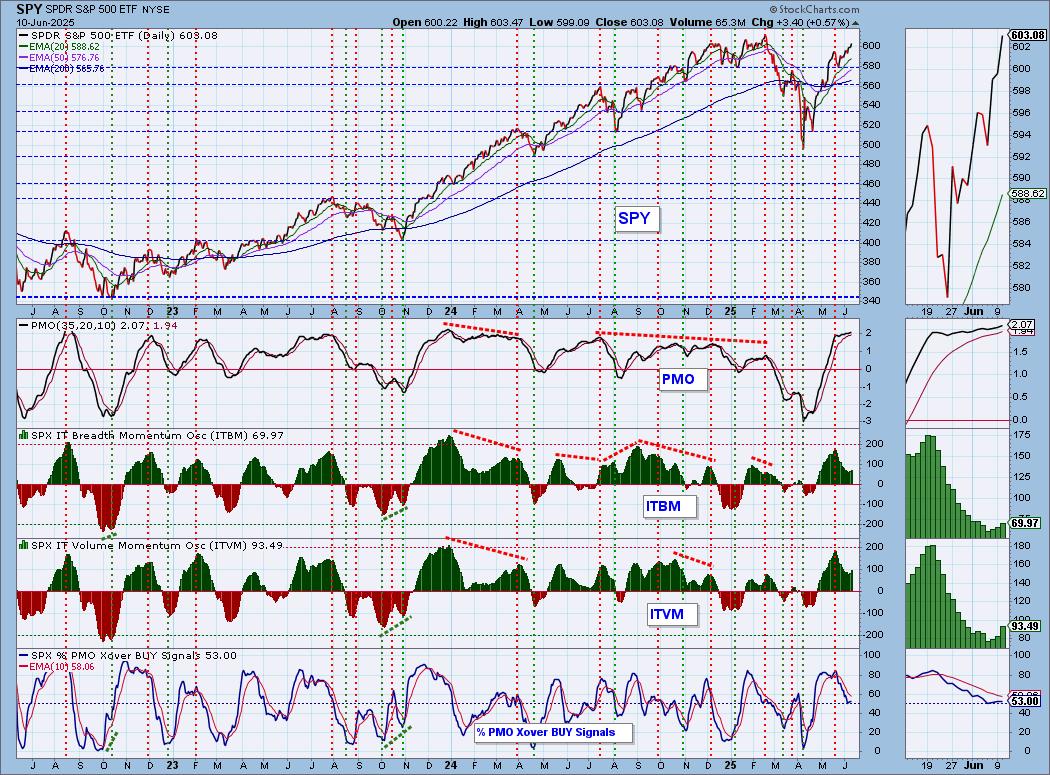
Intermediate-Term Market Indicators: The intermediate-term market trend is UP and the condition is NEUTRAL.
The ITBM and ITVM look quite bullish as they continue to make there way higher. We didn't see any new Crossover BUY Signals, but conversely we didn't lose any either. This number should also be much higher given the rally so we would say that it isn't that broad right now.
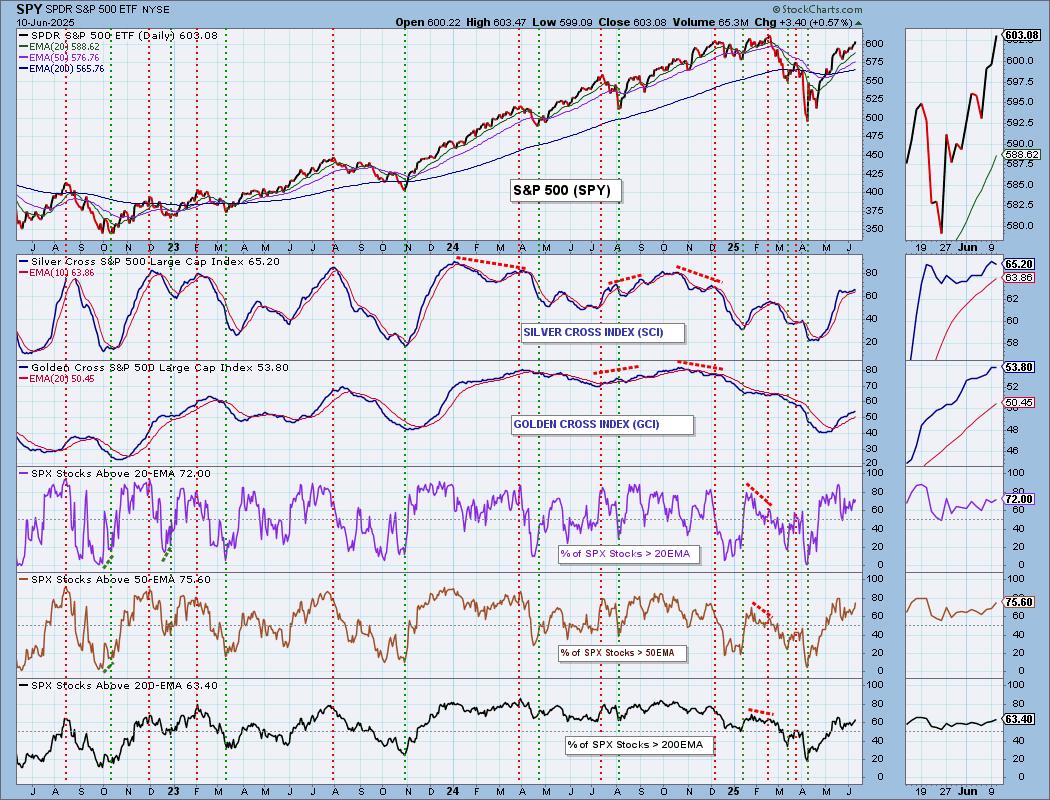
PARTICIPATION CHART (S&P 500): The following chart objectively shows the depth and trend of participation for the SPX in two time frames.
- Intermediate-Term - the Silver Cross Index (SCI) shows the percentage of SPX stocks on IT Trend Model BUY signals (20-EMA > 50-EMA). The opposite of the Silver Cross is a "Dark Cross" -- those stocks are, at the very least, in a correction.
- Long-Term - the Golden Cross Index (GCI) shows the percentage of SPX stocks on LT Trend Model BUY signals (50-EMA > 200-EMA). The opposite of a Golden Cross is the "Death Cross" -- those stocks are in a bear market.
The market bias is BULLISH in the intermediate and long terms.
Participation crept higher today and is now showing new rising trends for stocks above key moving averages. Readings are at a good level. Unfortunately, today the Silver Cross Index topped today. It isn't likely to move much lower however given we do have more stocks above their 20/50-day EMAs than those with Silver Crosses. The Golden Cross Index held its same value today. It should get back to rising given we have more stocks above their 50/200-day EMAs than Golden Crosses. Both the Silver Cross Index and Golden Cross Index are above their signal lines so the IT and LT Biases are BULLISH.
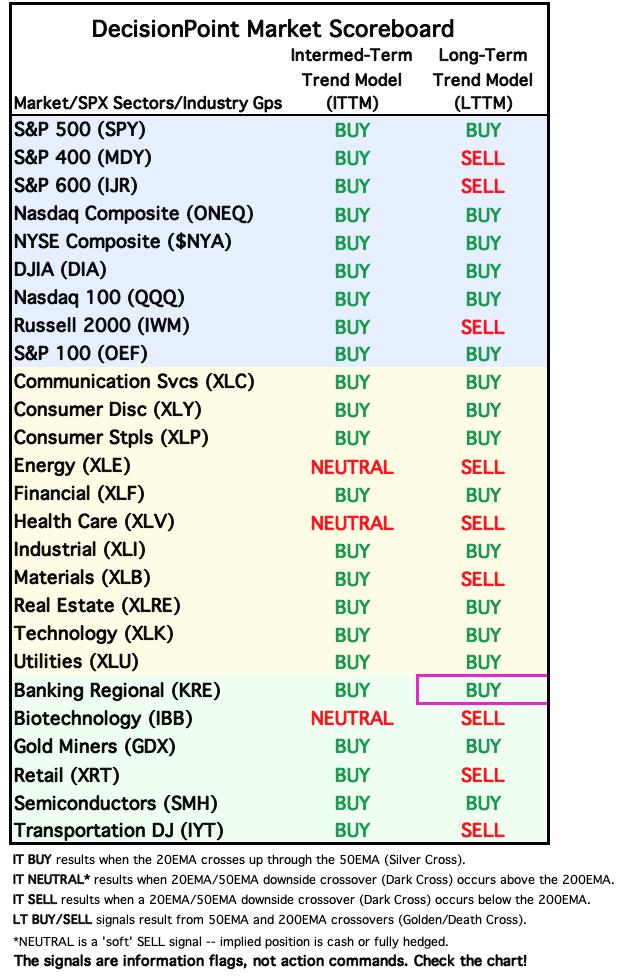
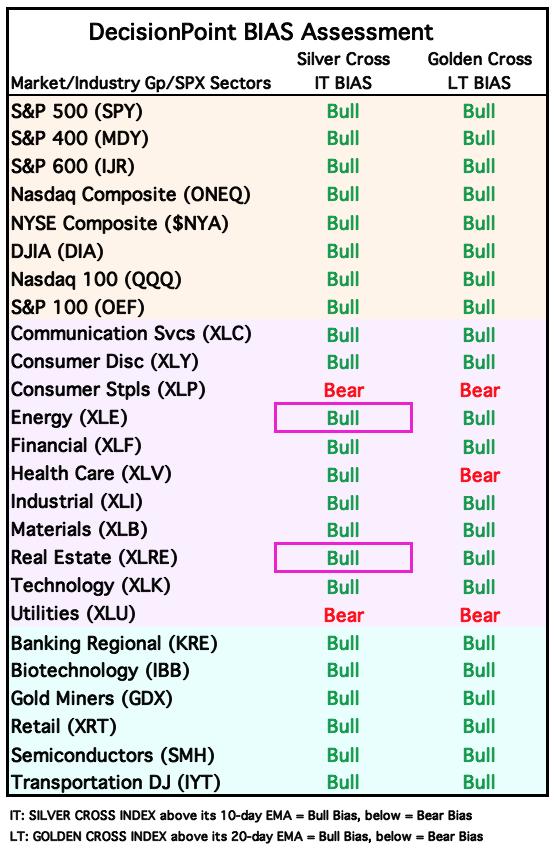
BIAS Assessment: The following table expresses the current BIAS of various price indexes based upon the relationship of the Silver Cross Index to its 10-day EMA (intermediate-term), and of the Golden Cross Index to its 20-day EMA (long-term). When the Index is above the EMA it is bullish, and it is bearish when the Index is below the EMA. The BIAS does not imply that any particular action should be taken. It is information to be used in the decision process.
The items with highlighted borders indicate that the BIAS changed today.
*****************************************************************************************************
CONCLUSION: Apparently trade talks with China are somewhat productive, but they have more to hammer out. Should a deal materialize, the market will likely rally strongly. We are on the lookout. Participation is healthy and the STOs/ITBM/ITVM are all moving higher. We would point to the positive bias table above. It is about as good as it can get and remember when things are as good as they can get, it is vulnerable to a reversal. We think the market is still vulnerable especially given today upside exhaustion climax. However, the market just keeps inching its way higher. At this point we should be able to let it ride and adjust stops to account for a possible trend reversal.
Erin is 60% long, 0% short. (This is intended as information, not a recommendation.)
*****************************************************************************************************
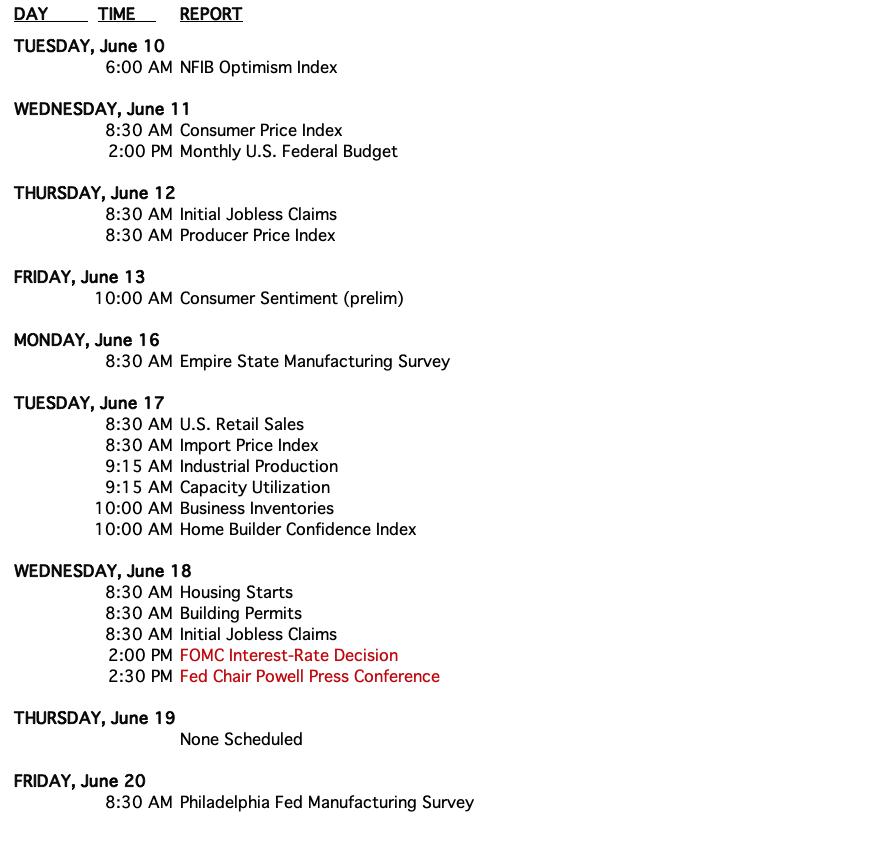
CALENDAR
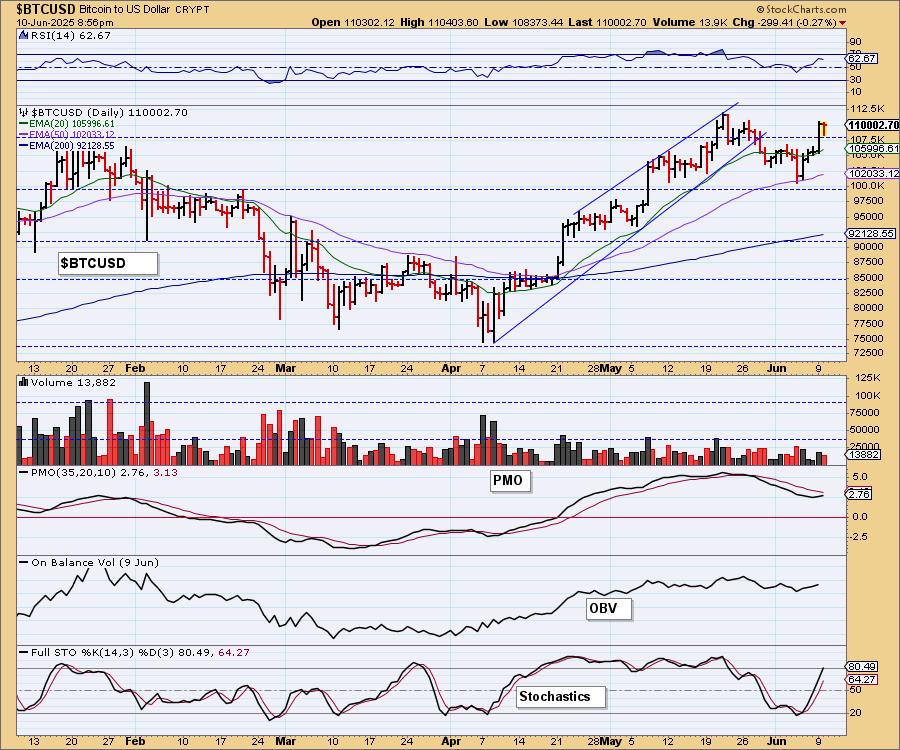
BITCOIN
Bitcoin paused its rally today as it sets itself up for a move to all-time highs. We have a clear bull flag formation on the chart and a breakout that implies more upside ahead. The flag would suggest we'll see much higher prices. The PMO is back on the rise and Stochastics pushed past 80 today. We like Bitcoin.
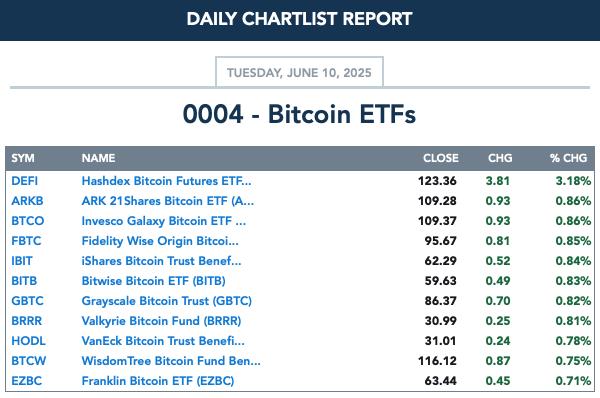
BITCOIN ETFs
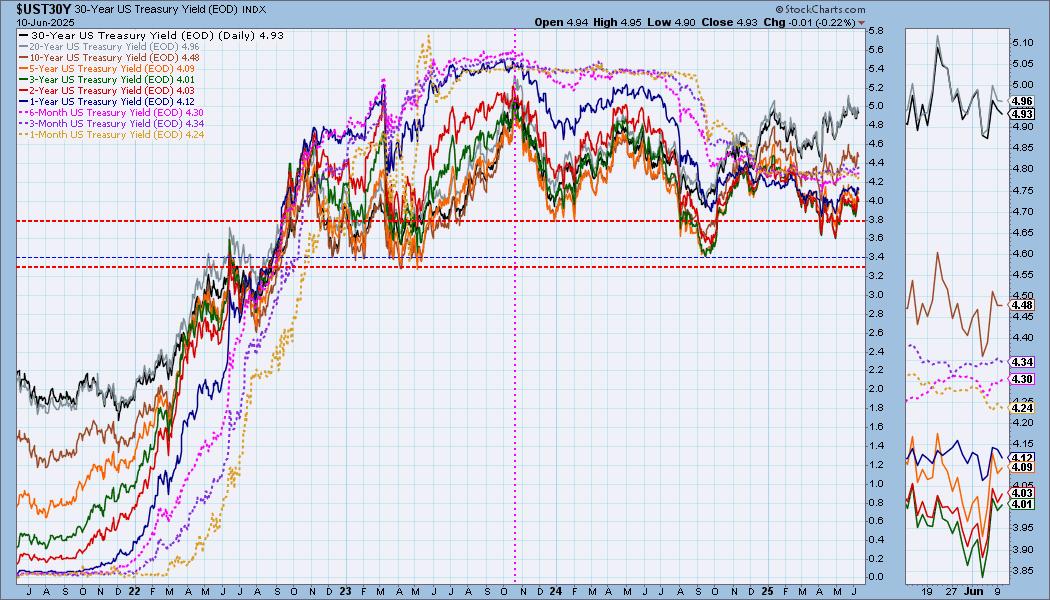
INTEREST RATES
Yields were lower on the day for the most part. We still think long-term yields are likely to rise from here while the others are likely to remain in consolidation patterns.
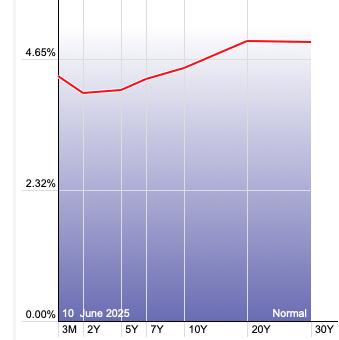
The Yield Curve Chart from StockCharts.com shows us the inversions taking place. The red line should move higher from left to right. Inversions are occurring where it moves downward.
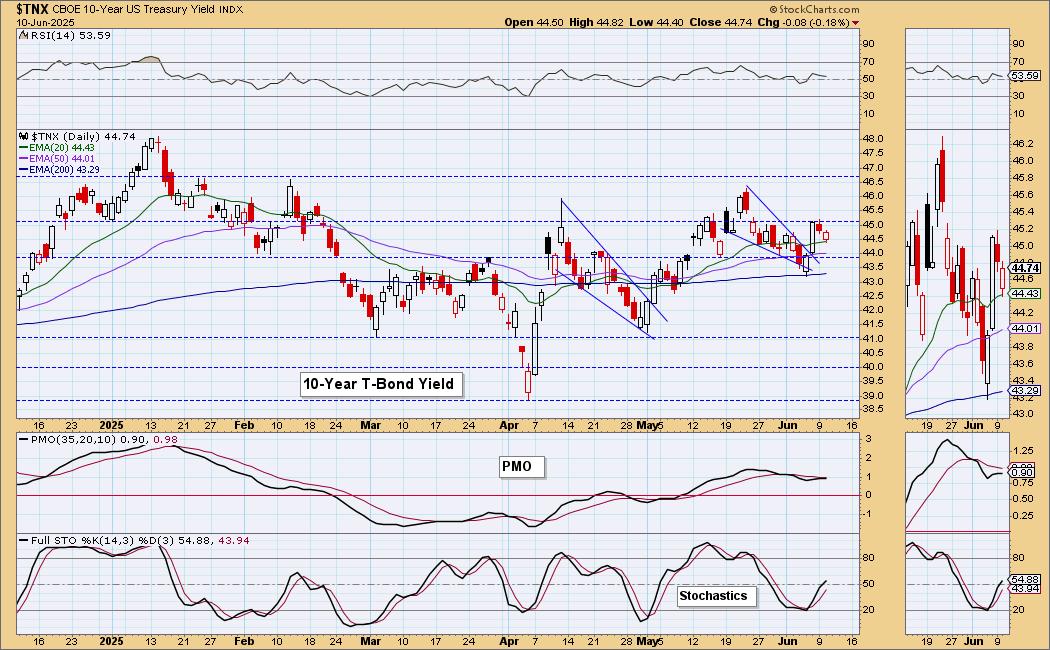
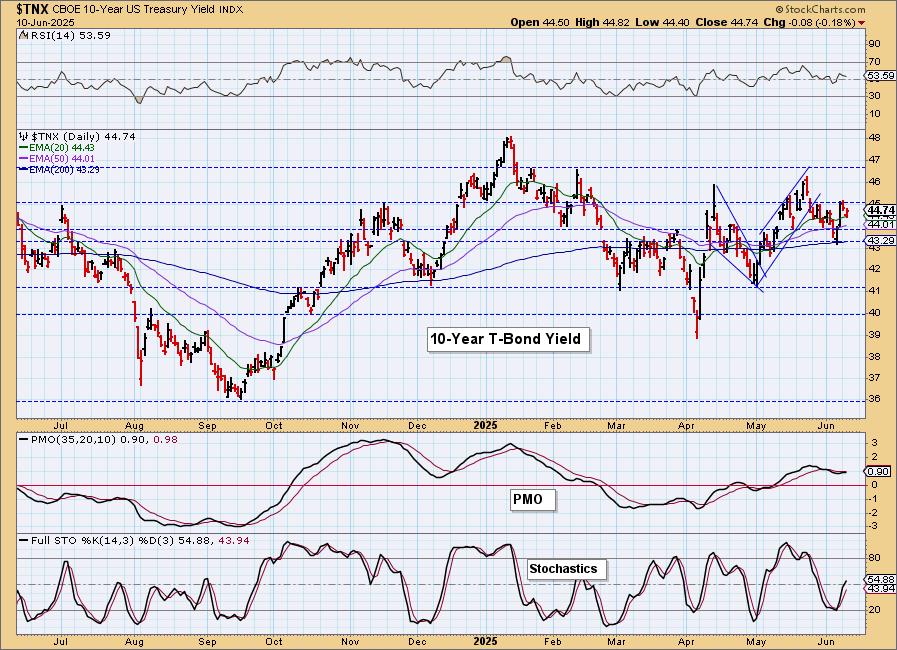
10-YEAR T-BOND YIELD
$TNX is pulling back after its breakout from the bullish falling wedge. This has caused the PMO to flatten out below the zero line. It does look vulnerable to decline, however, Stochastics still look bullish. Ultimately we have a rising trend out of the April low and we expect that to hold up.
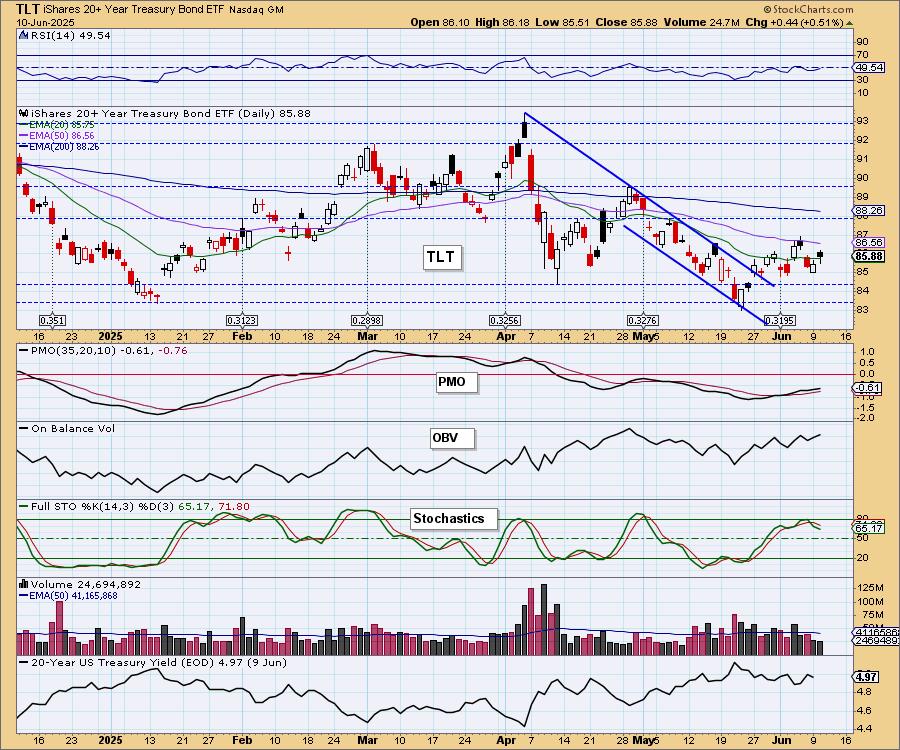
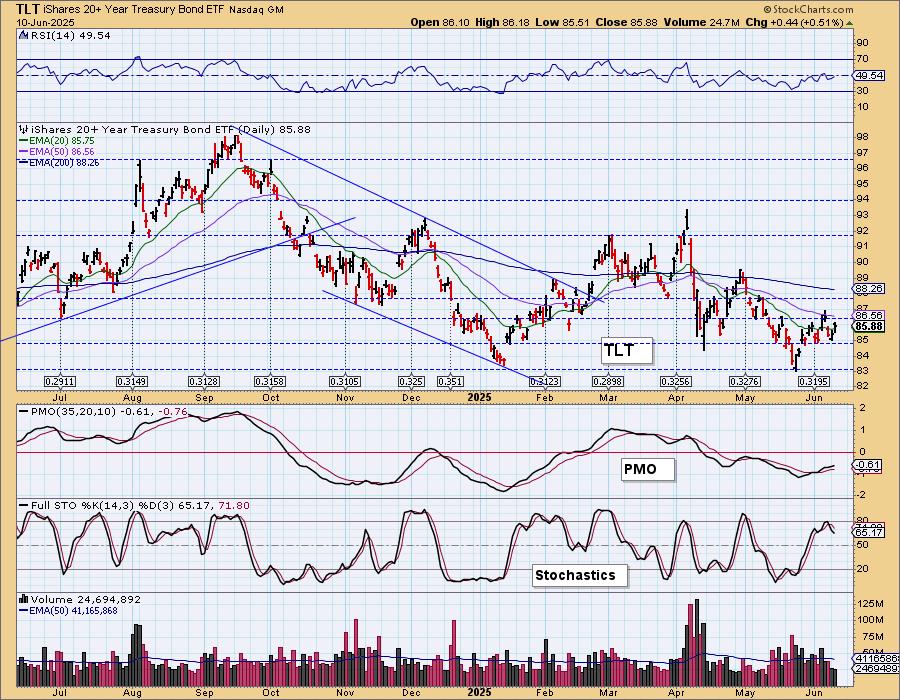
BONDS (TLT)
IT Trend Model: SELL as of 4/14/2025
LT Trend Model: SELL as of 12/13/2024
TLT Daily Chart: Bonds managed a rally on declining yields. It was a decent rally on TLT but it did form a bearish filled black candlestick that would imply a decline tomorrow. We don't expect Bonds to do much as yields slowly inch back up. The PMO is still below the zero line so even though it is rising, it isn't necessarily a sign of strength.
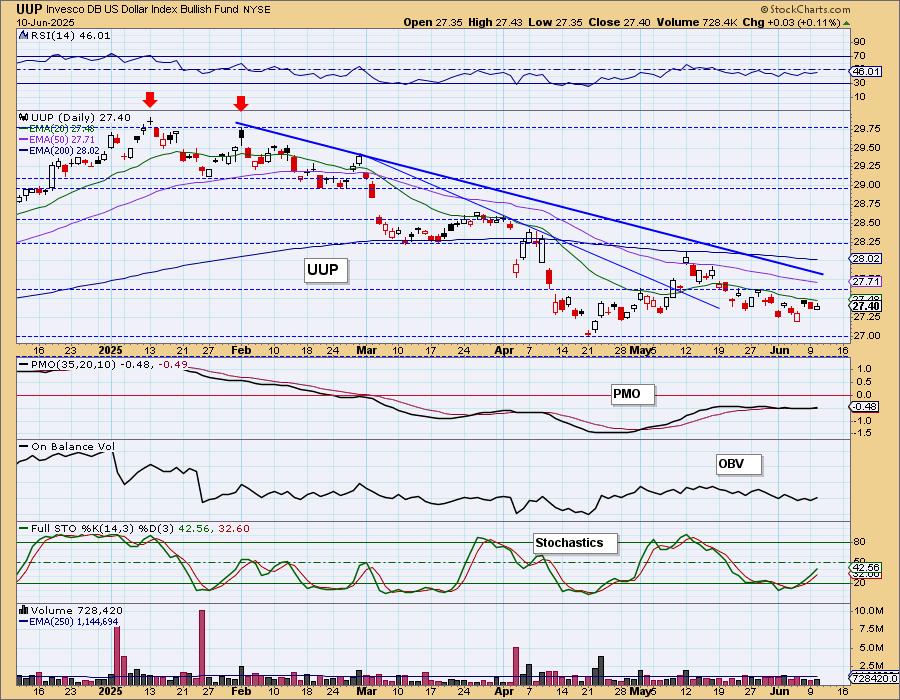
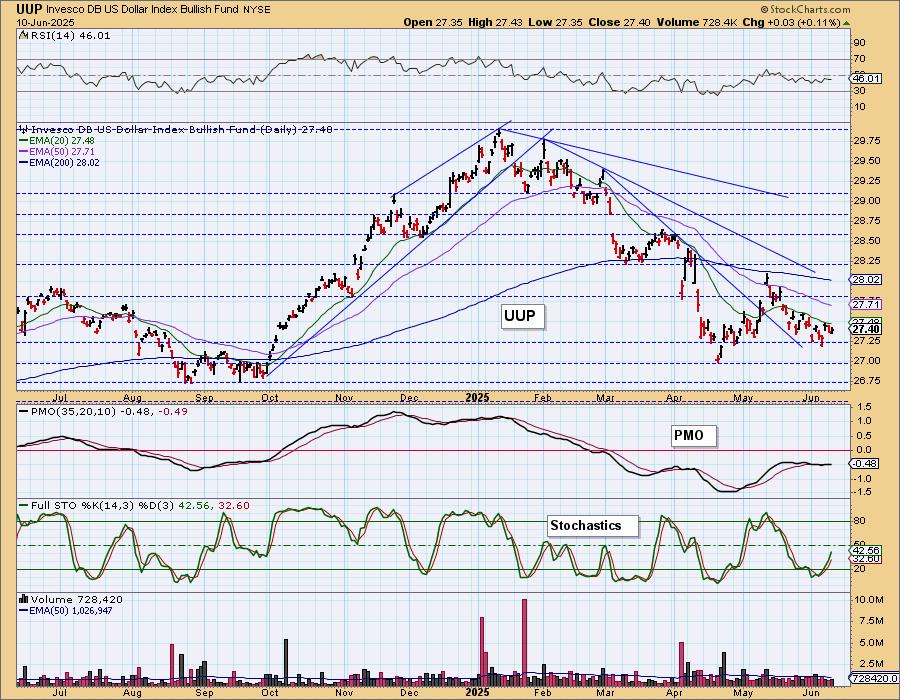
DOLLAR (UUP)
IT Trend Model: NEUTRAL as of 3/5/2025
LT Trend Model: SELL as of 4/25/2025
UUP Daily Chart: Yesterday's comments still apply:
"The Dollar remains in a short-term declining trend, but also a longer-term declining trend. The PMO is flat beneath the zero line indicating pure weakness. The RSI is negative. Stochastics may be rising, but we see more downside for the Dollar ahead. Someone mentioned a possible bullish cup with handle pattern, but we see the 'handle' being too long on the pattern."
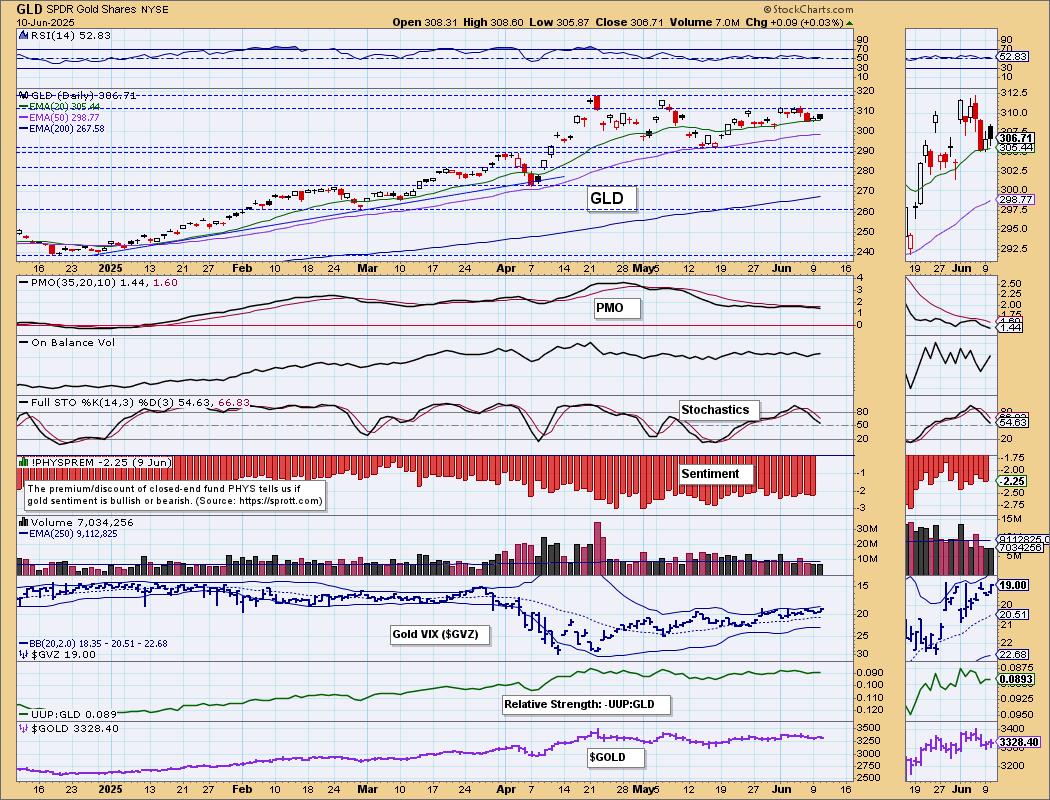
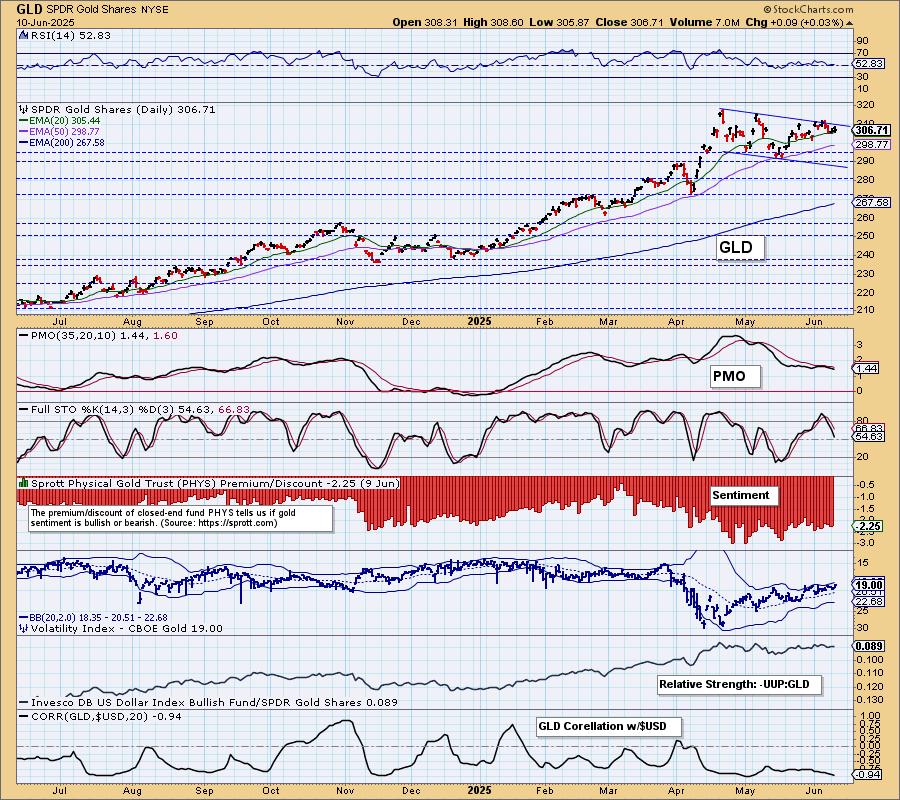
GOLD
IT Trend Model: BUY as of 1/10/2025
LT Trend Model: BUY as of 10/20/2023
GLD Daily Chart: Gold finished mostly unchanged today. It still holds a short-term rising trend, but the PMO is in decline. However, the PMO is also flat above the zero line and that usually means pure strength. We still like Gold but given the decline in Stochastics, it may consolidate sideways a bit longer.
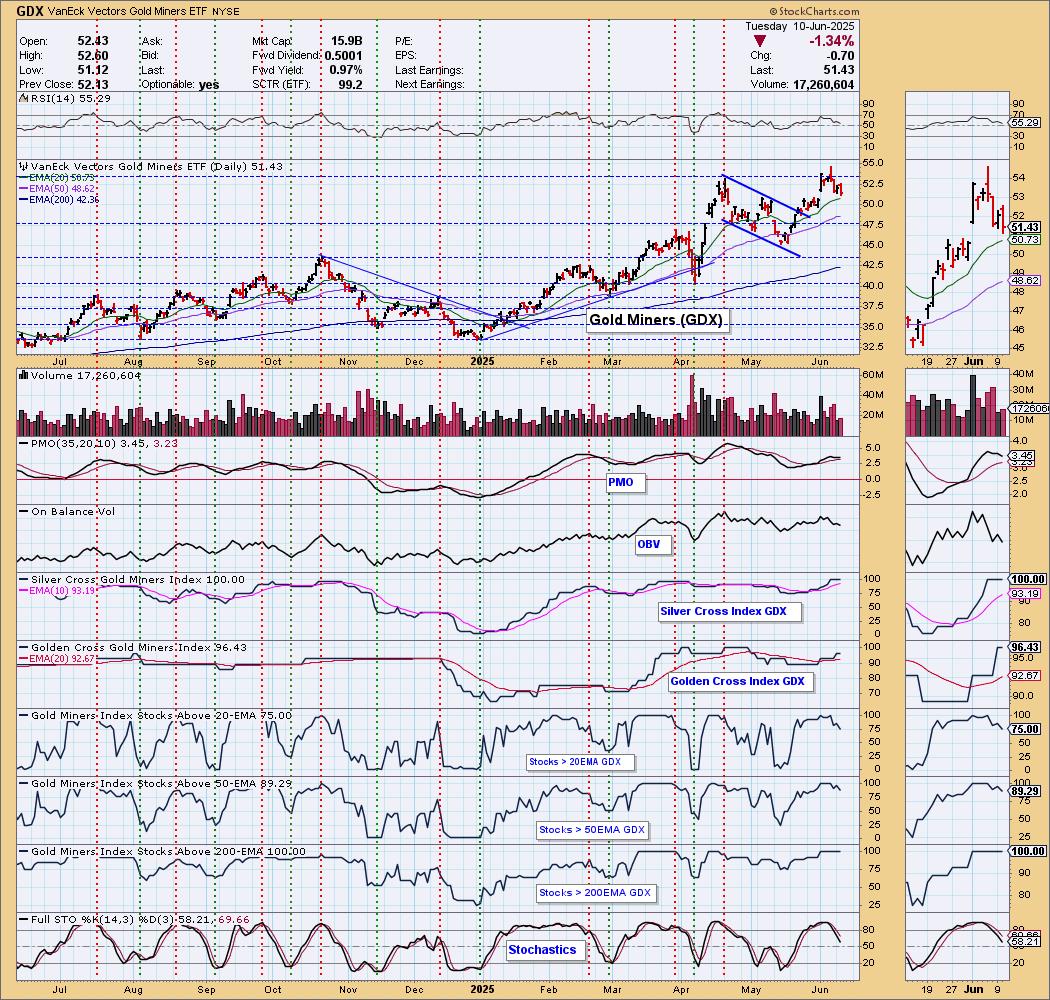
GOLD MINERS (GDX) Daily Chart: Gold Miners are pulling back as Gold loses some internal strength. We see a topping PMO and participation beginning to wane. It may be time for a move back down to the 50-day EMA. We still see a weak Dollar so it isn't out of the question that we'll see GDX right the ship again.
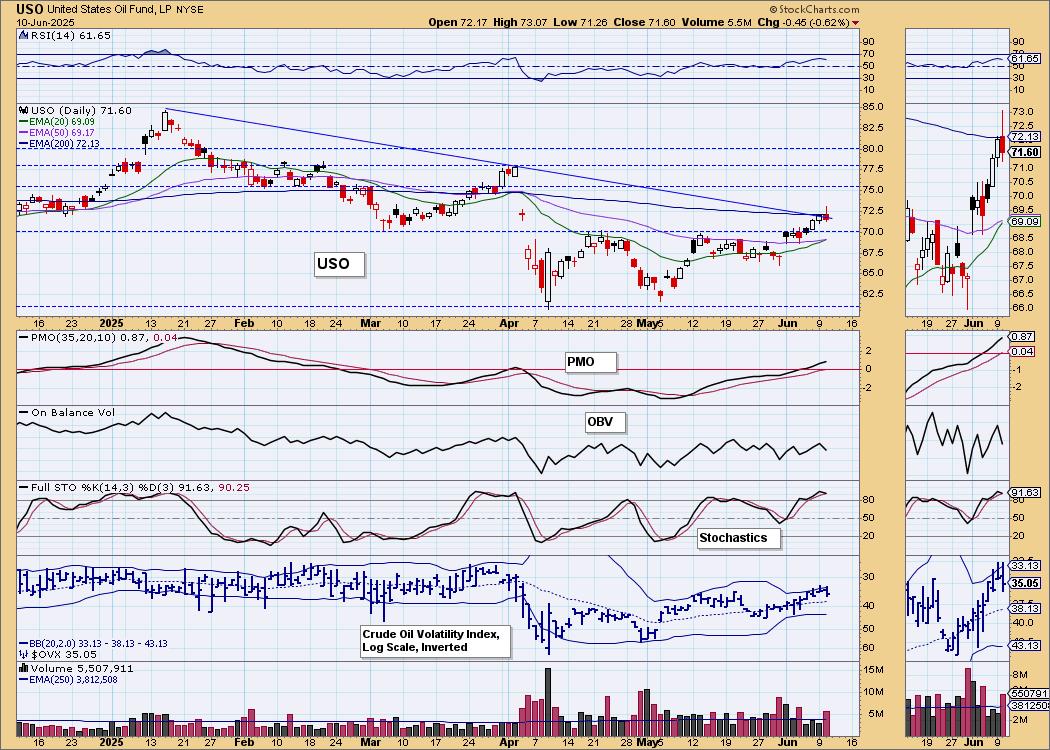
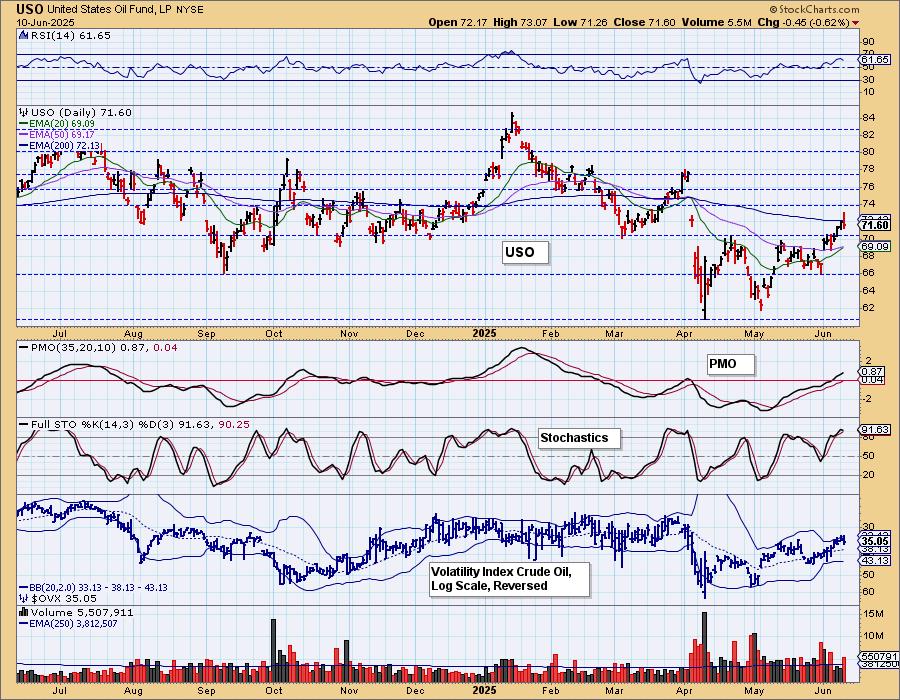
CRUDE OIL (USO)
IT Trend Model: NEUTRAL as of 2/27/2025
LT Trend Model: SELL as of 3/18/2025
USO Daily Chart: Crude Oil hit overhead resistance at the 200-day EMA and declining tops trendline and stalled. At the same time we did see price break above this area of resistance briefly today so there is a good chance we'll see a breakout here. The PMO is now rising above the zero line and Stochastics are holding above 80. We have a new Silver Cross of the 20/50-day EMAs on the way. This is the best it has looked in some time, but we do have to wonder how far it will rally given the administration's push to bring prices down. For now, we'll consider a possible upswing in demand coming this summer which could push price higher from here.
Good Luck & Good Trading!
Erin Swenlin and Carl Swenlin
Technical Analysis is a windsock, not a crystal ball. --Carl Swenlin
(c) Copyright 2025 DecisionPoint.com
Disclaimer: This blog is for educational purposes only and should not be construed as financial advice. The ideas and strategies should never be used without first assessing your own personal and financial situation, or without consulting a financial professional. Any opinions expressed herein are solely those of the author, and do not in any way represent the views or opinions of any other person or entity.
DecisionPoint is not a registered investment advisor. Investment and trading decisions are solely your responsibility. DecisionPoint newsletters, blogs or website materials should NOT be interpreted as a recommendation or solicitation to buy or sell any security or to take any specific action.
NOTE: The signal status reported herein is based upon mechanical trading model signals, specifically, the DecisionPoint Trend Model. They define the implied bias of the price index based upon moving average relationships, but they do not necessarily call for a specific action. They are information flags that should prompt chart review. Further, they do not call for continuous buying or selling during the life of the signal. For example, a BUY signal will probably (but not necessarily) return the best results if action is taken soon after the signal is generated. Additional opportunities for buying may be found as price zigzags higher, but the trader must look for optimum entry points. Conversely, exit points to preserve gains (or minimize losses) may be evident before the model mechanically closes the signal.
Helpful DecisionPoint Links:
DecisionPoint Alert Chart List
DecisionPoint Golden Cross/Silver Cross Index Chart List
DecisionPoint Sector Chart List
Price Momentum Oscillator (PMO)