
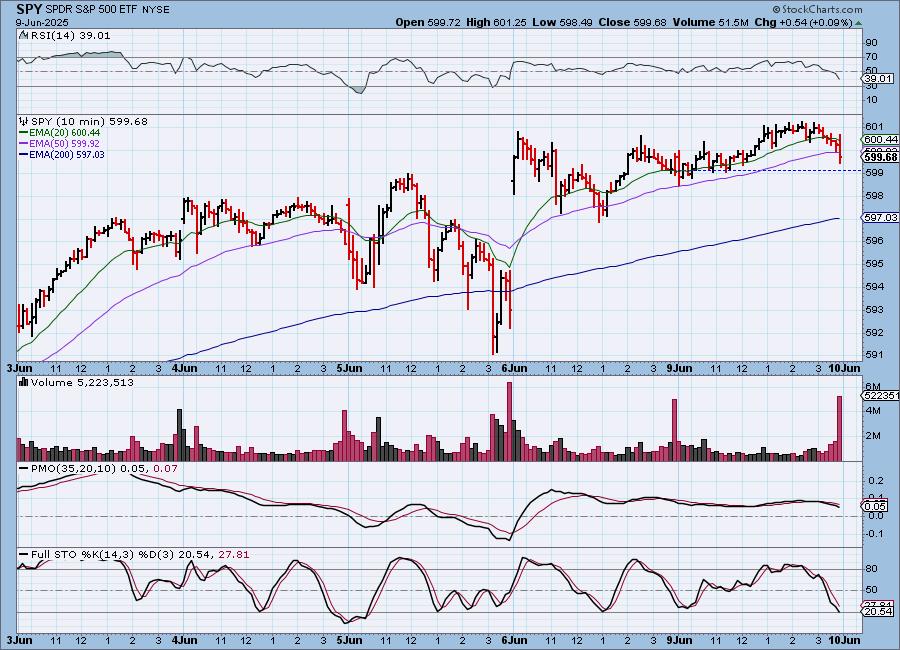
The market struggled somewhat to begin the trading day, but ultimately price did make its way higher. Unfortunately, late in trading, the market pared back its gains. This has the 10-minute PMO in decline and Stochastics dropping close to 20. This does suggest that we'll see some decline to start trading tomorrow.
The DecisionPoint Alert Weekly Wrap presents an end-of-week assessment of the trend and condition of the Stock Market, the U.S. Dollar, Gold, Crude Oil, and Bonds. The DecisionPoint Alert daily report (Monday through Thursday) is abbreviated and gives updates on the Weekly Wrap assessments.
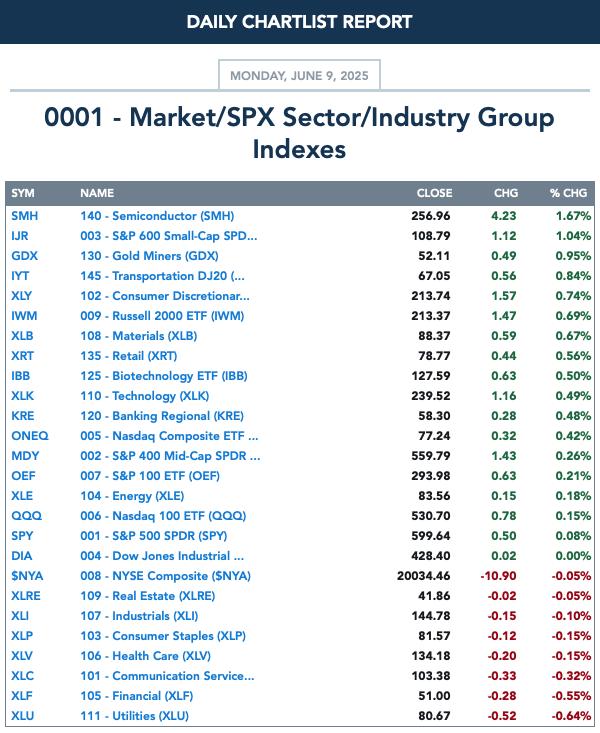
MARKET/INDUSTRY GROUP/SECTOR INDEXES
CLICK HERE for Carl's annotated Market Index, Sector, and Industry Group charts.
THE MARKET (S&P 500)
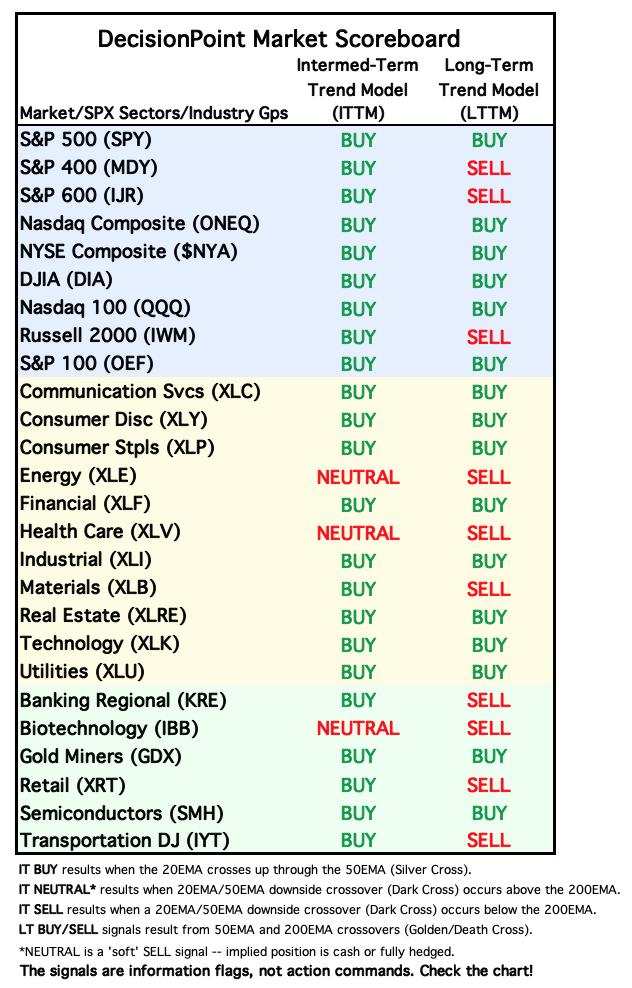
IT Trend Model: NEUTRAL as of 3/4/2025
LT Trend Model: SELL as of 4/16/2025
SPY Daily Chart: If you look at the table above, you'll see that today's gains were led by Semiconductors and interestingly the SP600 (IJR). We could be seeing a small broadening of this current rally. Price is making its way higher on a gently rising trend. The RSI is not overbought yet so we could see more upside. The PMO is on the rise. It is flat above the zero line and that does imply strength which is visible in this rising trend.
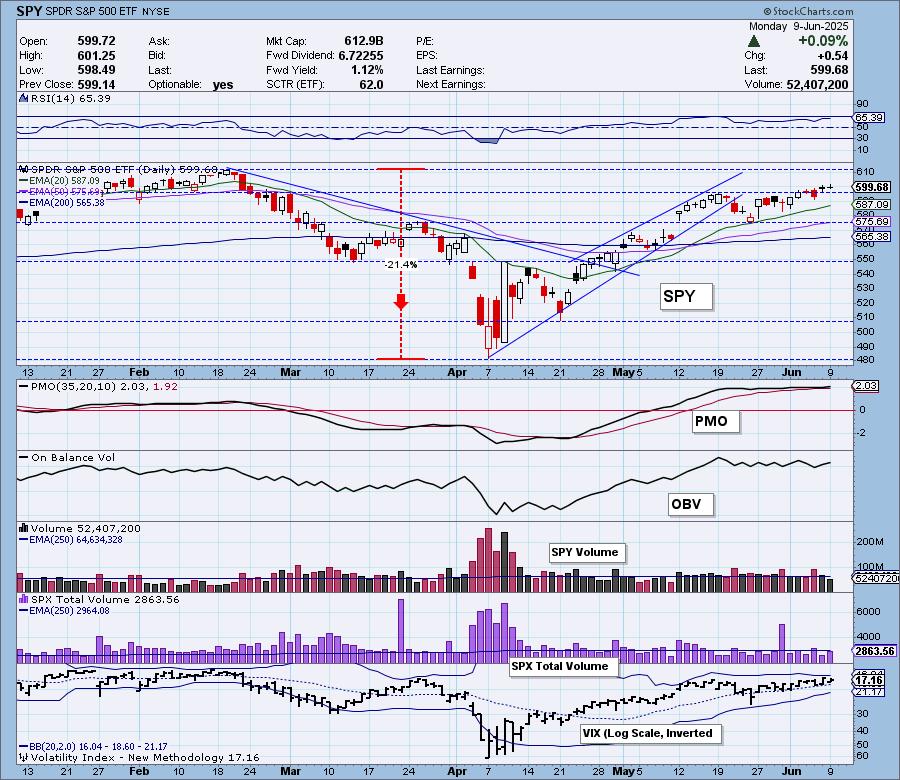
The VIX remains above its moving average on the inverted scale and Stochastics are holding above 80. Both imply internal strength.

S&P 500 New 52-Week Highs/Lows: New Highs pared back on the rally which is a negative divergence. We only saw one New Low. The High-Low Differential looks bullish as it is now accelerating higher.
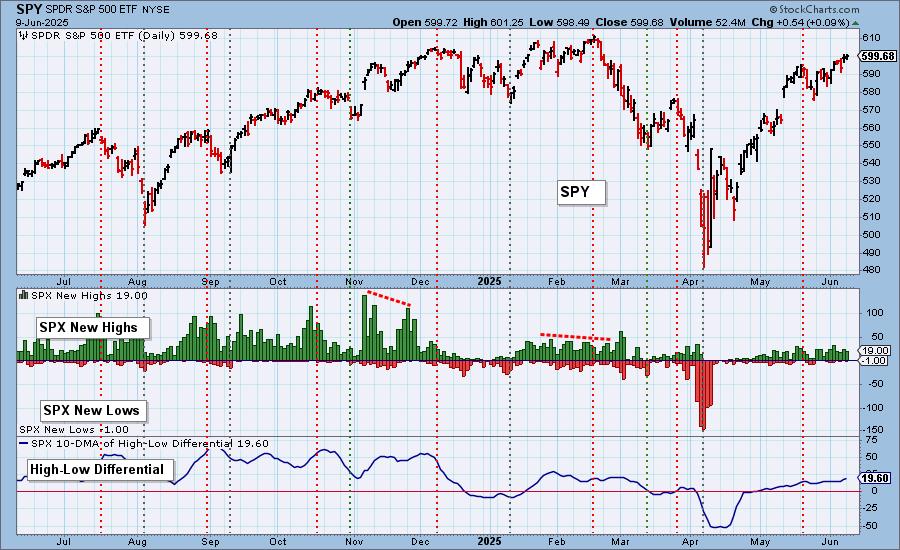
Climax* Analysis: There were no climax readings today.
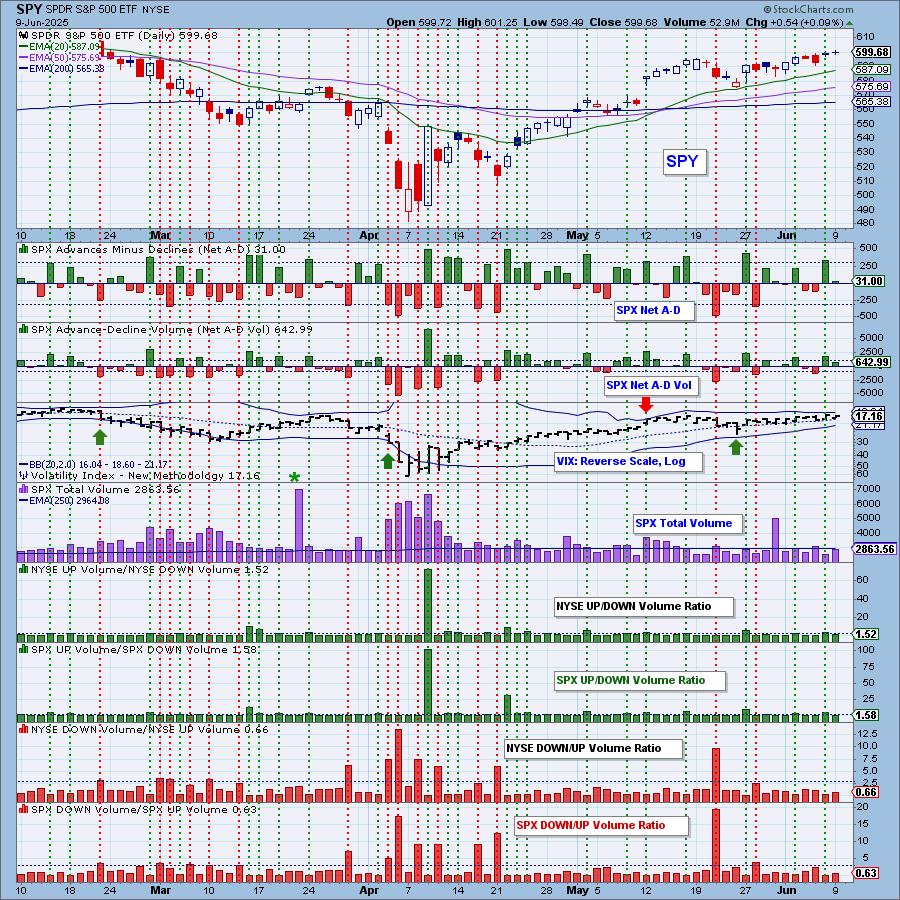
*A climax is a one-day event when market action generates very high readings in, primarily, breadth and volume indicators. We also include the VIX, watching for it to penetrate outside the Bollinger Band envelope. The vertical dotted lines mark climax days -- red for downside climaxes, and green for upside. Climaxes are at their core exhaustion events; however, at price pivots they may be initiating a change of trend.
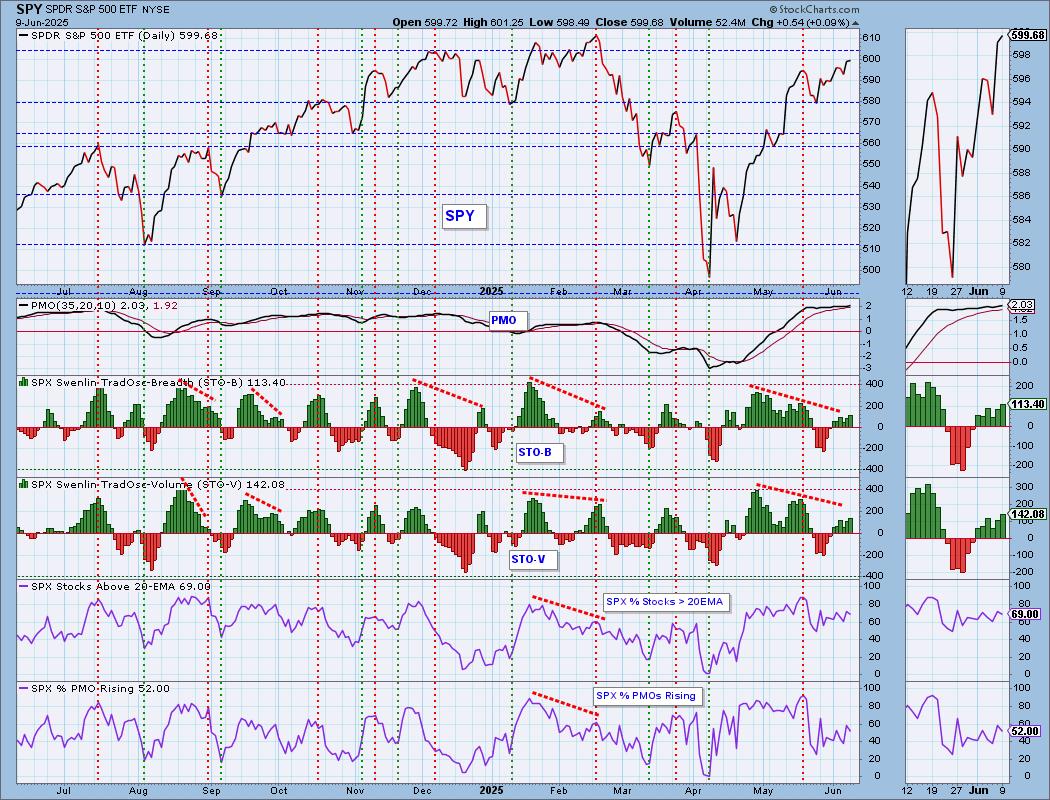
Short-Term Market Indicators: The short-term market trend is UP and the condition is NEUTRAL.
The Swenlin Trading Oscillators (STOs) are still rising which is encouraging. Unfortunately we lost some participation on today's rally and we lost rising PMOs. Both of those should've seen higher readings on a rally.
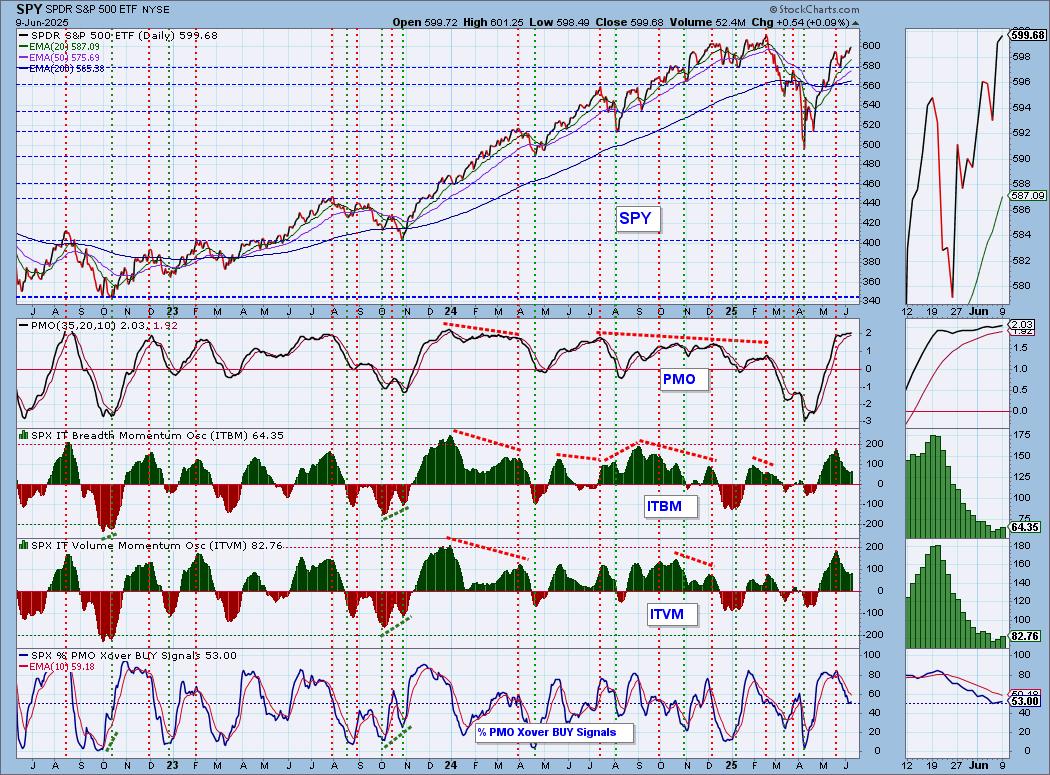
Intermediate-Term Market Indicators: The intermediate-term market trend is UP and the condition is NEUTRAL.
The ITBM and ITVM are still rising after Friday's upside reversal. We did see a one percentage point gain on the rally. We'd like to see more PMO BUY Signals as this reading is very mediocre.
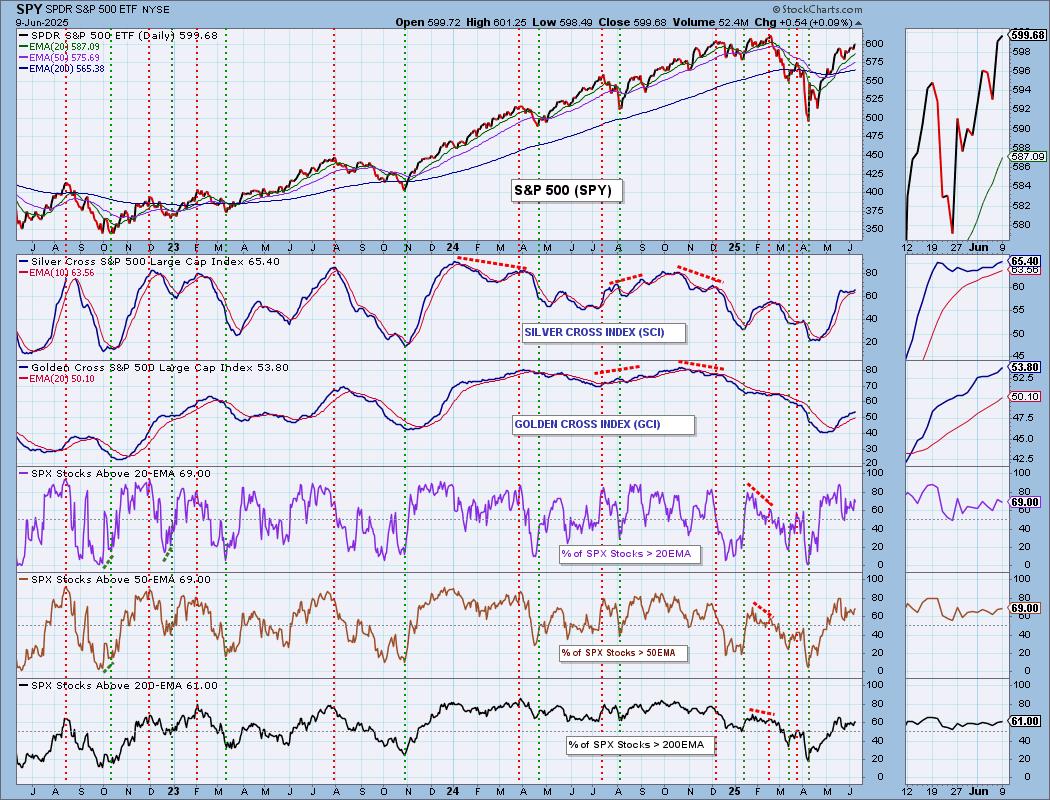
PARTICIPATION CHART (S&P 500): The following chart objectively shows the depth and trend of participation for the SPX in two time frames.
- Intermediate-Term - the Silver Cross Index (SCI) shows the percentage of SPX stocks on IT Trend Model BUY signals (20-EMA > 50-EMA). The opposite of the Silver Cross is a "Dark Cross" -- those stocks are, at the very least, in a correction.
- Long-Term - the Golden Cross Index (GCI) shows the percentage of SPX stocks on LT Trend Model BUY signals (50-EMA > 200-EMA). The opposite of a Golden Cross is the "Death Cross" -- those stocks are in a bear market.
The market bias is BULLISH in the intermediate and long terms.
Participation did slim down as far as stocks above their 20-day EMAs. It held firm on %Stocks > 50/200EMAs. The Silver Cross Index and the Golden Cross Index are on the rise. Both are above their signal lines so the IT and LT Biases are BULLISH.
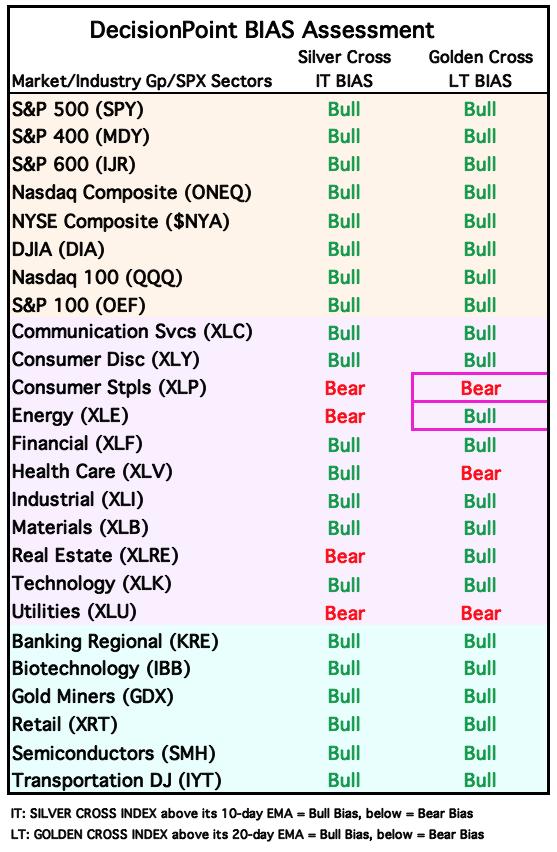
BIAS Assessment: The following table expresses the current BIAS of various price indexes based upon the relationship of the Silver Cross Index to its 10-day EMA (intermediate-term), and of the Golden Cross Index to its 20-day EMA (long-term). When the Index is above the EMA it is bullish, and it is bearish when the Index is below the EMA. The BIAS does not imply that any particular action should be taken. It is information to be used in the decision process.
The items with highlighted borders indicate that the BIAS changed today.
*****************************************************************************************************
CONCLUSION: It started off well enough today, but by the end of the trading day most gains were erased. There seems to be a lack of conviction. The rally is inching along and could continue to based on most of our indicators being bullish. If we had a complaint it would be that participation did shrink somewhat and we saw fewer rising PMOs. For now the STOs are rising alongside the ITBM and ITVM and the very short-term Stochastics are holding strong above 80. Another positive is the good performance on the SP600 today. The market will continue to be headline driven. If we get some indication that the U.S.-China tariff negotiations are going in the right direction, it could certainly fuel the market to move higher. If talks stall, we would likely see a decline get started again.
Erin is 60% long, 0% short. (This is intended as information, not a recommendation.)
*****************************************************************************************************
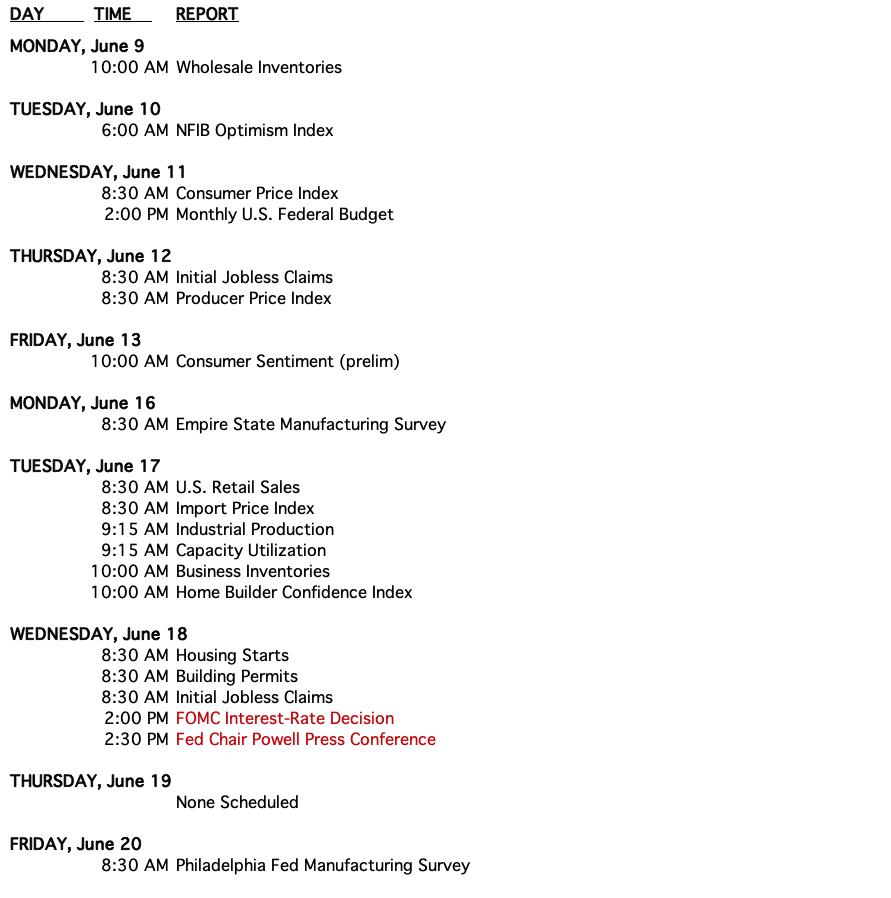
CALENDAR
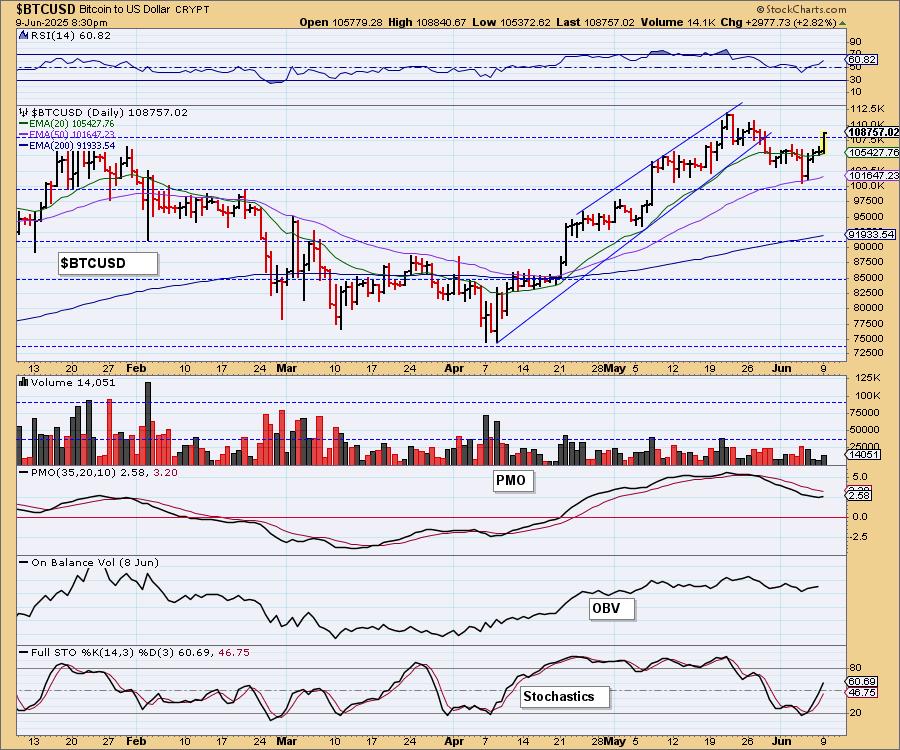
BITCOIN
Bitcoin had a good weekend and the rally continued today. This may be all the pullback we'll get. Right now we see a bull flag shaping up on the chart and that would imply much higher prices ahead. The PMO is now turning up and Stochastics are rising strongly. Look for all-time highs to be reached.
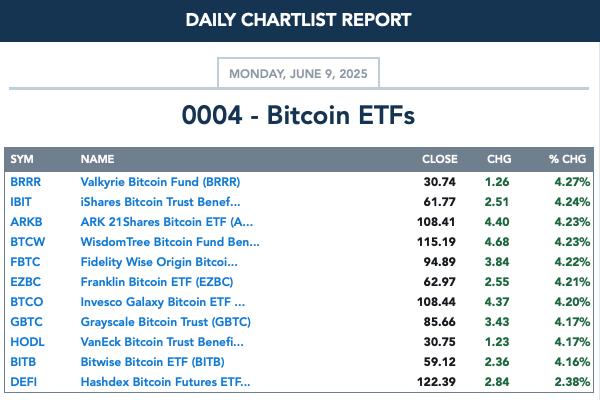
BITCOIN ETFs
INTEREST RATES
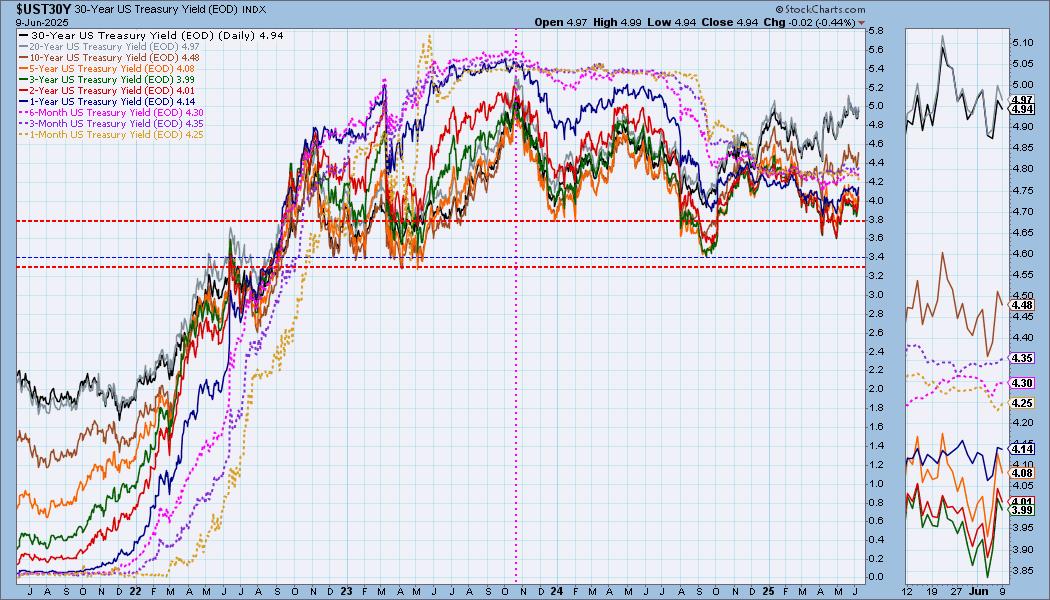
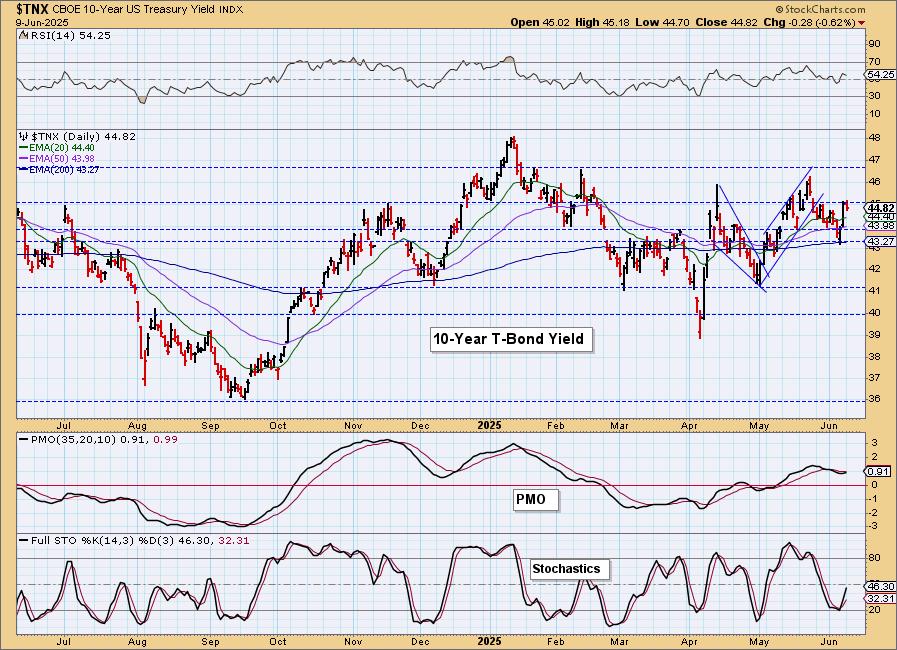
Yields reversed lower today. We still think there is an opportunity for long-term yields to rise from here given the intermediate-term rising trends. Short-term yields are likely to continue moving sideways.
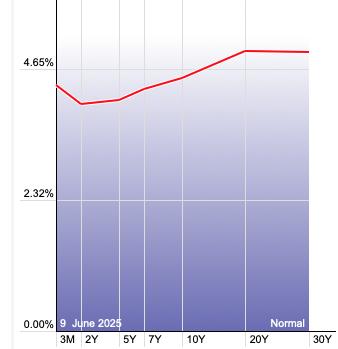
The Yield Curve Chart from StockCharts.com shows us the inversions taking place. The red line should move higher from left to right. Inversions are occurring where it moves downward.
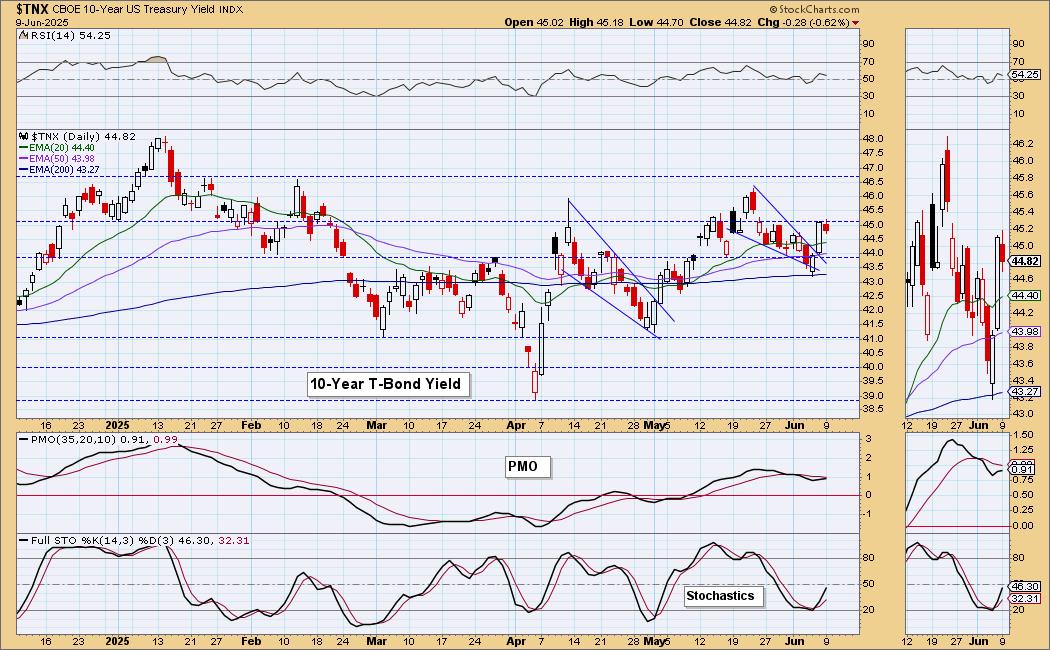
10-YEAR T-BOND YIELD
The bullish falling wedge executed as expected with a breakout on Friday. Today it stalled at overhead resistance. Given we still have a rising PMO and Stochastics, we do expect the yield to rise further from here.
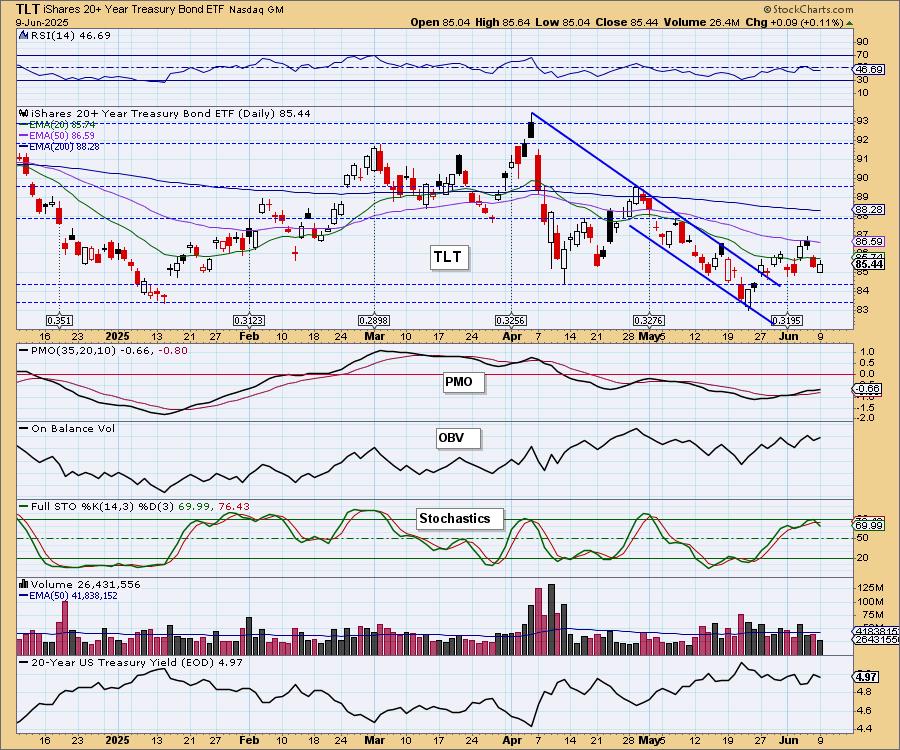
BONDS (TLT)
IT Trend Model: SELL as of 4/14/2025
LT Trend Model: SELL as of 12/13/2024
TLT Daily Chart: We saw a minor rally on Bonds today as yields did contract. TLT formed a lower high and a lower low so we don't see today's rally as all that positive. The rising trend out of the May low is already being compromised. Stochastics have topped and the RSI is negative. The PMO is still rising, but is below the zero line so price could definitely start heading lower from here.

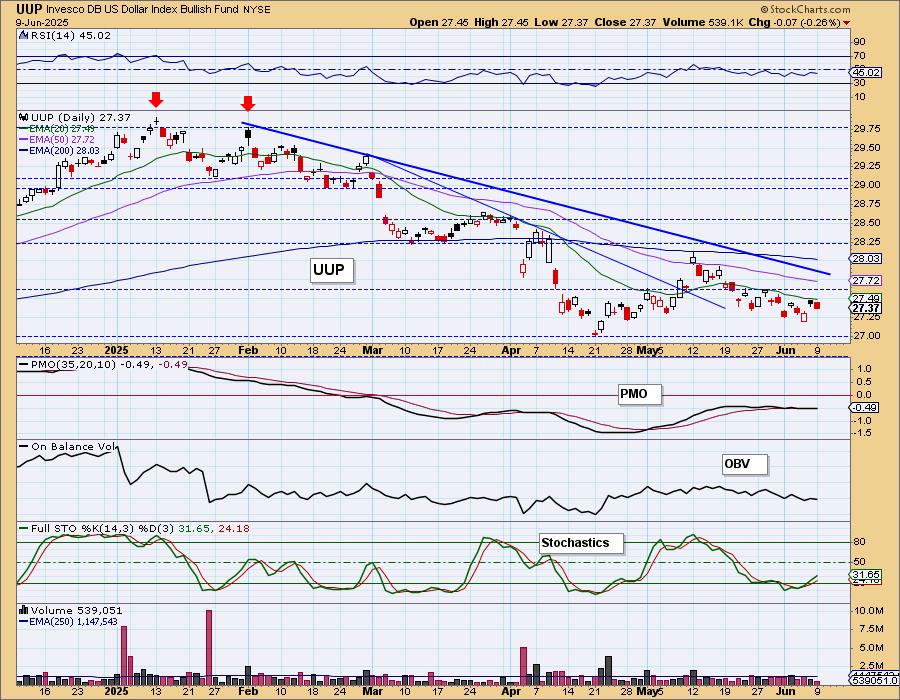
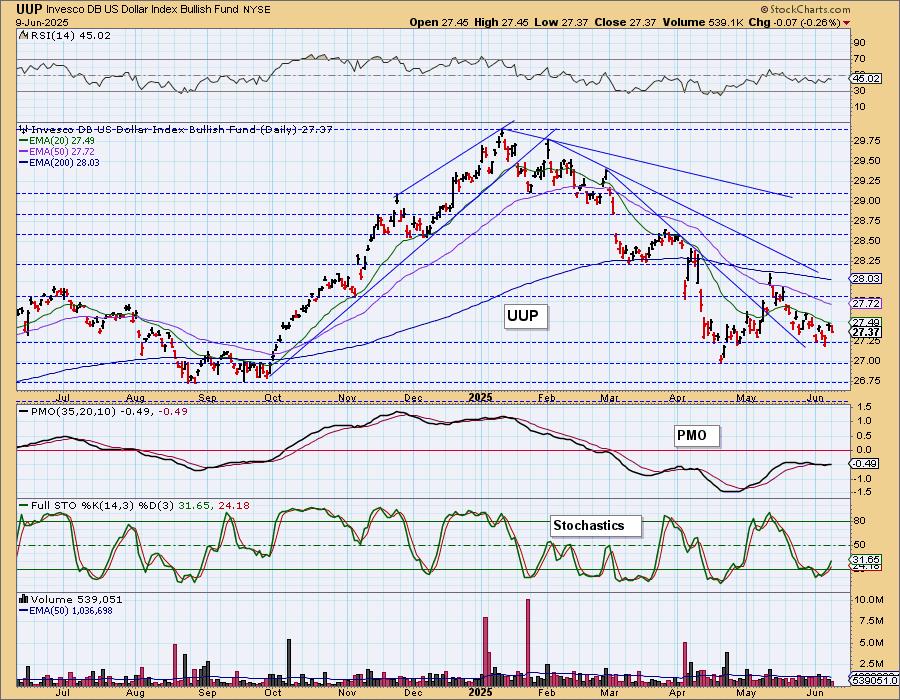
DOLLAR (UUP)
IT Trend Model: NEUTRAL as of 3/5/2025
LT Trend Model: SELL as of 4/25/2025
UUP Daily Chart: The Dollar remains in a short-term declining trend, but also a longer-term declining trend. The PMO is flat beneath the zero line indicating pure weakness. The RSI is negative. Stochastics may be rising, but we see more downside for the Dollar ahead. Someone mentioned a possible bullish cup with handle pattern, but we see the 'handle' being too long on the pattern.
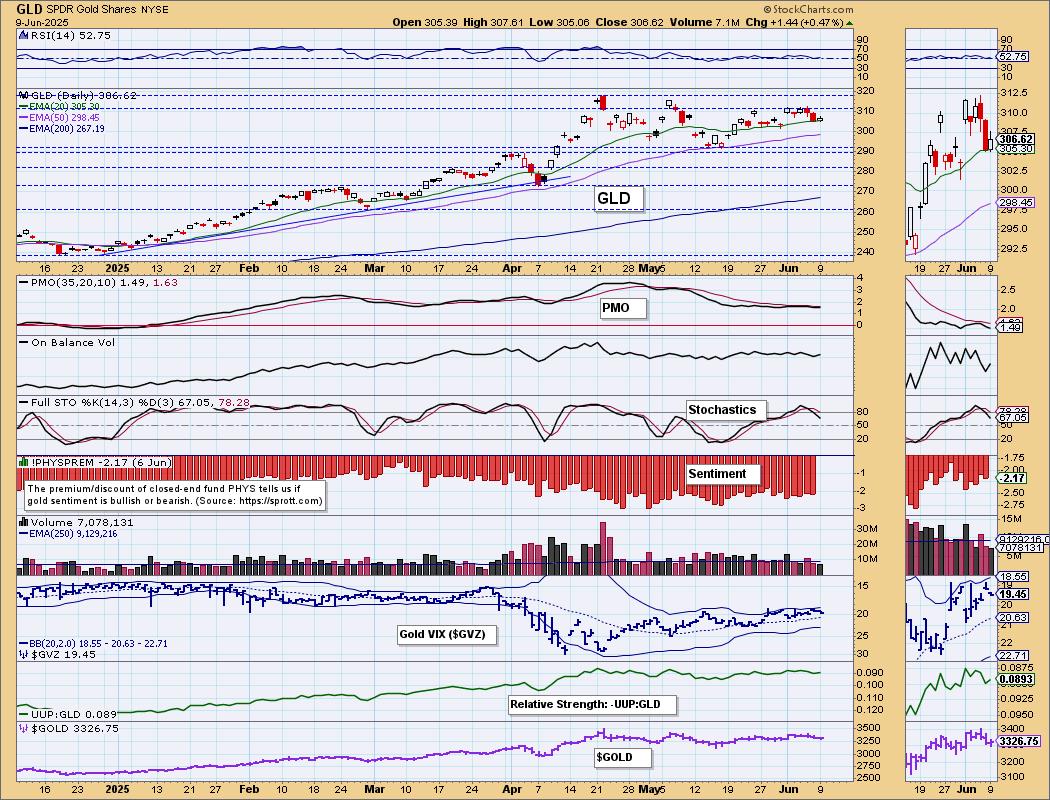
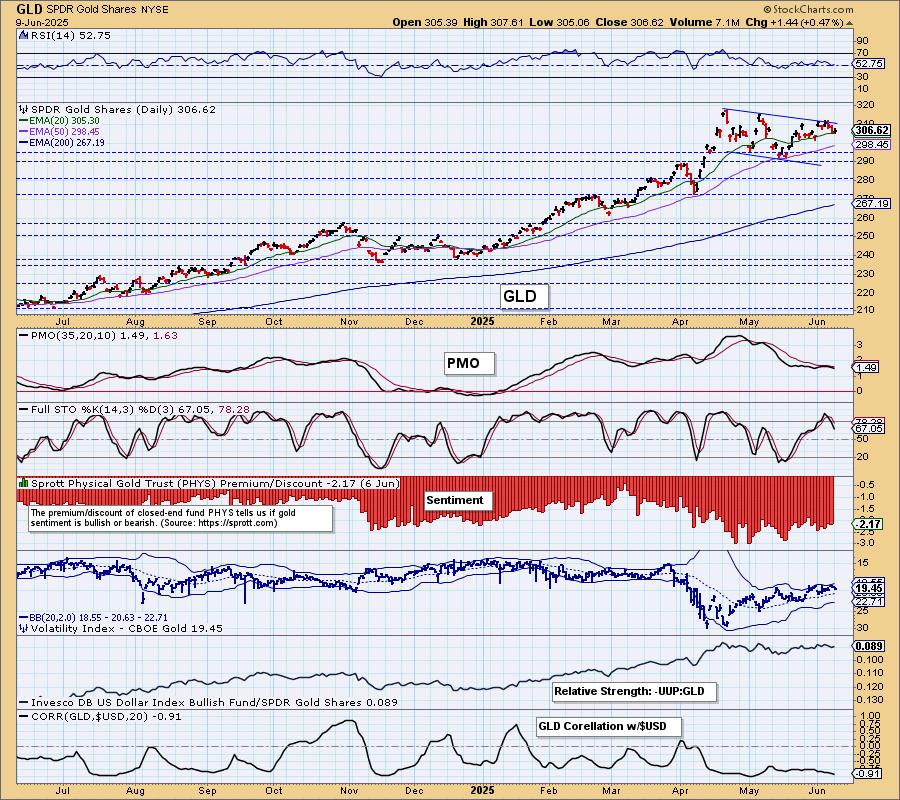
GOLD
IT Trend Model: BUY as of 1/10/2025
LT Trend Model: BUY as of 10/20/2023
GLD Daily Chart: Gold had a nice rally today. It was up further than the Dollar was down so we had some extra buyers in there. It is essentially in a holding pattern. The PMO has topped beneath the signal line which is especially bearish so we should be prepared for a possible drop toward support. Stochastics are also falling. We still like Gold very much in the intermediate to long terms. The Dollar still looks weak to us so don't completely count Gold out in the short term.
GOLD MINERS (GDX) Daily Chart: Gold Miners hit overhead resistance and have pulled back. They saw a rise today on Gold's rally. The rising trend is still intact, but the PMO has topped so we could see some more pullback. Participation and the Silver/Golden Cross Indexes are very strong and could support an upside reversal. With the Dollar still showing some weakness, we aren't expecting a deep decline.

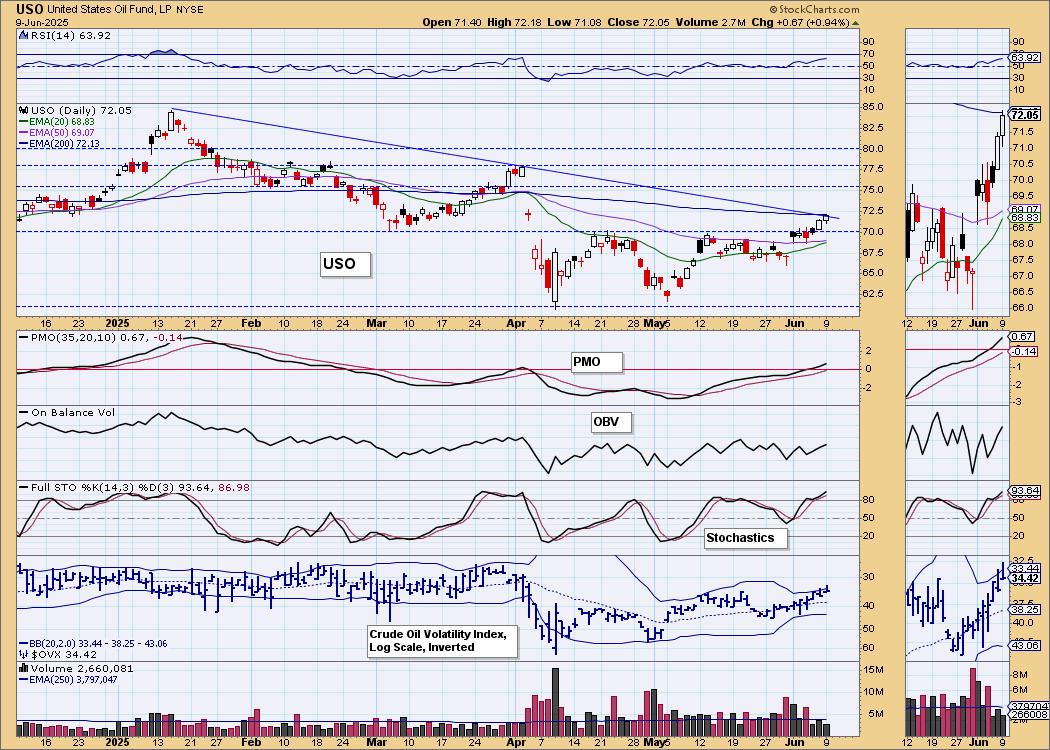
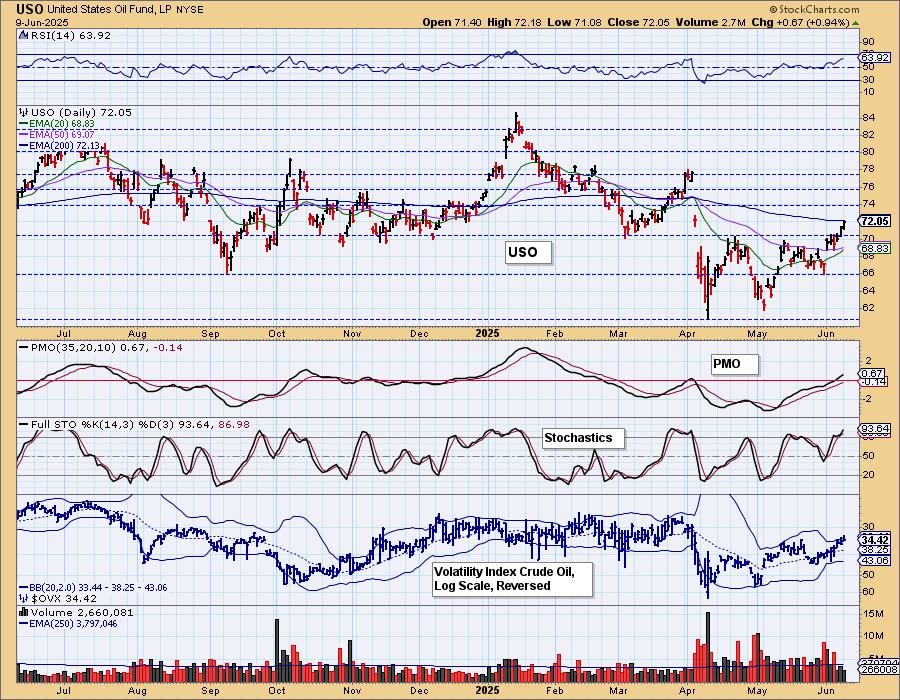
CRUDE OIL (USO)
IT Trend Model: NEUTRAL as of 2/27/2025
LT Trend Model: SELL as of 3/18/2025
USO Daily Chart: Crude Oil rallied above resistance finally and does look bullish. We will know a lot more tomorrow when we see what it does with the intermediate-term declining tops line and the 200-day EMA. Given the nearing Silver Cross of the 20/50-day EMAs and the PMO rising above the zero line, we are going to look for more upside here. Stochastics also look very strong above 80.
Good Luck & Good Trading!
Erin Swenlin and Carl Swenlin
Technical Analysis is a windsock, not a crystal ball. --Carl Swenlin
(c) Copyright 2025 DecisionPoint.com
Disclaimer: This blog is for educational purposes only and should not be construed as financial advice. The ideas and strategies should never be used without first assessing your own personal and financial situation, or without consulting a financial professional. Any opinions expressed herein are solely those of the author, and do not in any way represent the views or opinions of any other person or entity.
DecisionPoint is not a registered investment advisor. Investment and trading decisions are solely your responsibility. DecisionPoint newsletters, blogs or website materials should NOT be interpreted as a recommendation or solicitation to buy or sell any security or to take any specific action.
NOTE: The signal status reported herein is based upon mechanical trading model signals, specifically, the DecisionPoint Trend Model. They define the implied bias of the price index based upon moving average relationships, but they do not necessarily call for a specific action. They are information flags that should prompt chart review. Further, they do not call for continuous buying or selling during the life of the signal. For example, a BUY signal will probably (but not necessarily) return the best results if action is taken soon after the signal is generated. Additional opportunities for buying may be found as price zigzags higher, but the trader must look for optimum entry points. Conversely, exit points to preserve gains (or minimize losses) may be evident before the model mechanically closes the signal.
Helpful DecisionPoint Links:
DecisionPoint Alert Chart List
DecisionPoint Golden Cross/Silver Cross Index Chart List
DecisionPoint Sector Chart List
Price Momentum Oscillator (PMO)