
It was a very interesting day of trading on the heels of the U.S. bombing of Iranian nuclear sites. As of publishing, there is a cease fire being worked out between Israel and Iran with the expectation of an end to the conflict. While the market didn't react much to the bombing, it could react very well to a cease fire.
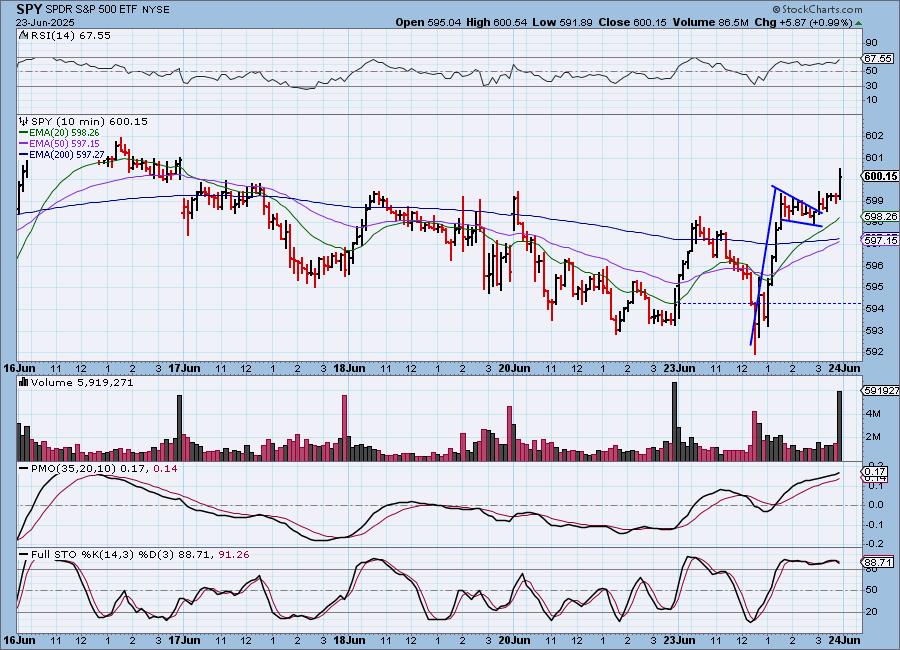
We note a bullish flag formation on the 10-minute bar chart. It was confirmed with the late day breakout. It certainly suggests that we'll see more upside tomorrow. Stochastics are holding above 80 and the 10-minute PMO is rising strongly.
The DecisionPoint Alert Weekly Wrap presents an end-of-week assessment of the trend and condition of the Stock Market, the U.S. Dollar, Gold, Crude Oil, and Bonds. The DecisionPoint Alert daily report (Monday through Thursday) is abbreviated and gives updates on the Weekly Wrap assessments.
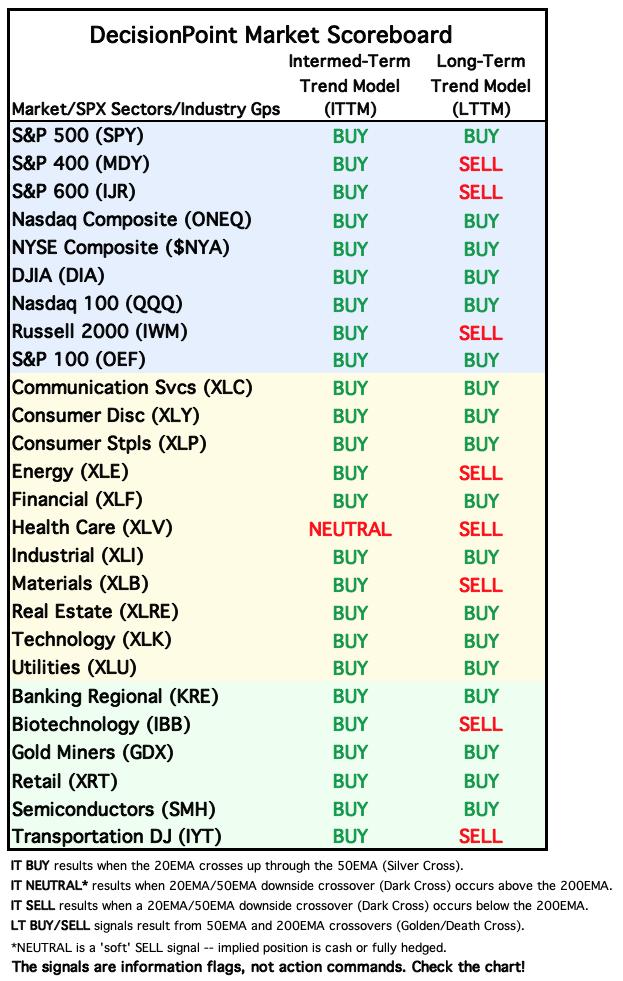
MARKET/INDUSTRY GROUP/SECTOR INDEXES
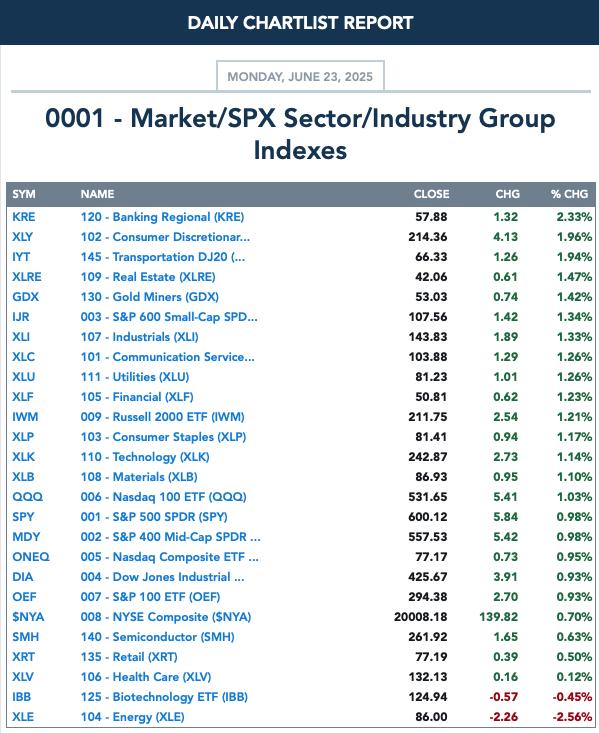
CLICK HERE for Carl's annotated Market Index, Sector, and Industry Group charts.
THE MARKET (S&P 500)
IT Trend Model: NEUTRAL as of 3/4/2025
LT Trend Model: SELL as of 4/16/2025
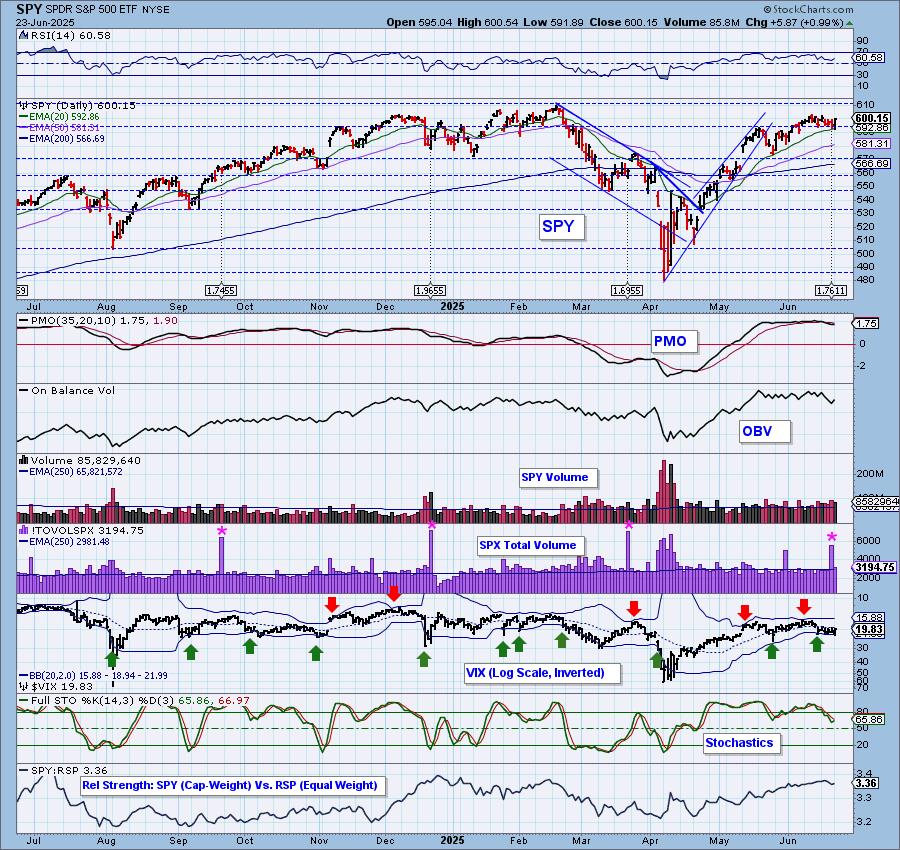
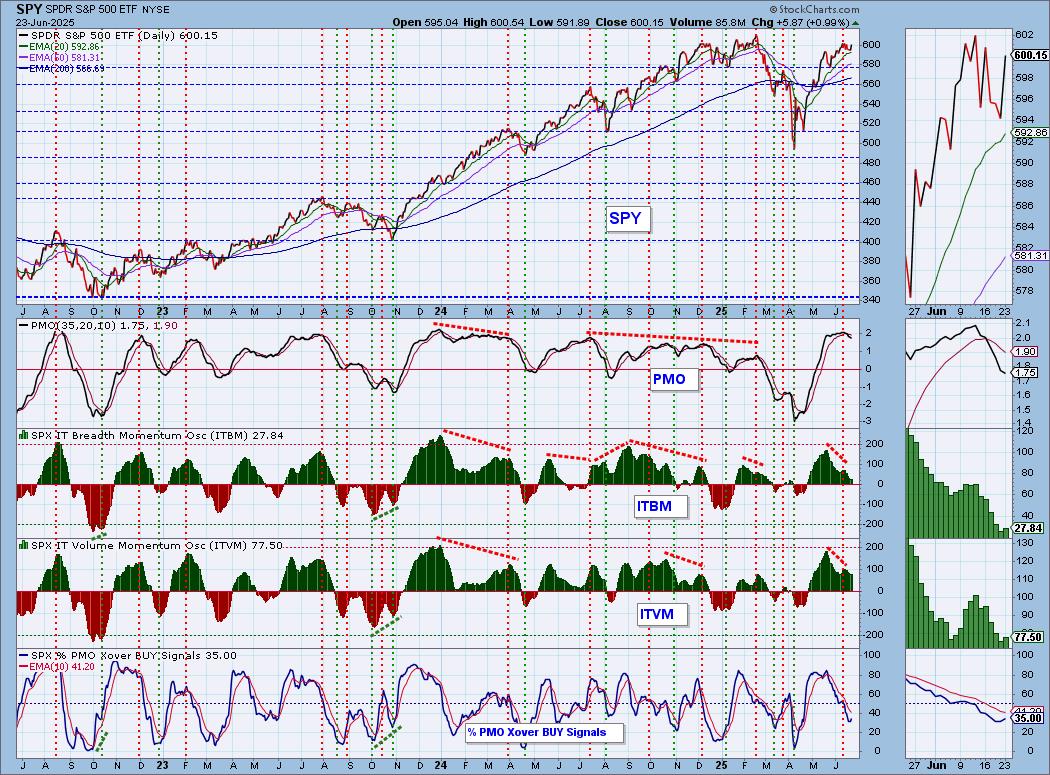
SPY Daily Chart: Price continues to hold above support, not losing much ground at all since topping earlier in the month. We sense that price is internally correcting and possibly consolidating before another leg up. The RSI is not overbought so it isn't out of the question. The PMO is staying flat above the zero line so there is some indication that price is holding strength internally.
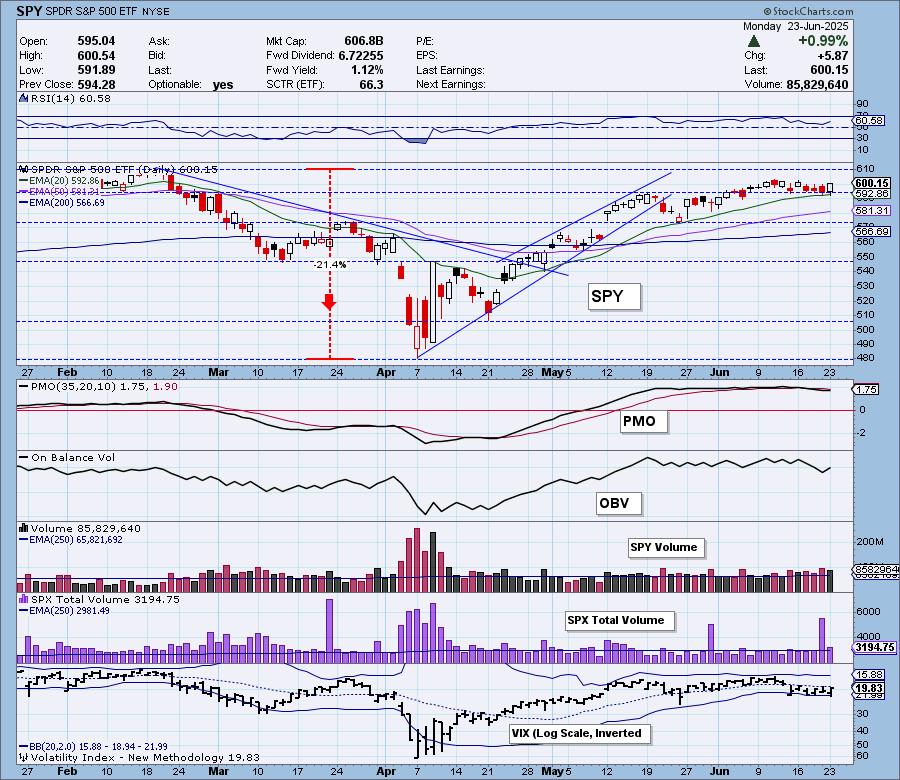
The VIX is still a problem reading below its moving average on the inverted scale. Stochastics did tip upward in positive territory suggesting some internal strength.
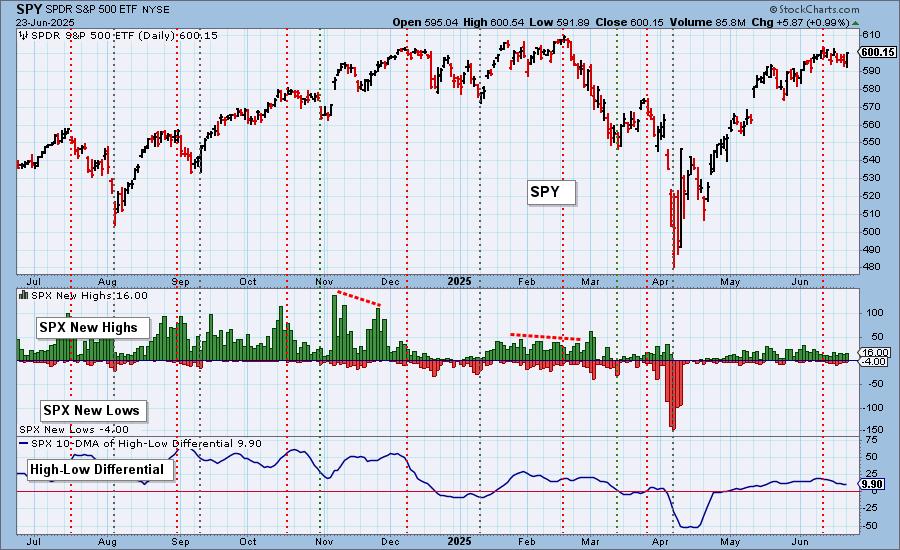
S&P 500 New 52-Week Highs/Lows: New Highs and New Lows held at similar levels to Friday. The High-Low Differential is problematic in its decline.
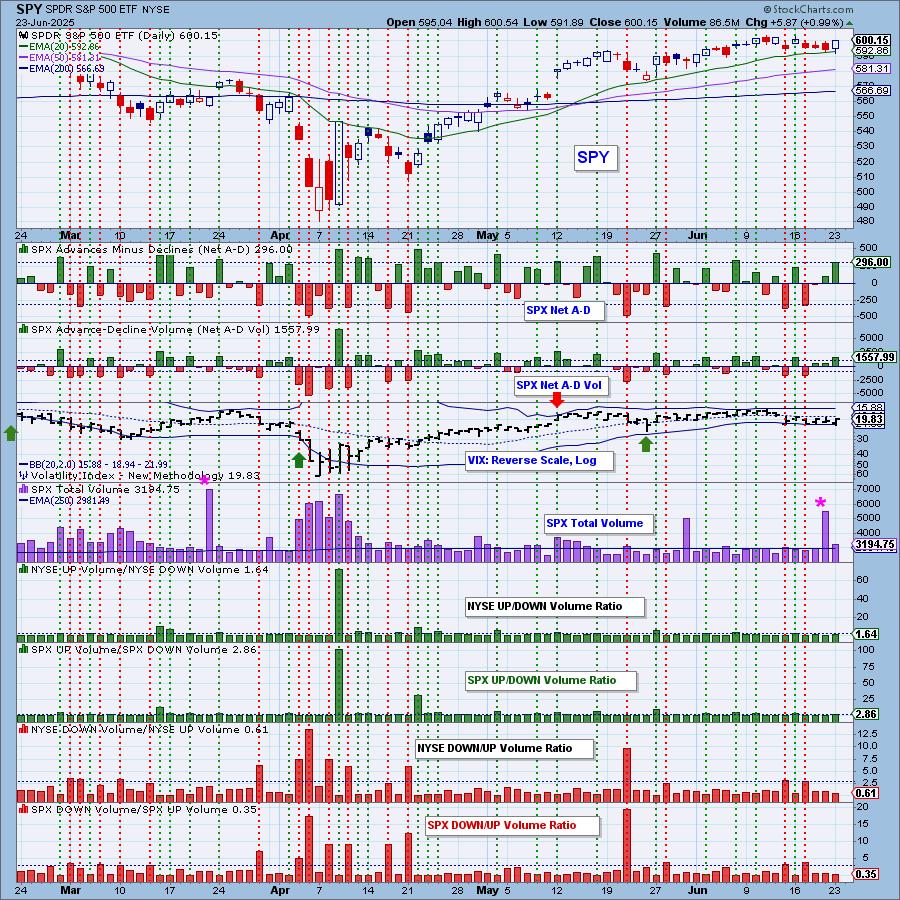
Climax* Analysis: There was one climax reading and one "almost" on the four relevant indicators today, which is short of a climax day. Nevertheless, we should probably be alert for a potential upside initiation reaction. SPX Total Volume was slightly better than the one-year daily average volume, which is short of confirmation.
*A climax is a one-day event when market action generates very high readings in, primarily, breadth and volume indicators. We also include the VIX, watching for it to penetrate outside the Bollinger Band envelope. The vertical dotted lines mark climax days -- red for downside climaxes, and green for upside. Climaxes are at their core exhaustion events; however, at price pivots they may be initiating a change of trend.
Short-Term Market Indicators: The short-term market trend is UP and the condition is NEUTRAL.
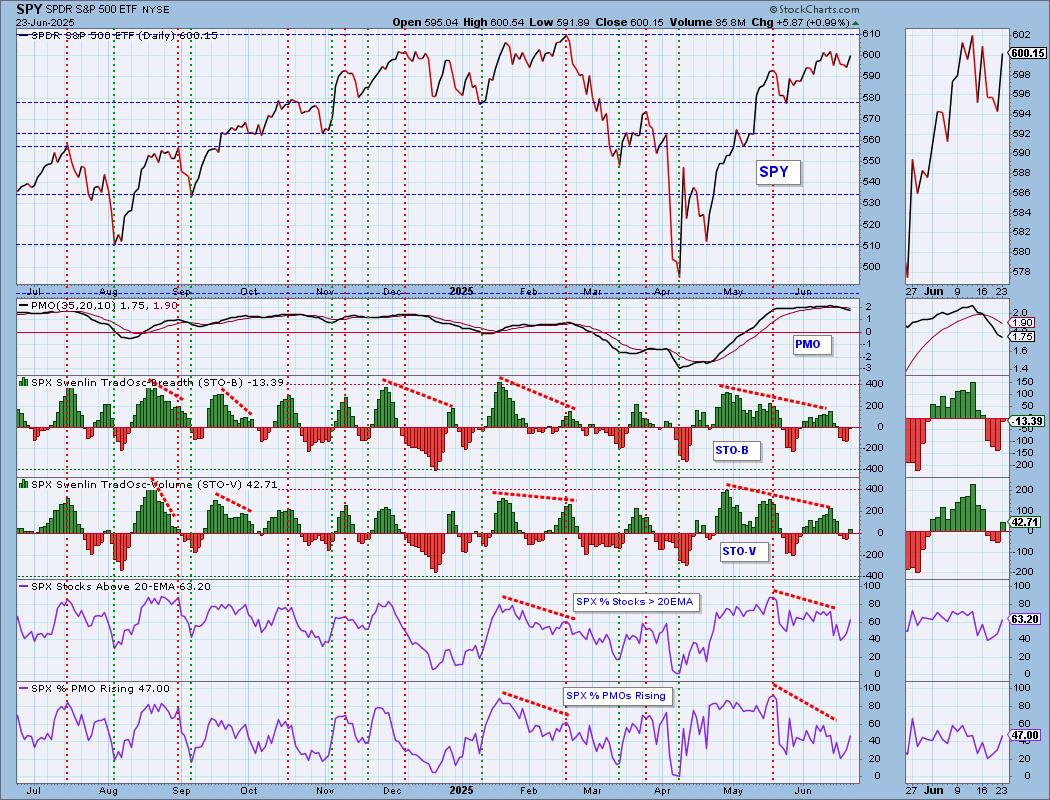
In a bullish turn of events, both Swenlin Trading Oscillators (STOs) turned up with the STO-V back in positive territory. This bodes well. Participation shot back up above our bullish 50% threshold and we also saw a large gain on rising PMOs. The negative divergences are still prevalent.
Intermediate-Term Market Indicators: The intermediate-term market trend is UP and the condition is NEUTRAL.
We also saw the ITBM and ITVM turn up on today's rally. We also gathered more PMO BUY Signals, although that indicator still has a marginal 35% reading.
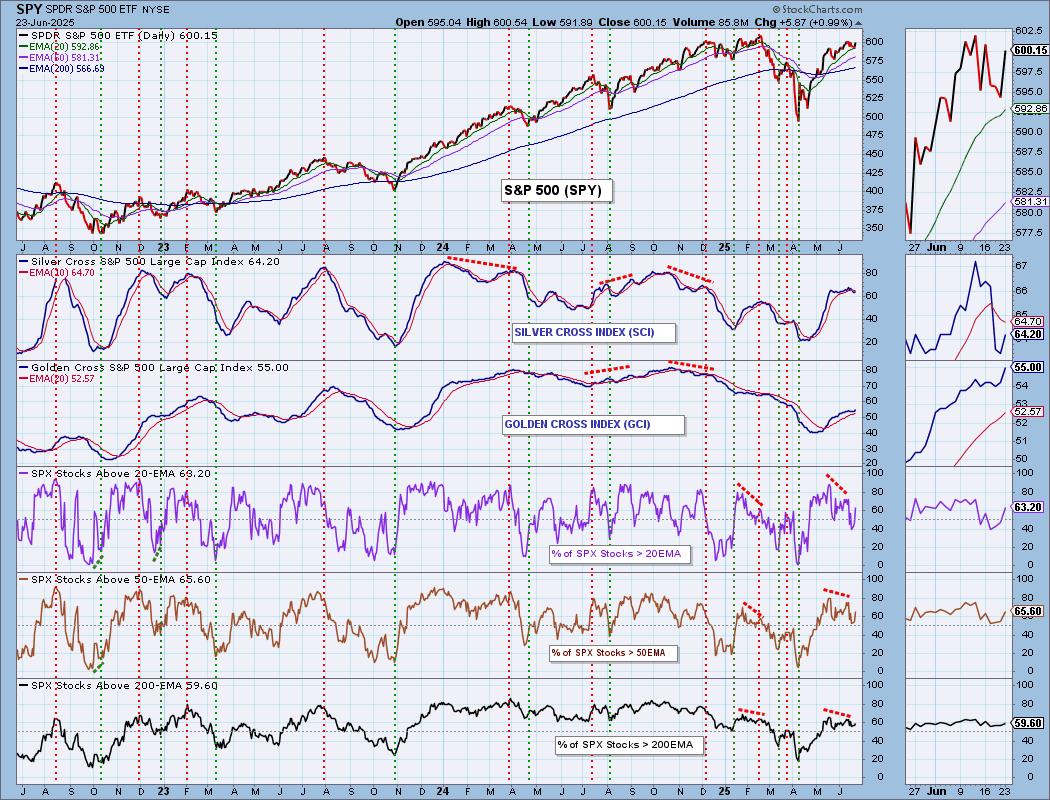
PARTICIPATION CHART (S&P 500): The following chart objectively shows the depth and trend of participation for the SPX in two time frames.
- Intermediate-Term - the Silver Cross Index (SCI) shows the percentage of SPX stocks on IT Trend Model BUY signals (20-EMA > 50-EMA). The opposite of the Silver Cross is a "Dark Cross" -- those stocks are, at the very least, in a correction.
- Long-Term - the Golden Cross Index (GCI) shows the percentage of SPX stocks on LT Trend Model BUY signals (50-EMA > 200-EMA). The opposite of a Golden Cross is the "Death Cross" -- those stocks are in a bear market.
The market bias is BEARISH in the intermediate term.
The market bias is BULLISH in the long term.
Participation improved greatly on today's rally. We saw big jumps on percent stocks above key moving averages. The Silver Cross Index also turned back up. It is still below its signal line so the IT Bias still reads as BEARISH. The Golden Cross Index surged higher on its upside reversal. It remains above its signal line so the LT Bias is BULLISH.
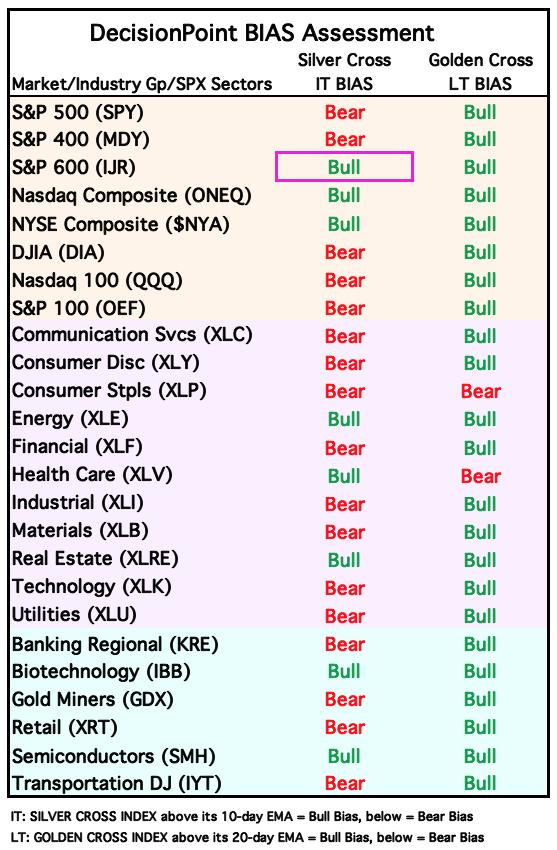
BIAS Assessment: The following table expresses the current BIAS of various price indexes based upon the relationship of the Silver Cross Index to its 10-day EMA (intermediate-term), and of the Golden Cross Index to its 20-day EMA (long-term). When the Index is above the EMA it is bullish, and it is bearish when the Index is below the EMA. The BIAS does not imply that any particular action should be taken. It is information to be used in the decision process.
The items with highlighted borders indicate that the BIAS changed today.
*****************************************************************************************************
CONCLUSION: The market was surprisingly unperturbed by the U.S. involvement in Iran over the weekend. We think it will react positively to the new ceasefire and possible end to the Israel/Iran 12-day war. The internals are also implying we'll see higher prices. The STOs have turned back as have the ITBM and ITVM. We had a whiff of an upside initiation climax that could also work in the market's favor. We don't want to ignore negative divergences nor a bearish Bias Table. These do leave the market vulnerable. At this point, it does appear that the market has been internally correcting as price hovers above support so for now we will look for higher prices.
Erin is 50% long, 0% short. (This is intended as information, not a recommendation.)
*****************************************************************************************************
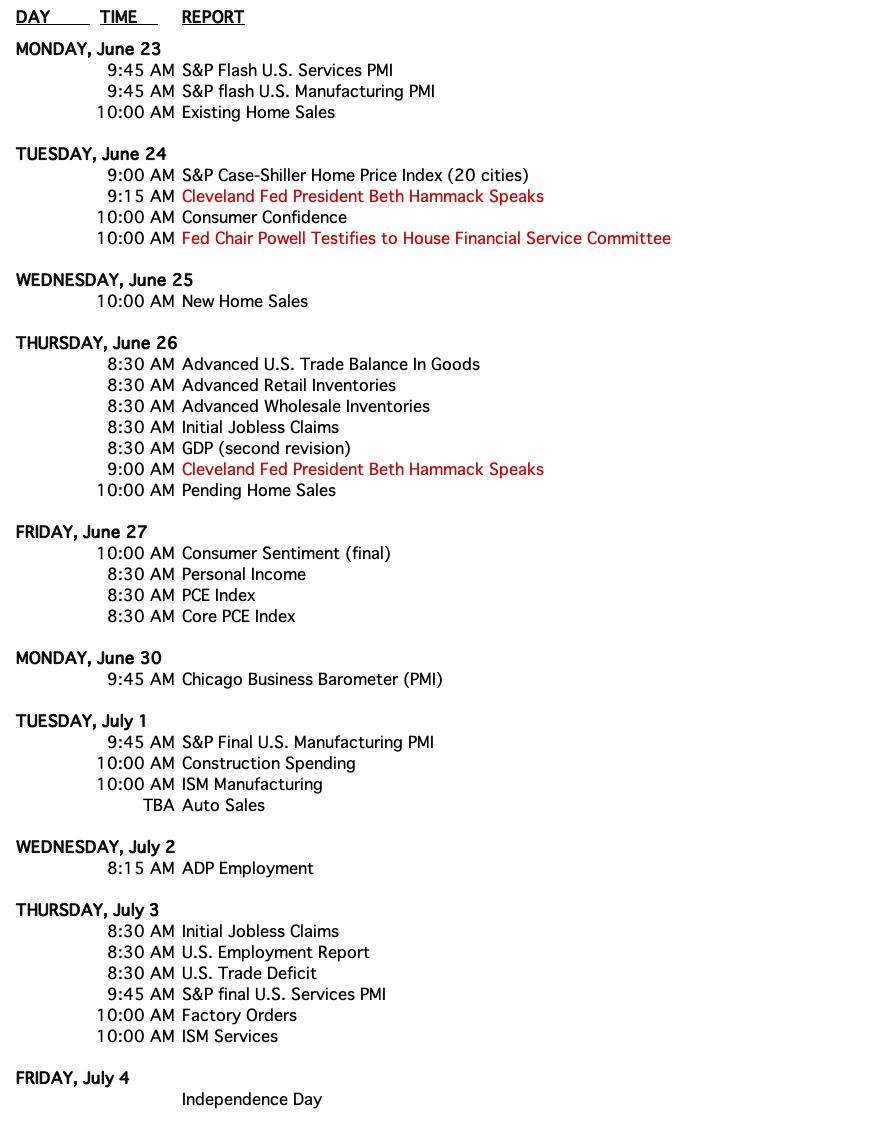
CALENDAR
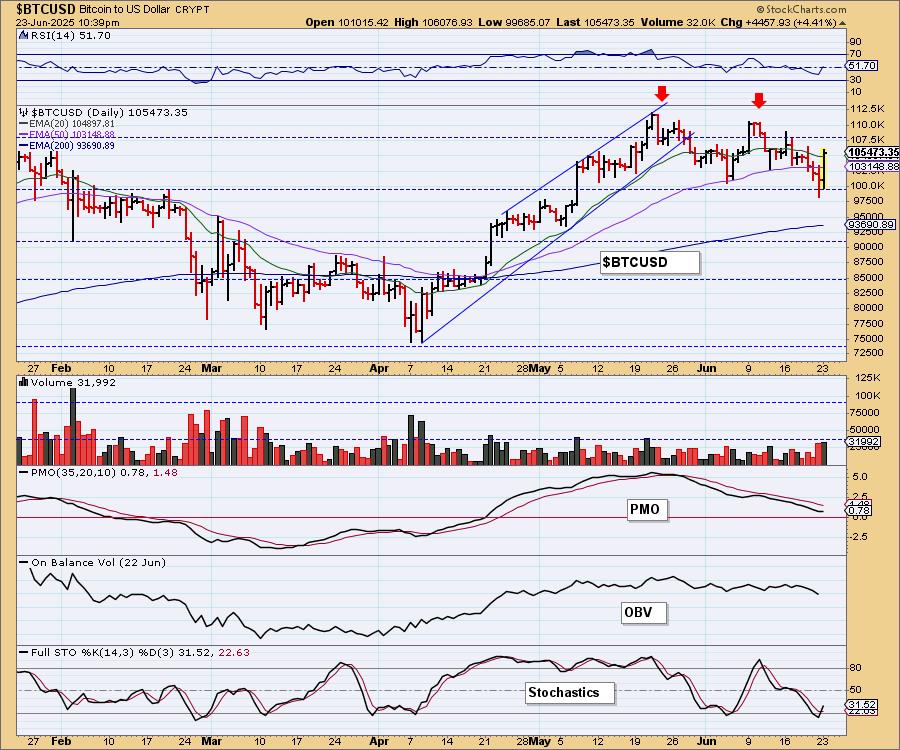
BITCOIN
For those having trouble understanding cryptos, here's a video for clarification: click here. Right now we see a bearish double top. Technically the pattern was confirmed with the drop below the confirmation line at the early June low. However, it rebounded significantly today off that level of support. It appears ready to rally again as the PMO is already beginning to turn back up. Stochastics also turned back up so we think we could see another rally. The double top will be in force until we get a breakout above the tops so it is still vulnerable.
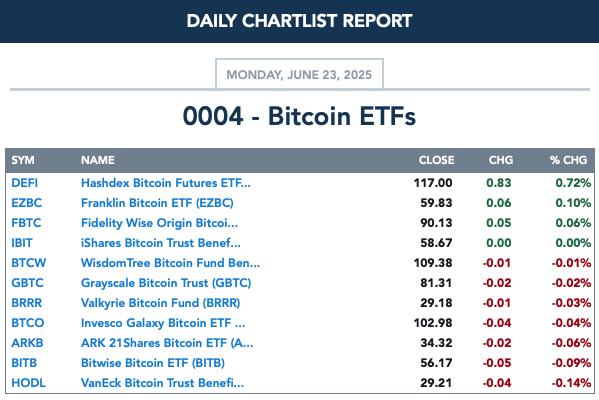
BITCOIN ETFs
INTEREST RATES
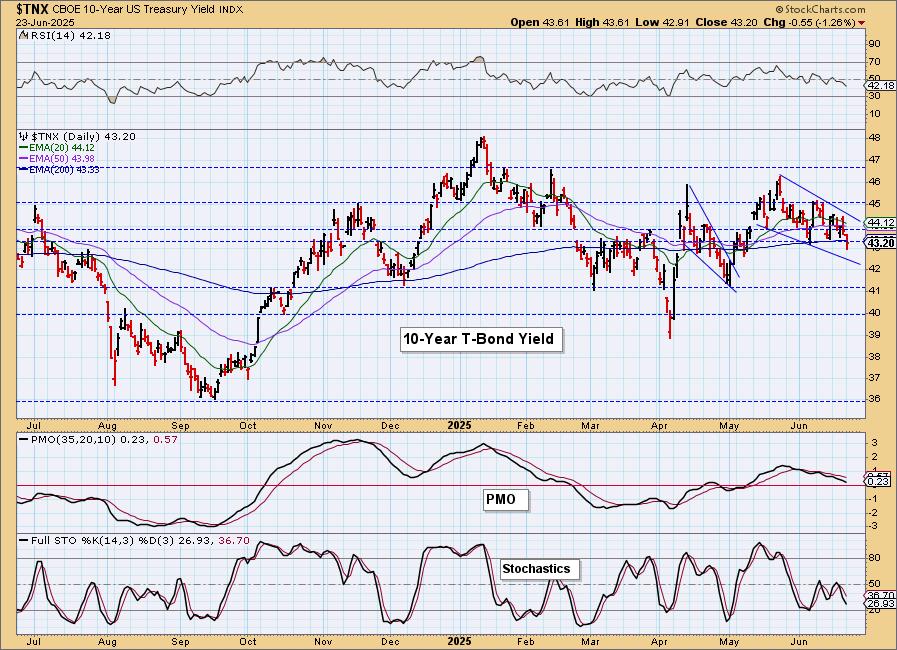
Yields fell today across the board. They are likely to fall a bit further, but we are looking for an upside reversal in the next week or two.
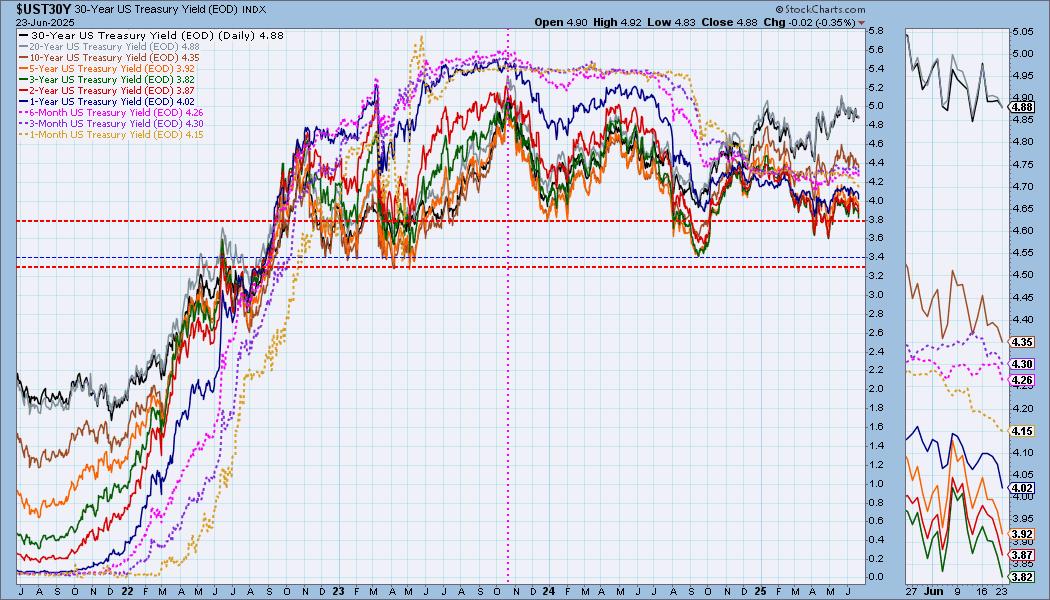
The Yield Curve Chart from StockCharts.com shows us the inversions taking place. The red line should move higher from left to right. Inversions are occurring where it moves downward.

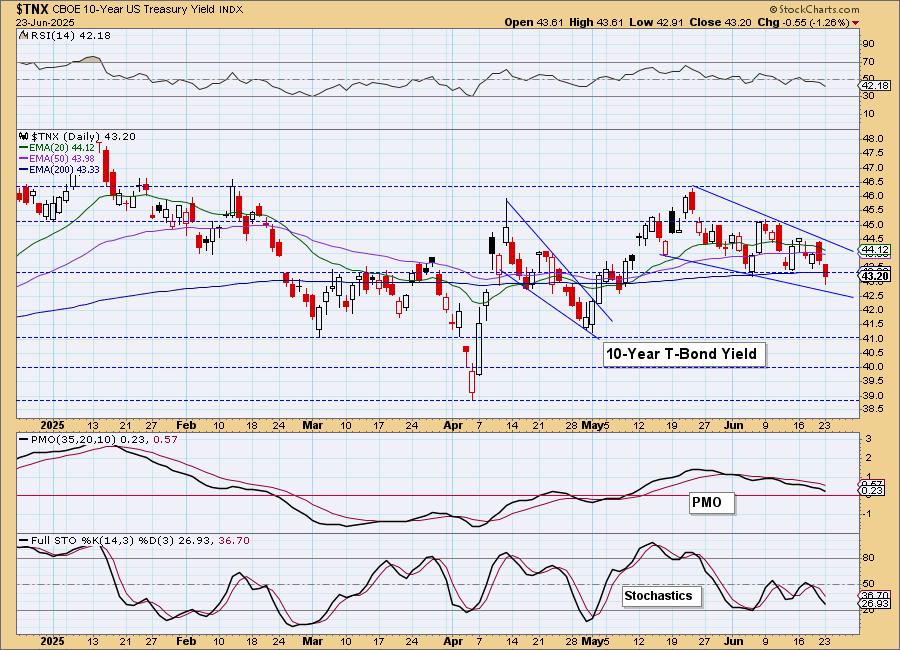
10-YEAR T-BOND YIELD
$TNX is headed back down to the bottom of the bullish falling wedge. These patterns often execute as expected, but we may need to see more decline first given the bearish indicators.
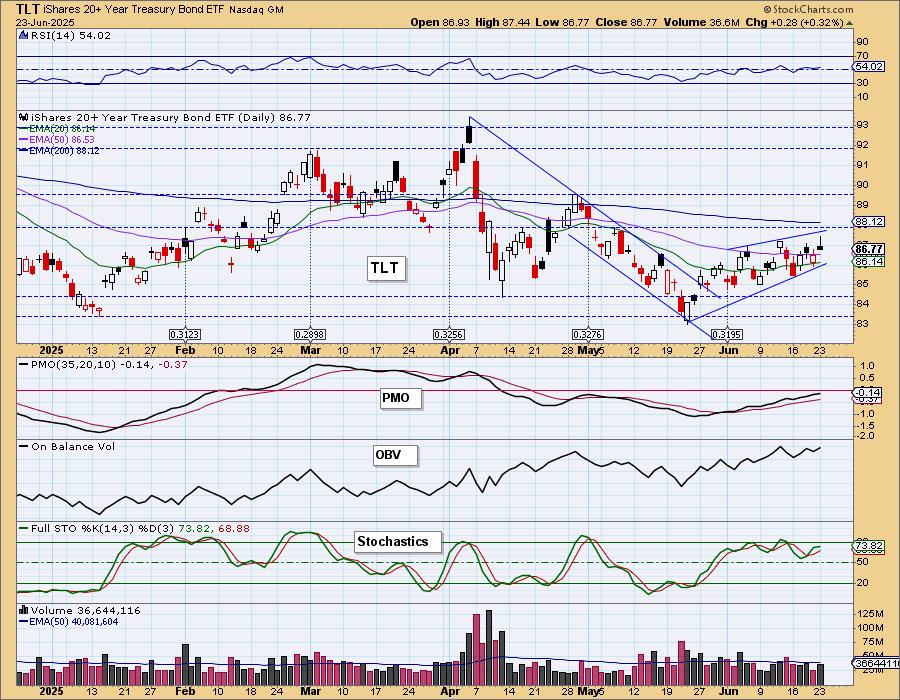
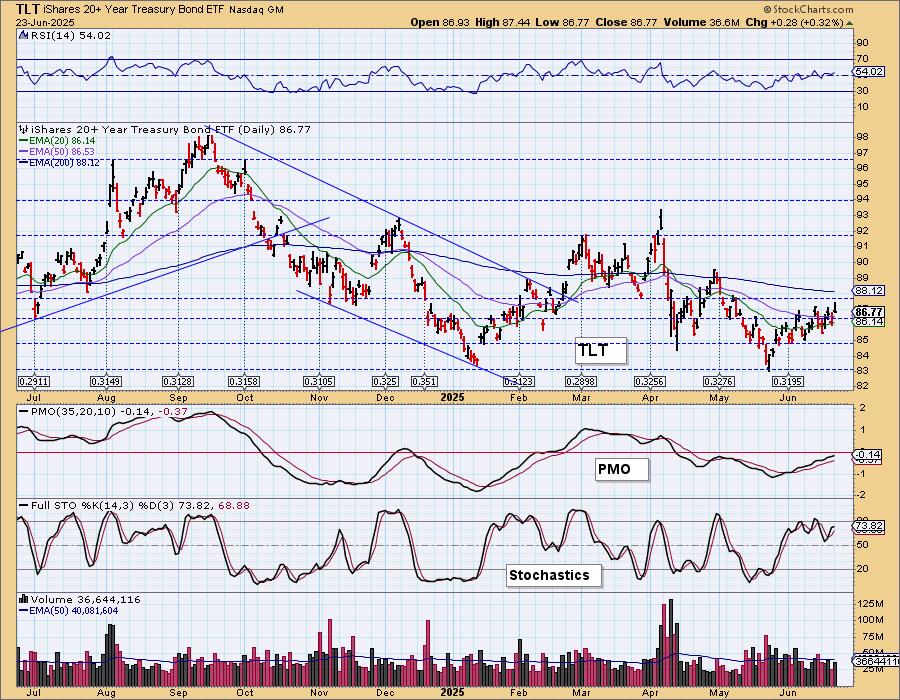
BONDS (TLT)
IT Trend Model: SELL as of 4/14/2025
LT Trend Model: SELL as of 12/13/2024
TLT Daily Chart: Bonds are traveling in a bearish rising wedge so we are expecting a breakdown soon. The PMO is still rising, but Stochastics are flattening out. Price hasn't hit the top of the wedge yet so there could be more upside before we get an eventual decline. The decline could start tomorrow though given the bearish filled black candlestick. It is also a shooting star candlestick which is also bearish.
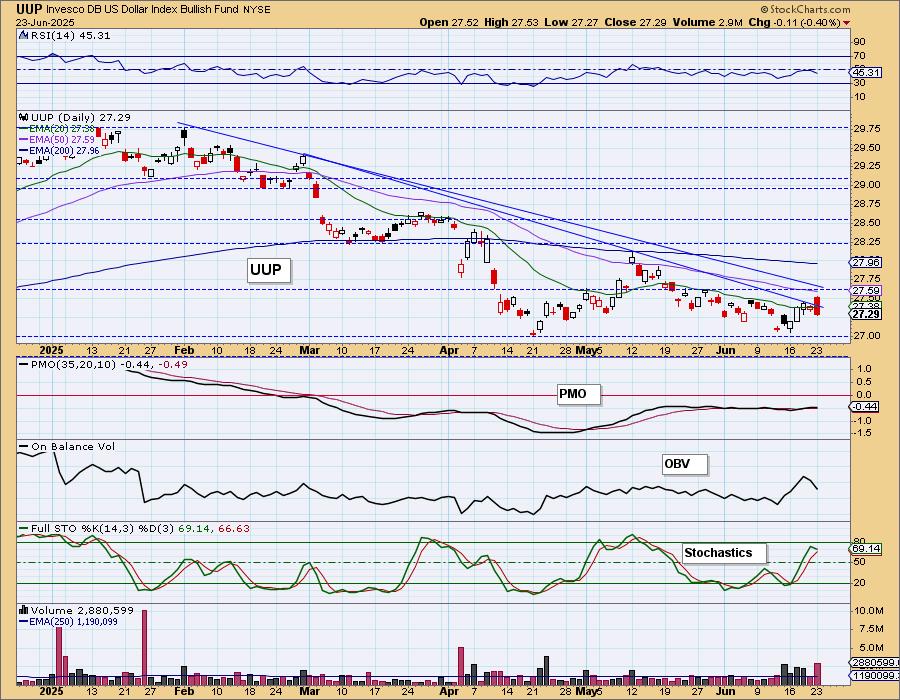
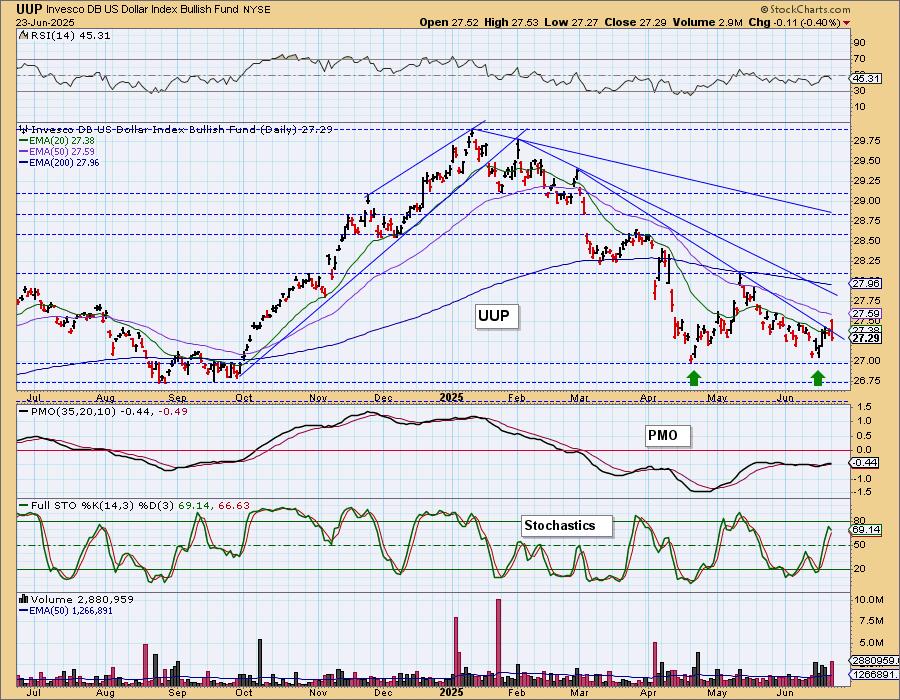
DOLLAR (UUP)
IT Trend Model: NEUTRAL as of 3/5/2025
LT Trend Model: SELL as of 4/25/2025
UUP Daily Chart: The Dollar formed a large bearish engulfing candlestick today. We do see that we did get a break from the near-term declining tops trendline. It is very close to testing the longer-term declining tops trendline. We think it could be forming a bullish double bottom, but today's candlestick does imply a decline ahead tomorrow.
Here is a better look at the bullish double bottom that is forming.
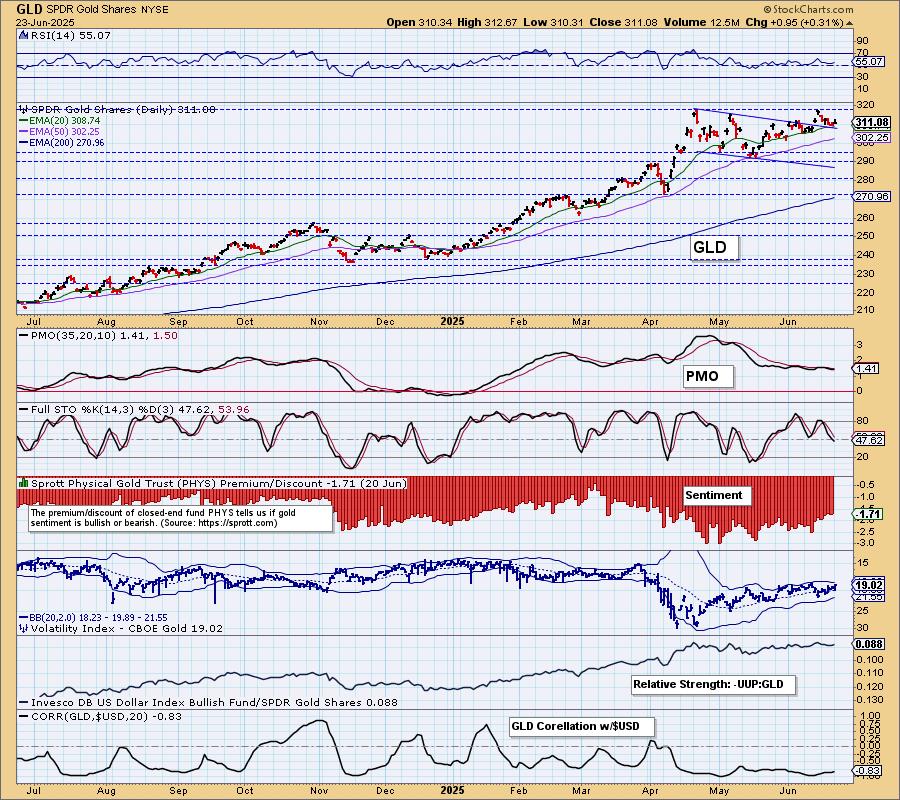
GOLD
IT Trend Model: BUY as of 1/10/2025
LT Trend Model: BUY as of 10/20/2023
GLD Daily Chart: The Dollar looks more bullish, but Gold is hanging in there. It is currently staying above a rising bottoms trendline. We could also look at this as a bullish ascending triangle (flat top, rising bottoms). We wouldn't count out Gold despite the falling PMO and Stochastics.
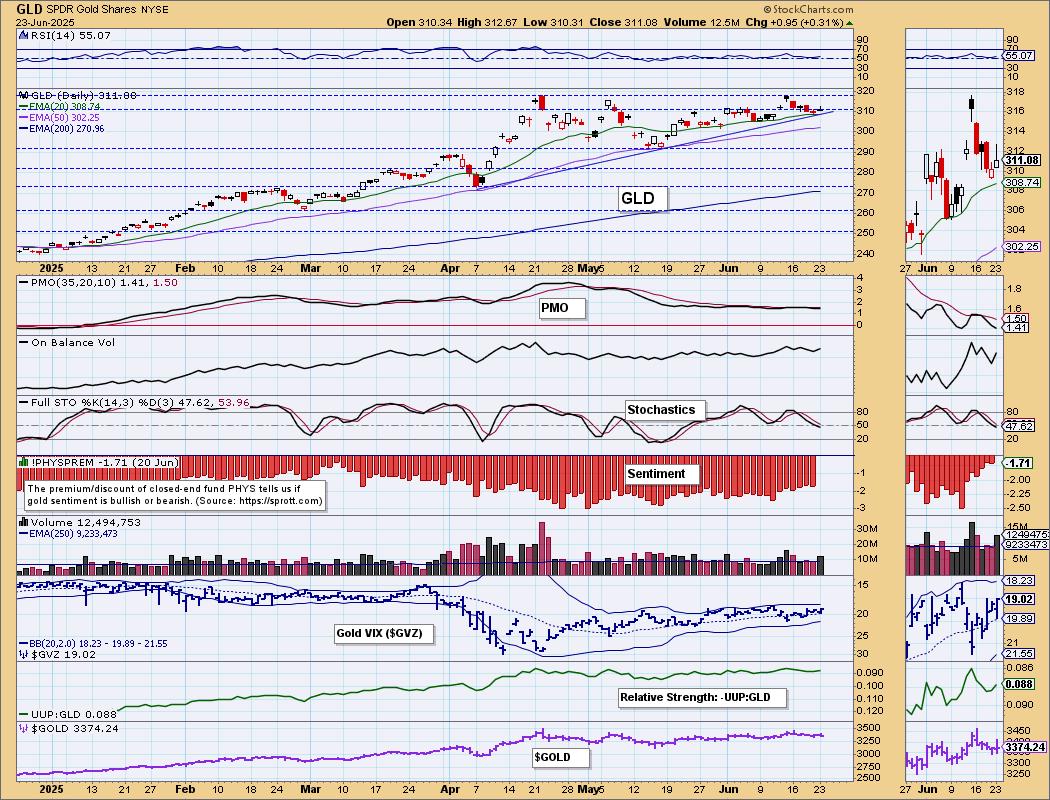
Discounts continue to pare back suggesting investors are more bullish on Gold than they have been. That could help Gold hold this rising trend.
GOLD MINERS (GDX) Daily Chart: It was a good day for Gold Miners. Unfortunately they are traveling within a bearish rising wedge that does suggest an eventual breakdown ahead. The PMO is on a new Crossover SELL Signal. Participation has weakened, but it is still holding at very high levels. GDX is vulnerable nonetheless.

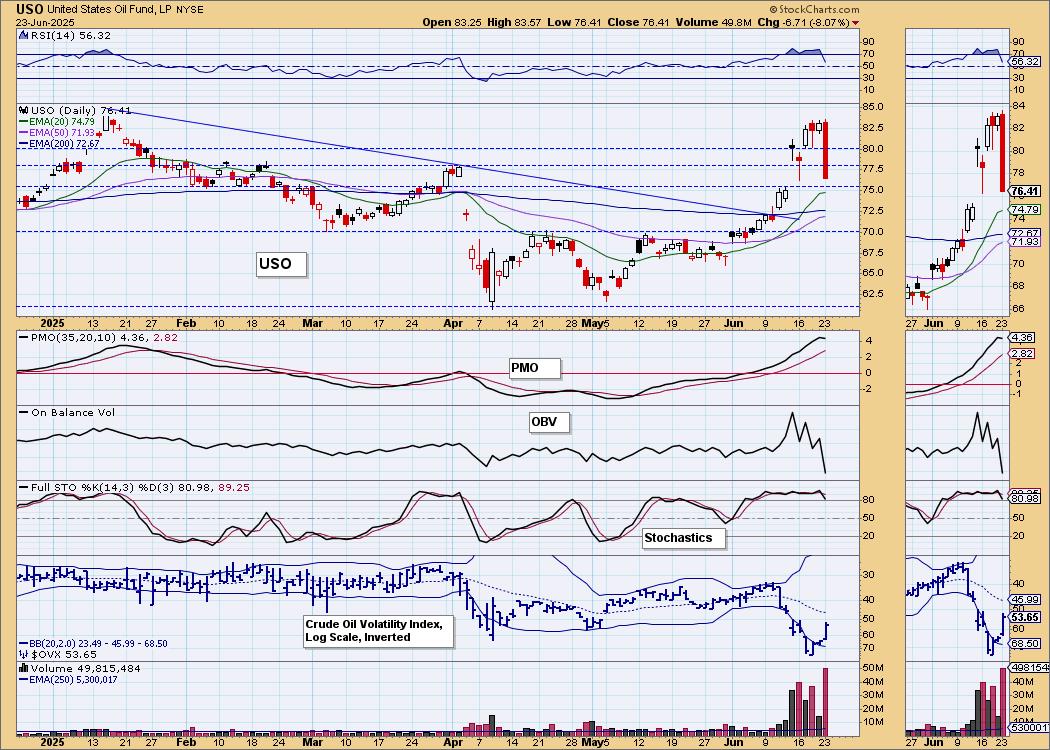
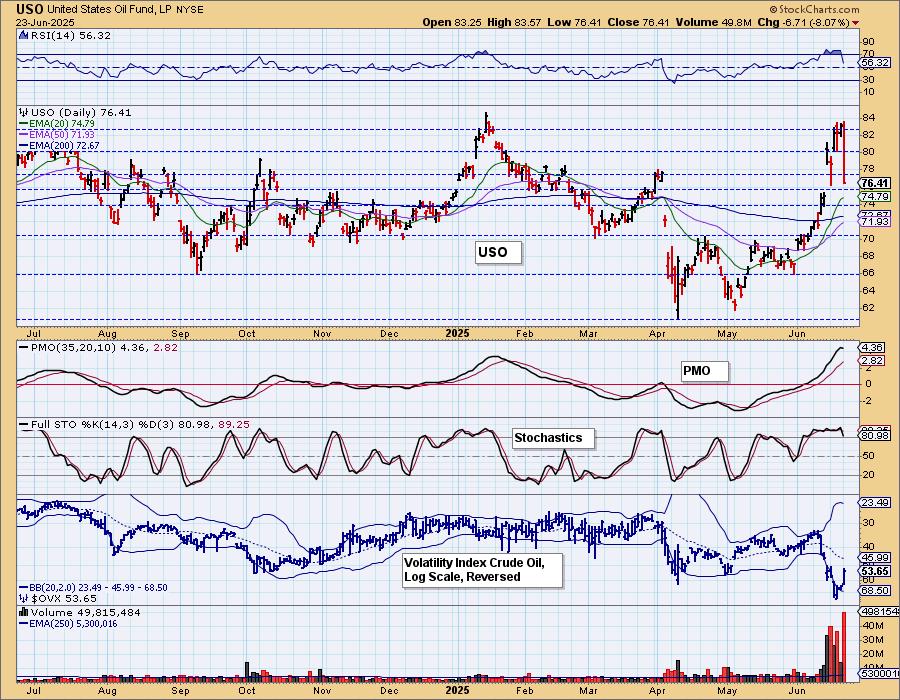
CRUDE OIL (USO)
IT Trend Model: BUY as of 6/11/2025
LT Trend Model: SELL as of 3/18/2025
USO Daily Chart: Crude Oil crashed today which was a bit surprising given the threat of the closing of the Strait of Hormuz, but the President did go to Truth Social asking that prices be kept lower to thwart the enemy. We're not so sure his posts made the difference, but who knows. We have been pointing out that price had gotten to the top of a years long trading range so technically it was due for a pullback. The PMO has topped along with Stochastics. We wouldn't be surprised if we saw a snapback rally, but ultimately we think it is time for prices to retreat.
Good Luck & Good Trading!
Erin Swenlin and Carl Swenlin
Technical Analysis is a windsock, not a crystal ball. --Carl Swenlin
(c) Copyright 2025 DecisionPoint.com
Disclaimer: This blog is for educational purposes only and should not be construed as financial advice. The ideas and strategies should never be used without first assessing your own personal and financial situation, or without consulting a financial professional. Any opinions expressed herein are solely those of the author, and do not in any way represent the views or opinions of any other person or entity.
DecisionPoint is not a registered investment advisor. Investment and trading decisions are solely your responsibility. DecisionPoint newsletters, blogs or website materials should NOT be interpreted as a recommendation or solicitation to buy or sell any security or to take any specific action.
NOTE: The signal status reported herein is based upon mechanical trading model signals, specifically, the DecisionPoint Trend Model. They define the implied bias of the price index based upon moving average relationships, but they do not necessarily call for a specific action. They are information flags that should prompt chart review. Further, they do not call for continuous buying or selling during the life of the signal. For example, a BUY signal will probably (but not necessarily) return the best results if action is taken soon after the signal is generated. Additional opportunities for buying may be found as price zigzags higher, but the trader must look for optimum entry points. Conversely, exit points to preserve gains (or minimize losses) may be evident before the model mechanically closes the signal.
Helpful DecisionPoint Links:
DecisionPoint Alert Chart List
DecisionPoint Golden Cross/Silver Cross Index Chart List
DecisionPoint Sector Chart List
Price Momentum Oscillator (PMO)