
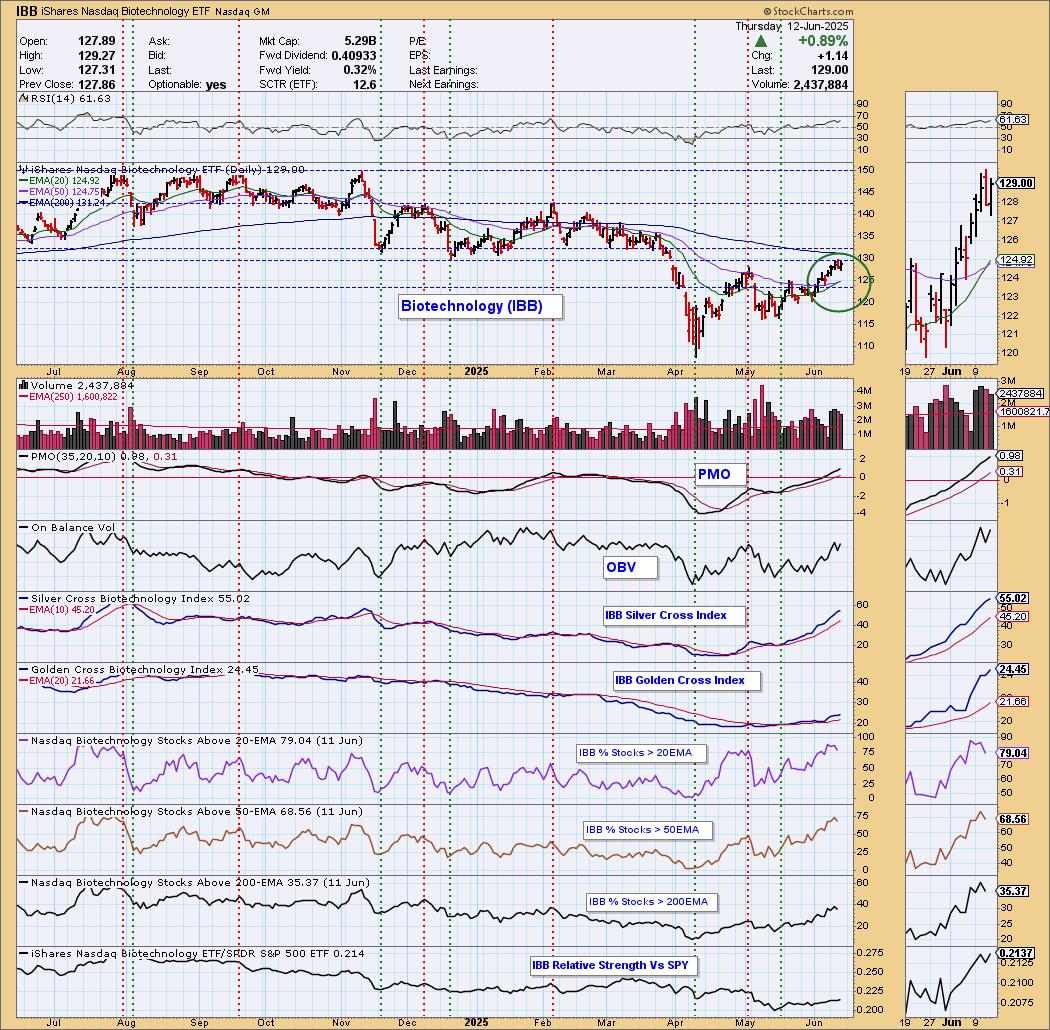
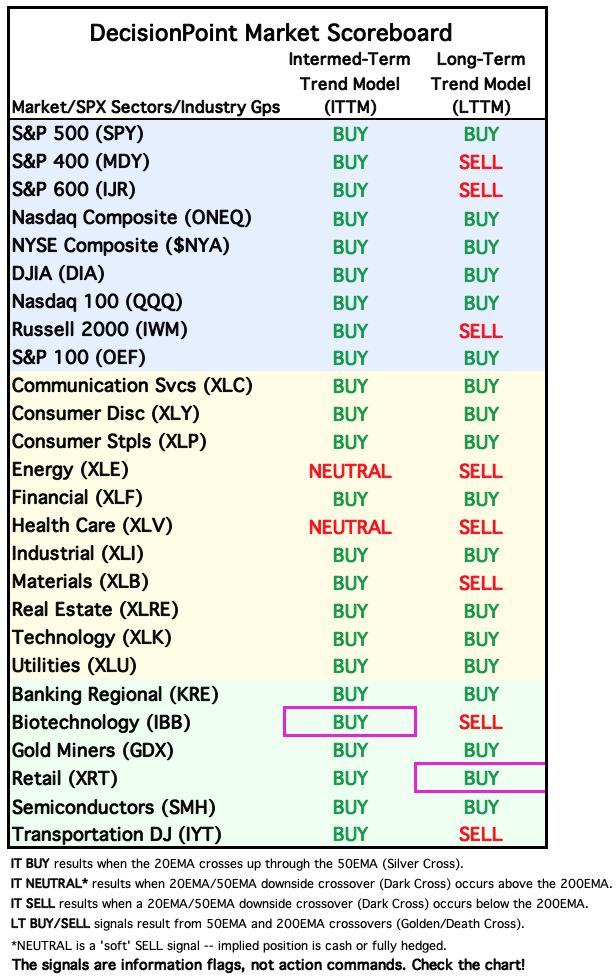
Today the Biotechnology ETF (IBB) 20-day EMA crossed up through the 50-day EMA (Silver Cross) generating an IT Trend Model BUY Signal. Price is now up against resistance and it was turned away with a lower high today. The rest of the chart is bullish given the rising PMO and strong participation so we could see a breakout here. It's beginning to outperform the SPY.
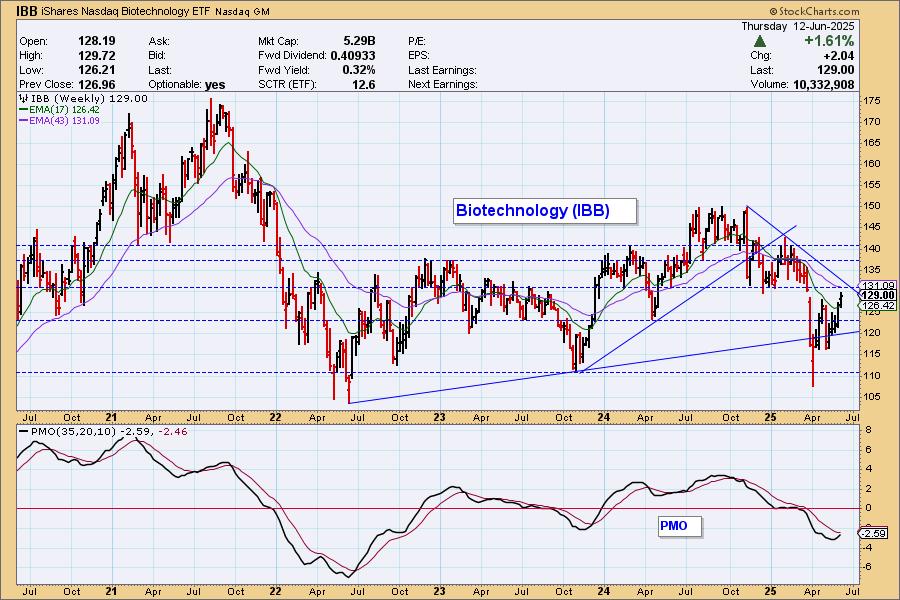
We think that you can look at recent price action as a bullish double bottom, but price does remain in a declining trend. The weekly PMO does look encouraging as it rises toward a Crossover BUY Signal.
__________
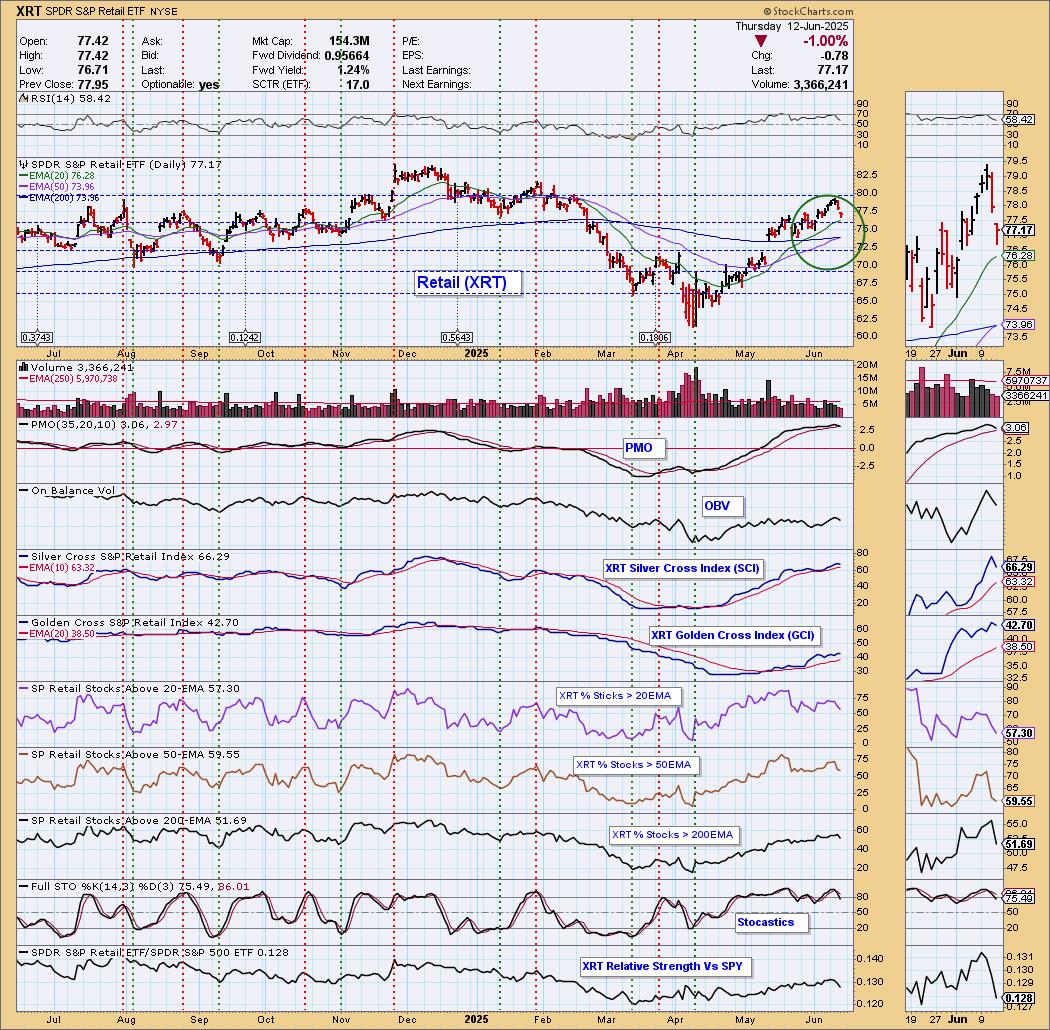
Also today, the Retail ETF (XRT) 50-day EMA crossed up through the 200-day EMA (Golden Cross), generating an LT Trend Model BUY Signal. We have a very nice rising trend, but price is beginning to show weakness after being turned away from resistance. The PMO has also topped. Participation is leaking out. We have negative divergences between price and %Stocks > 20/50EMAs. We believe caution is warranted.
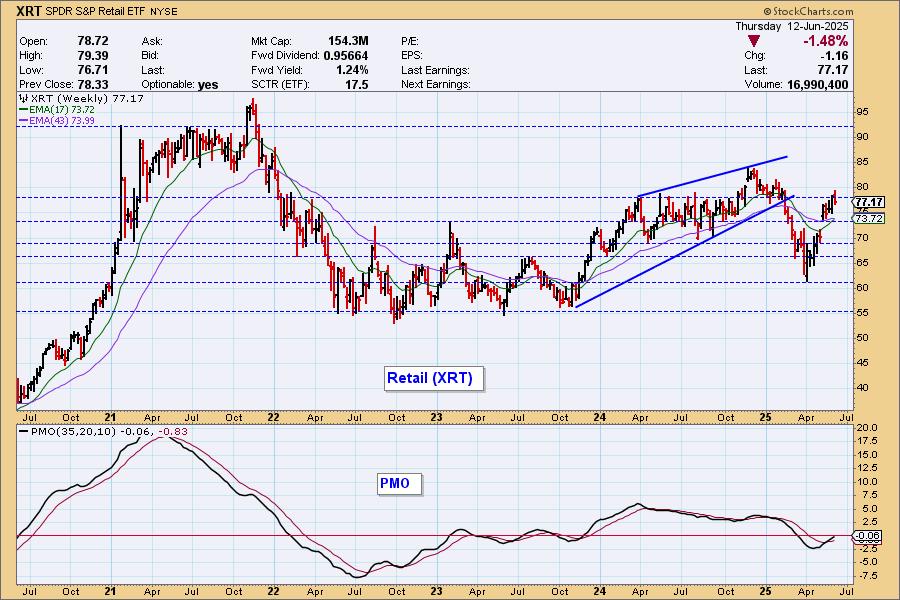
As with many weekly charts, we have a bullish "V" Bottom that does imply we'll see a breakout above the left side of the "V". We are sitting at a strong resistance level so despite the rising weekly PMO, we would be careful in the shorter term.
The DecisionPoint Alert Weekly Wrap presents an end-of-week assessment of the trend and condition of the Stock Market, the U.S. Dollar, Gold, Crude Oil, and Bonds. The DecisionPoint Alert daily report (Monday through Thursday) is abbreviated and gives updates on the Weekly Wrap assessments.
MARKET/INDUSTRY GROUP/SECTOR INDEXES
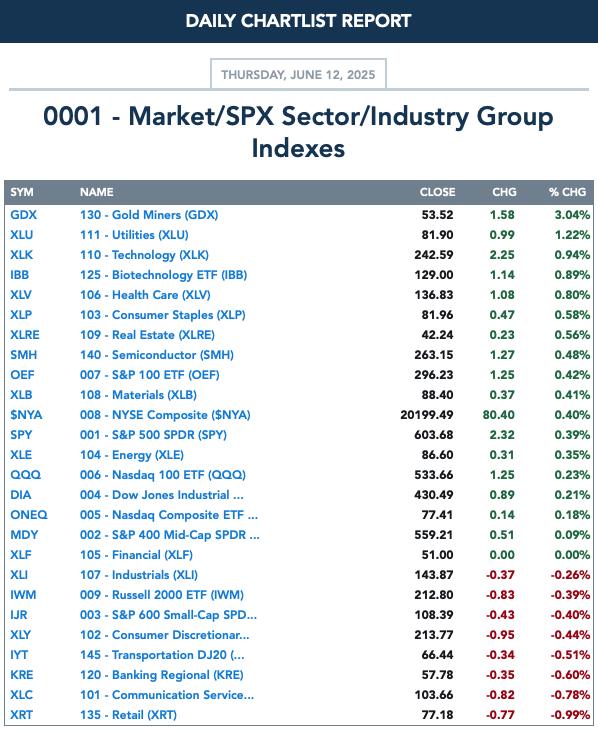
CLICK HERE for Carl's annotated Market Index, Sector, and Industry Group charts.
THE MARKET (S&P 500)
IT Trend Model: NEUTRAL as of 3/4/2025
LT Trend Model: SELL as of 4/16/2025
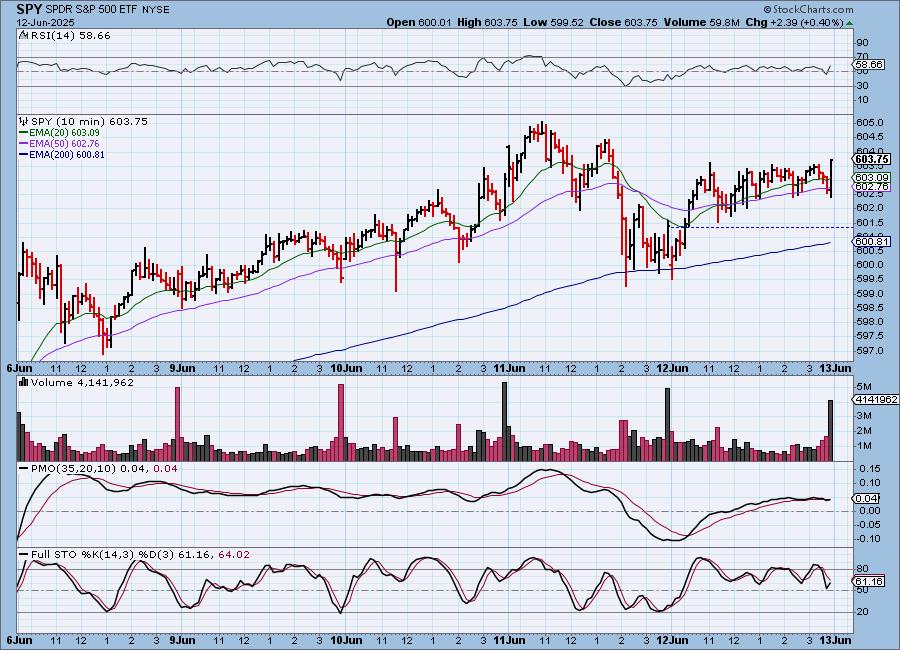
SPY 10-Minute Chart: Price was up the majority of the day. It is bullish that price did close on its high for the day. The 10-minute PMO did turn up to finish trading as did Stochastics so we could see some follow-through.
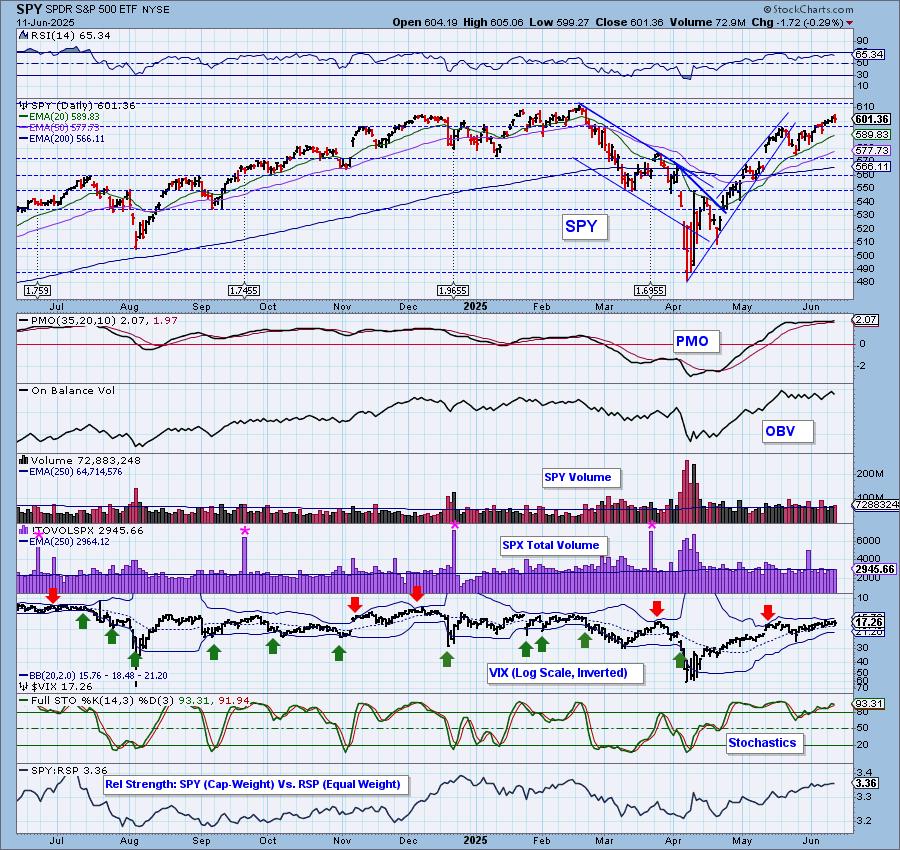
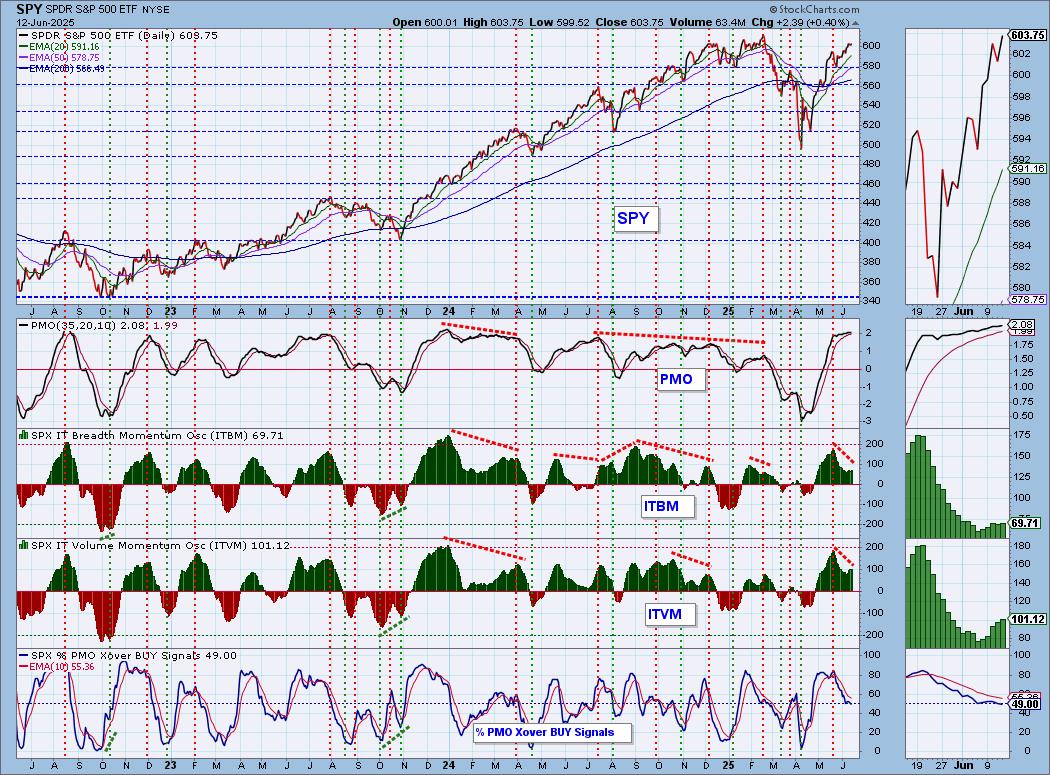
SPY Daily Chart: Price saw a lower high today so technically we have a price top. The rising trend remains intact, but it appears we are getting some trepidation as we near all-time highs. The PMO still looks very good flat above the zero line which does imply strength in the current move.
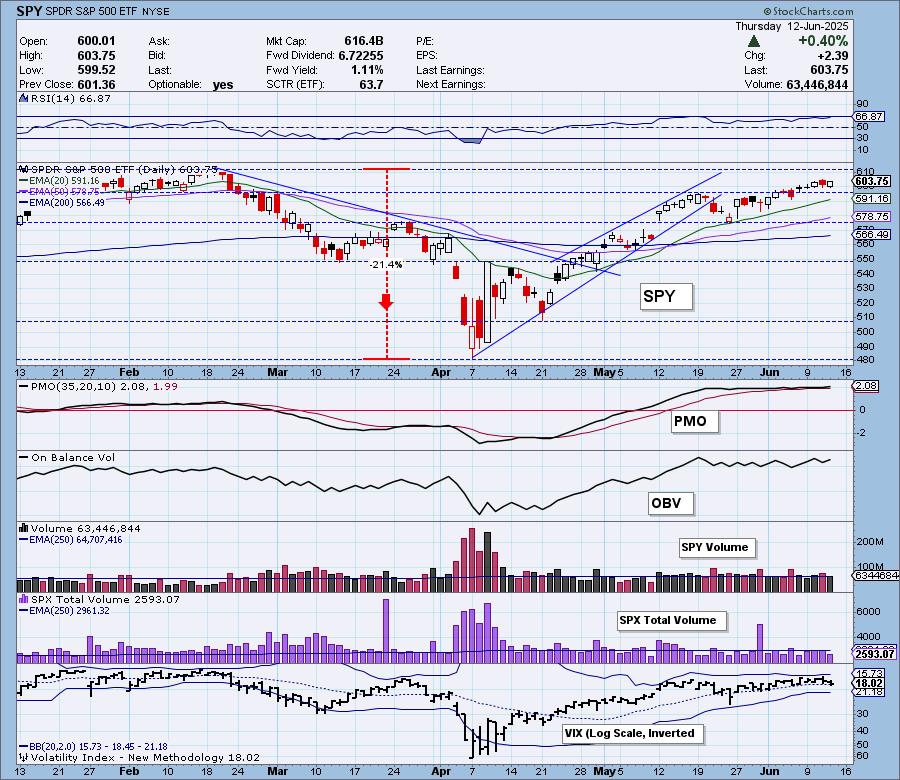
The VIX is still holding above its moving average on the inverted scale. And while Stochastics did top, they are above 80 implying internal strength.
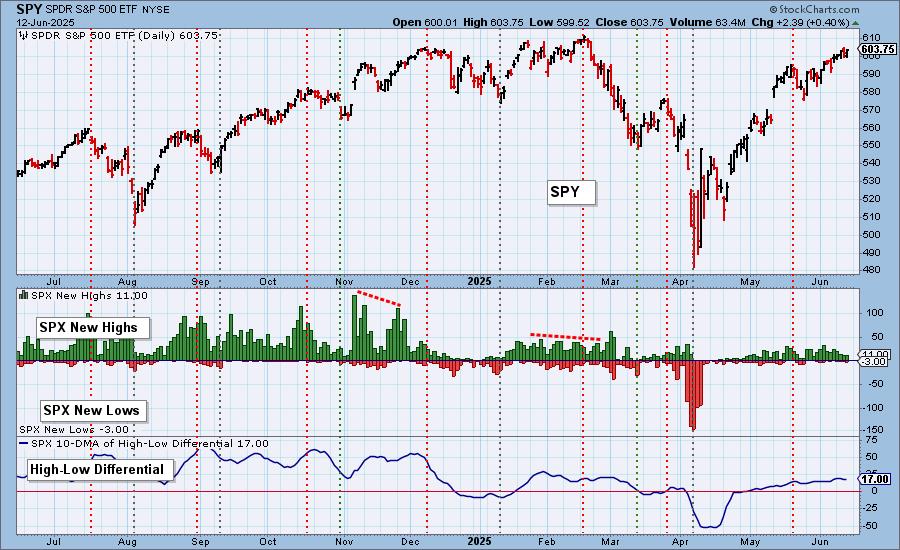
S&P 500 New 52-Week Highs/Lows: New Highs held at the same reading on today's rally. We would've expected more. New Lows did expand slightly. The High-Low Differential is still declining.
Climax* Analysis: There were no climax readings today.
*A climax is a one-day event when market action generates very high readings in, primarily, breadth and volume indicators. We also include the VIX, watching for it to penetrate outside the Bollinger Band envelope. The vertical dotted lines mark climax days -- red for downside climaxes, and green for upside. Climaxes are at their core exhaustion events; however, at price pivots they may be initiating a change of trend.
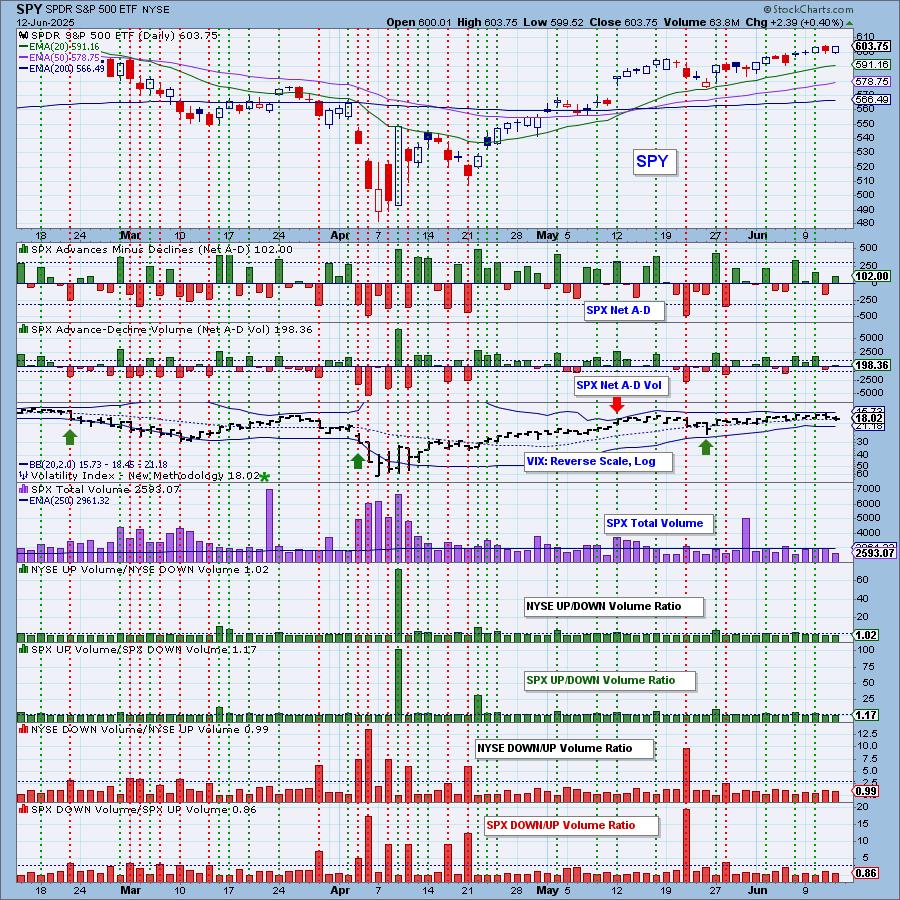
Short-Term Market Indicators: The short-term market trend is UP and the condition is NEUTRAL.
The Swenlin Trading Oscillators (STOs) both rose strongly today. They unfortunately still hold negative divergences with price tops. Participation was up very slightly. We saw a few more rising PMOs, but the indicator is still bearish as it reads below our 50% bullish threshold.
Intermediate-Term Market Indicators: The intermediate-term market trend is UP and the condition is NEUTRAL.
Both the ITBM and ITVM rose on the day which is bullish. However, both hold negative divergences with price. %PMO Xover BUY Signals dropped below our bullish 50% threshold.
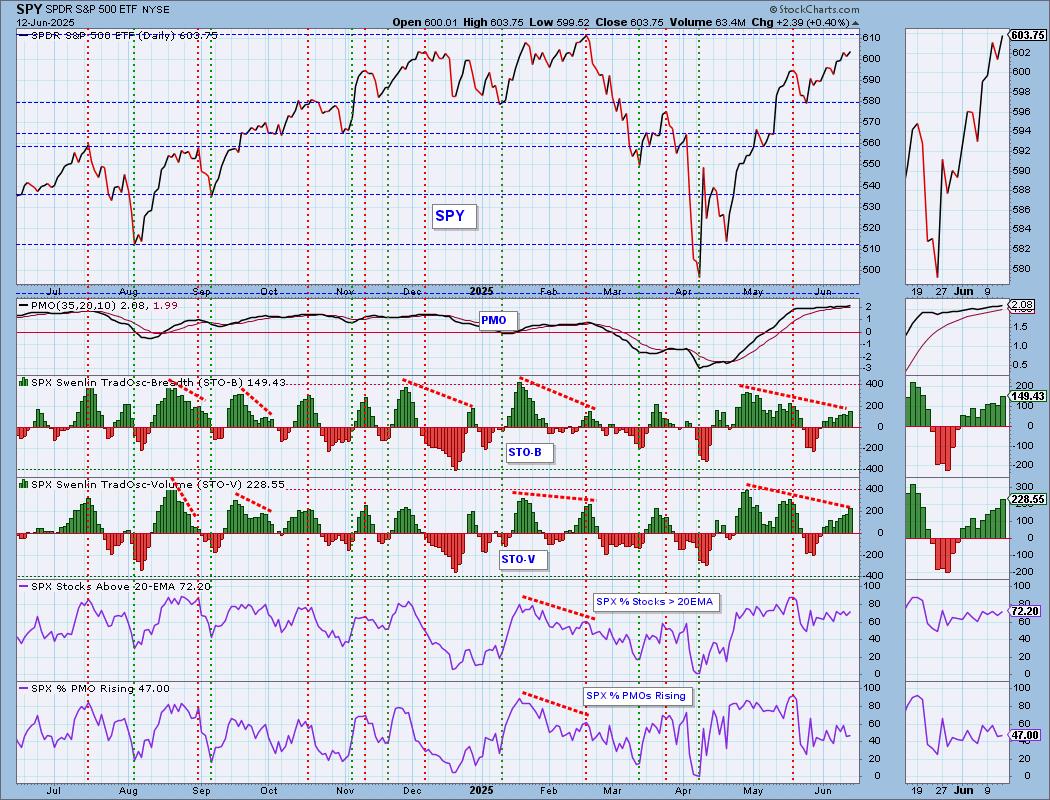
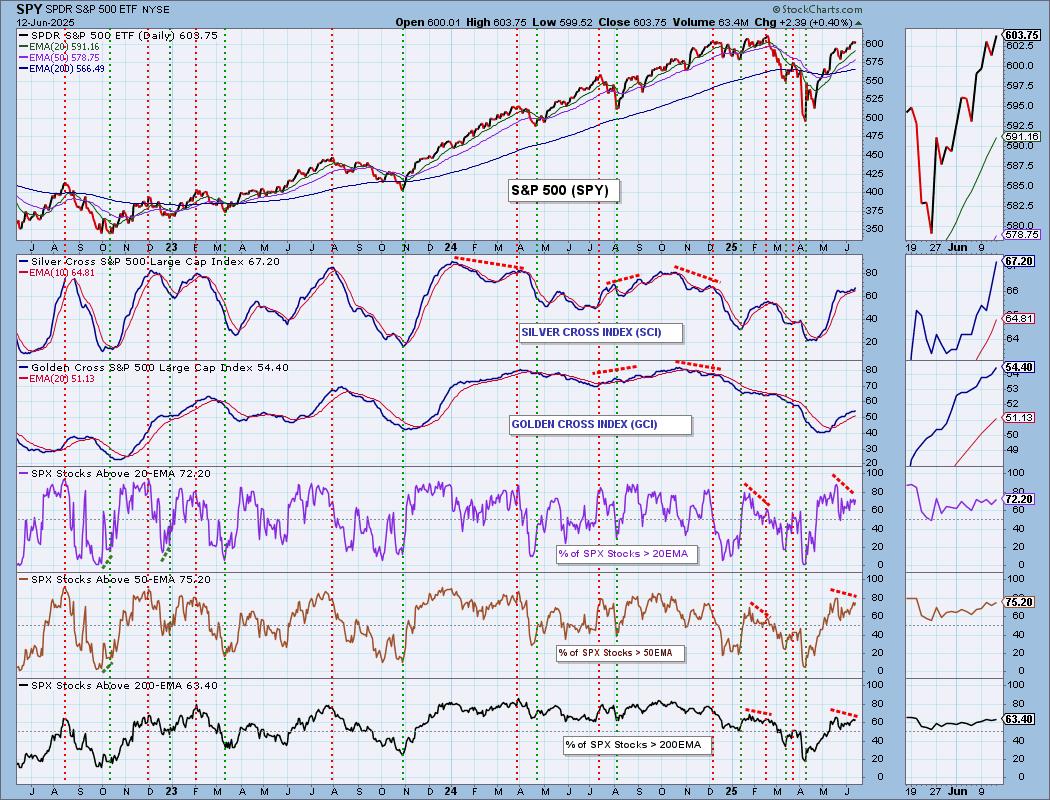
PARTICIPATION CHART (S&P 500): The following chart objectively shows the depth and trend of participation for the SPX in two time frames.
- Intermediate-Term - the Silver Cross Index (SCI) shows the percentage of SPX stocks on IT Trend Model BUY signals (20-EMA > 50-EMA). The opposite of the Silver Cross is a "Dark Cross" -- those stocks are, at the very least, in a correction.
- Long-Term - the Golden Cross Index (GCI) shows the percentage of SPX stocks on LT Trend Model BUY signals (50-EMA > 200-EMA). The opposite of a Golden Cross is the "Death Cross" -- those stocks are in a bear market.
The market bias is BULLISH in the intermediate and long terms.
Participation readings remained about the same today. Their readings are certainly healthy enough to fuel more rally. One problem is the negative divergences on participation. The Silver Cross Index is rising strongly for now. It is very quickly reaching the heights of participation above the 20/50-day EMAs so it could turn down soon. It is above its signal line so the IT Bias is BULLISH. The Golden Cross Index is still on the rise and could continue in that direction as it is reading well below participation of stocks above their 50/200-day EMAs. It is above its signal line so the LT Bias is BULLISH.
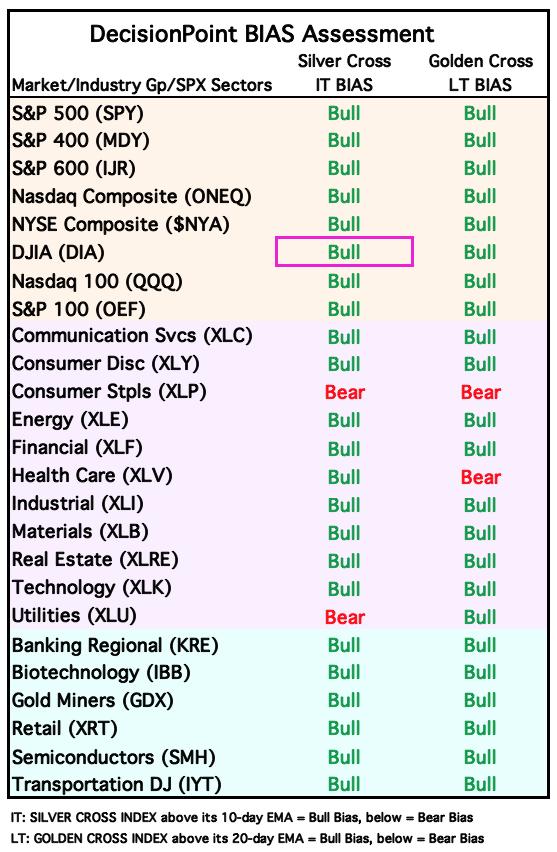
BIAS Assessment: The following table expresses the current BIAS of various price indexes based upon the relationship of the Silver Cross Index to its 10-day EMA (intermediate-term), and of the Golden Cross Index to its 20-day EMA (long-term). When the Index is above the EMA it is bullish, and it is bearish when the Index is below the EMA. The BIAS does not imply that any particular action should be taken. It is information to be used in the decision process.
The items with highlighted borders indicate that the BIAS changed today.
*****************************************************************************************************
CONCLUSION: The STO-B and ITBM both turned back up today. Participation remains at healthy levels although we do need to see more PMOs rising and more PMO BUY Signals within the index. The primary problem we see are the many negative divergences on nearly all of our indicators. This is a dangerous condition. For now, the PMO and Stochastics look very bullish and with the STOs/ITBM/ITVM rising again we do think that market could inch higher from here. Caution is warranted given all of the negative divergences.
Erin is 60% long, 0% short. (This is intended as information, not a recommendation.)
*****************************************************************************************************
CALENDAR
BITCOIN
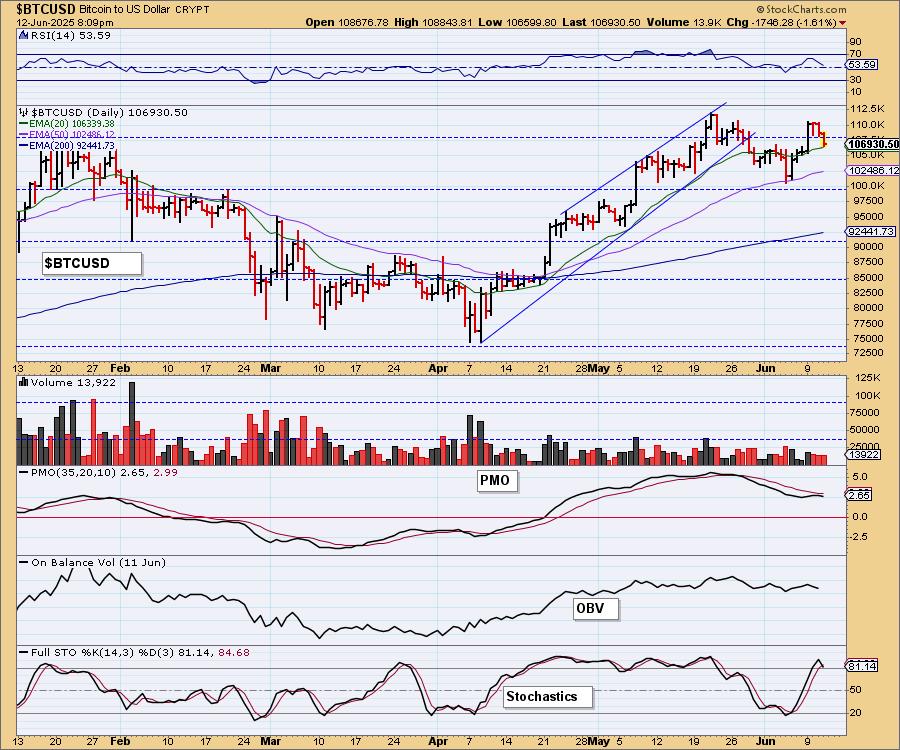
Bitcoin has started to pull back and that has caused the PMO to turn down below its signal line. This could indicate more decline ahead. We still like the bullish flag formation and Stochastics, while they have topped, are still strong above 80 so we do think the rally will get going again soon.
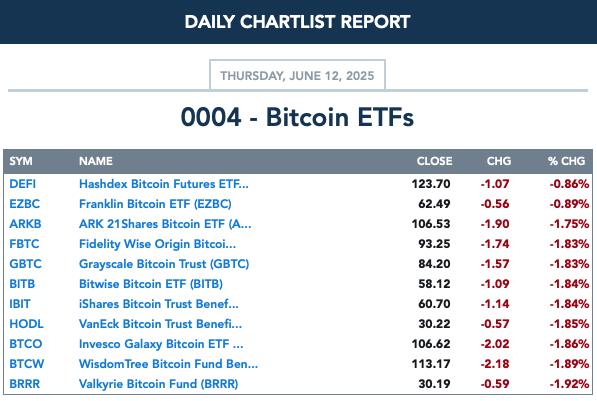
BITCOIN ETFs
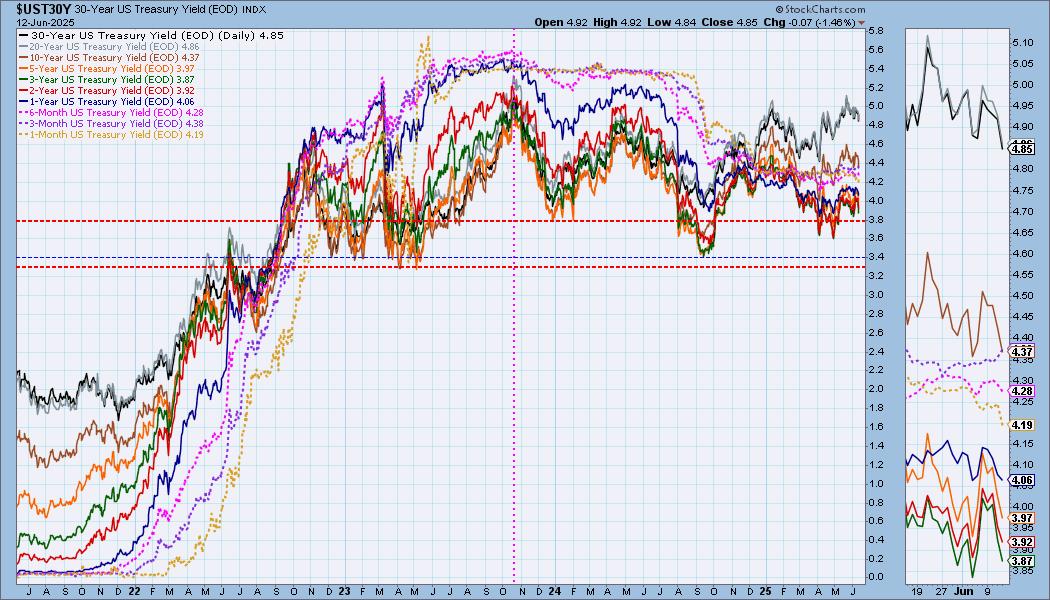
INTEREST RATES
Yields declined again today. They are setting up short-term declining trends so while we still think yields will remain elevated, they could see some more contraction.
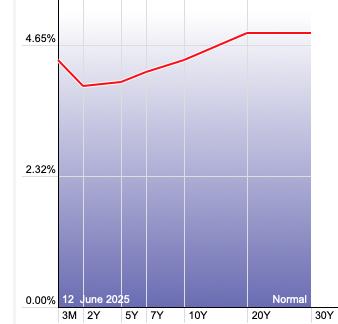
The Yield Curve Chart from StockCharts.com shows us the inversions taking place. The red line should move higher from left to right. Inversions are occurring where it moves downward.
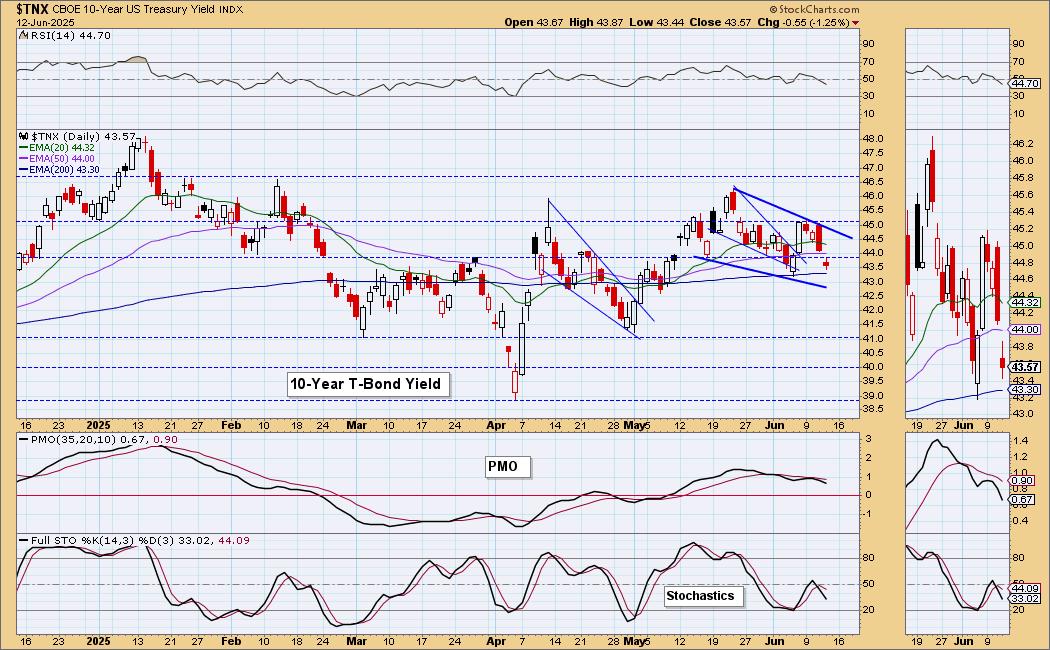
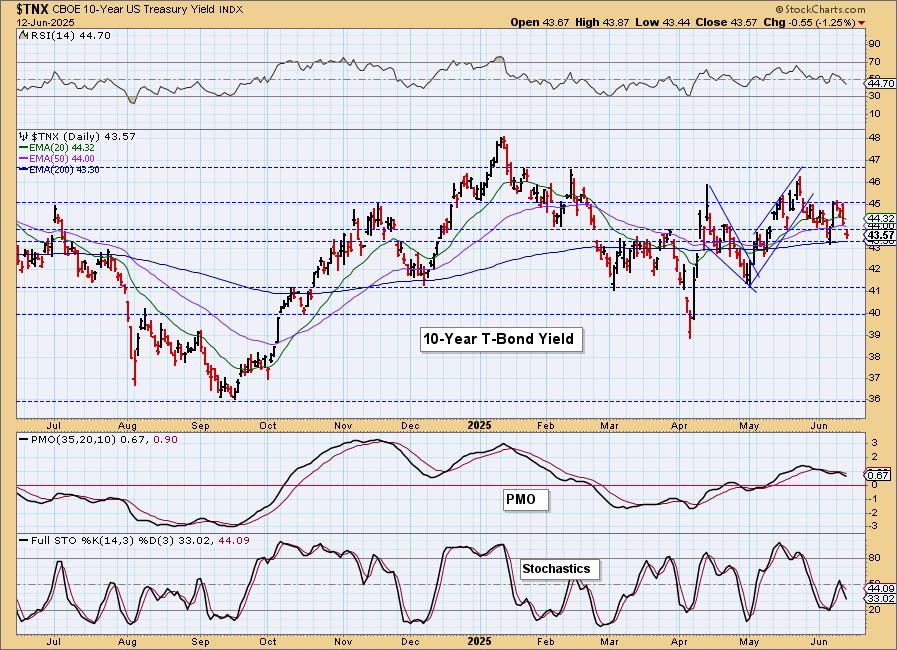
10-YEAR T-BOND YIELD
$TNX is now sitting on support at the 200-day EMA. Given the declining PMO we think this level of support won't hold. Stochastics are also headed lower. We do see the possibility of a new falling wedge, but for now we expect more decline.
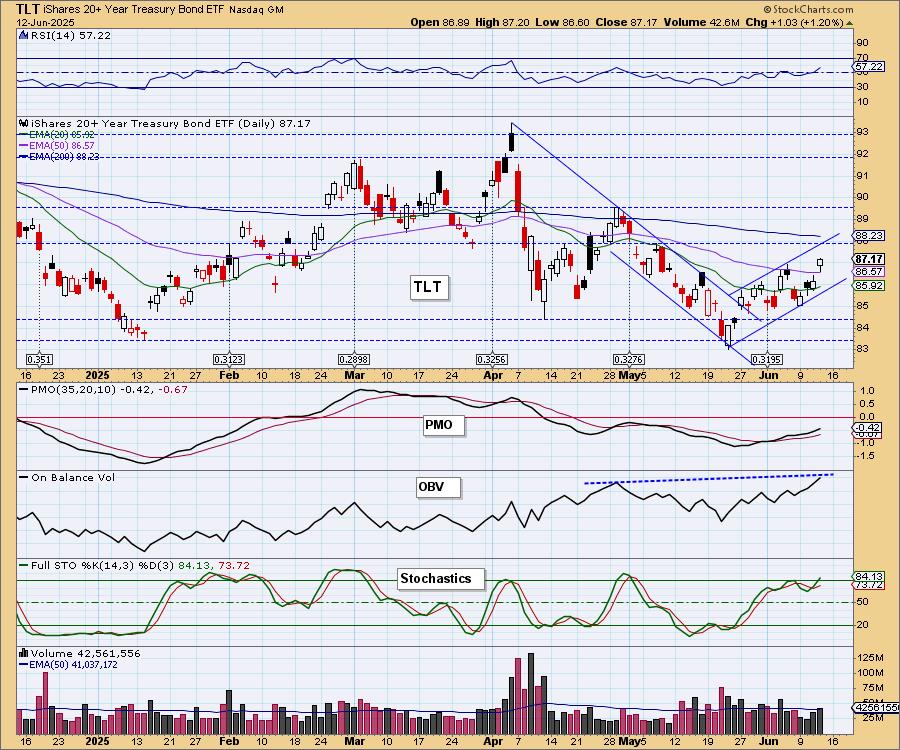
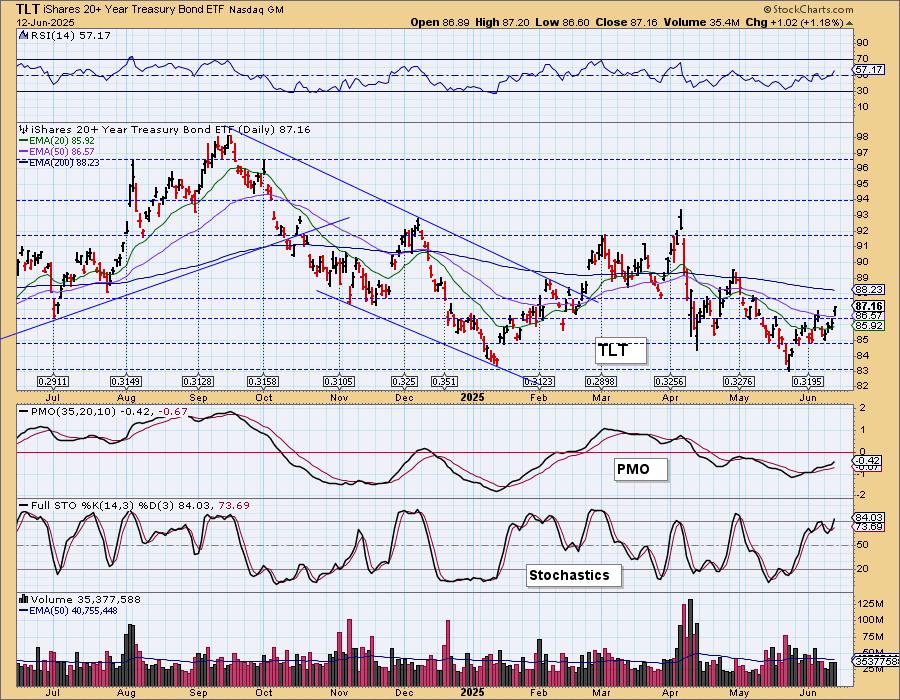
BONDS (TLT)
IT Trend Model: SELL as of 4/14/2025
LT Trend Model: SELL as of 12/13/2024
TLT Daily Chart: TLT is making its way higher in a bullish rising trend channel. With yields looking bearish right now, we do expect more upside for TLT. The RSI is positive and not overbought yet. The PMO is rising nicely and Stochastics just pushed above 80. One thing that does bother us about the chart is the reverse divergence on the OBV. Its latest high is above the previous top at the April top while price hasn't overcome that top. With large volume going in, price should've made its way higher and it didn't.
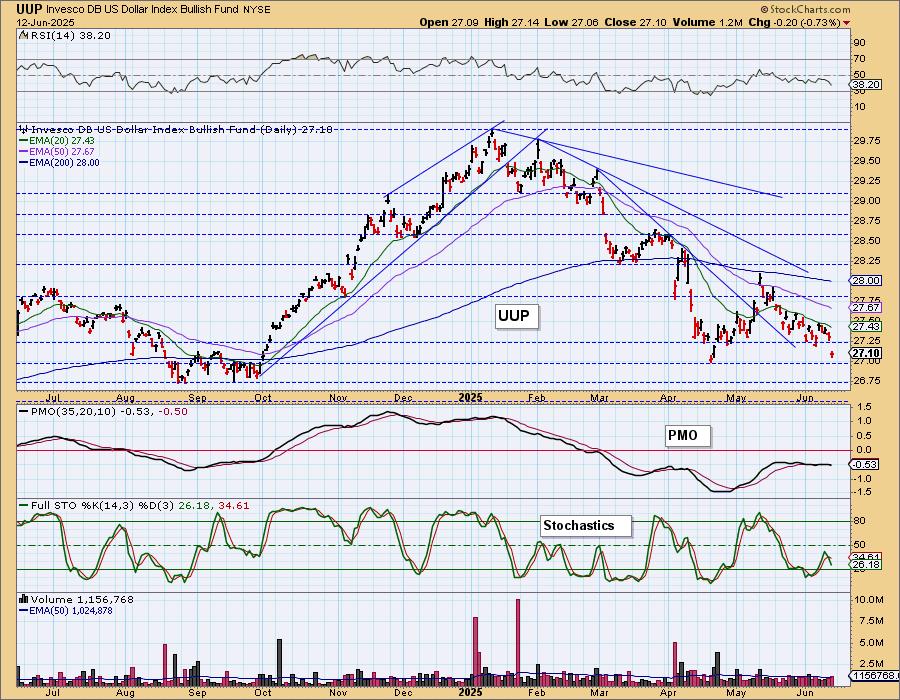
DOLLAR (UUP)
IT Trend Model: NEUTRAL as of 3/5/2025
LT Trend Model: SELL as of 4/25/2025
UUP Daily Chart: The Dollar gapped down today displaying more weakness. Price is about to reach support, but given the PMO Crossover SELL Signal below the zero line, we don't expect it to hold. Stochastics also topped in negative territory. We would look for support to be broken soon.
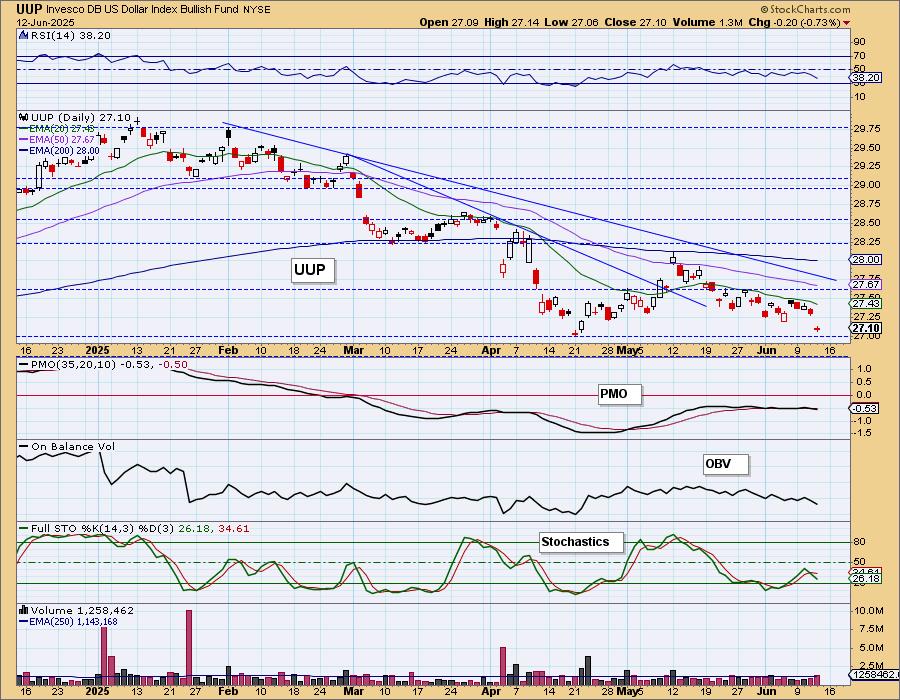
We do see some support available at 26.75 if this line is broken.
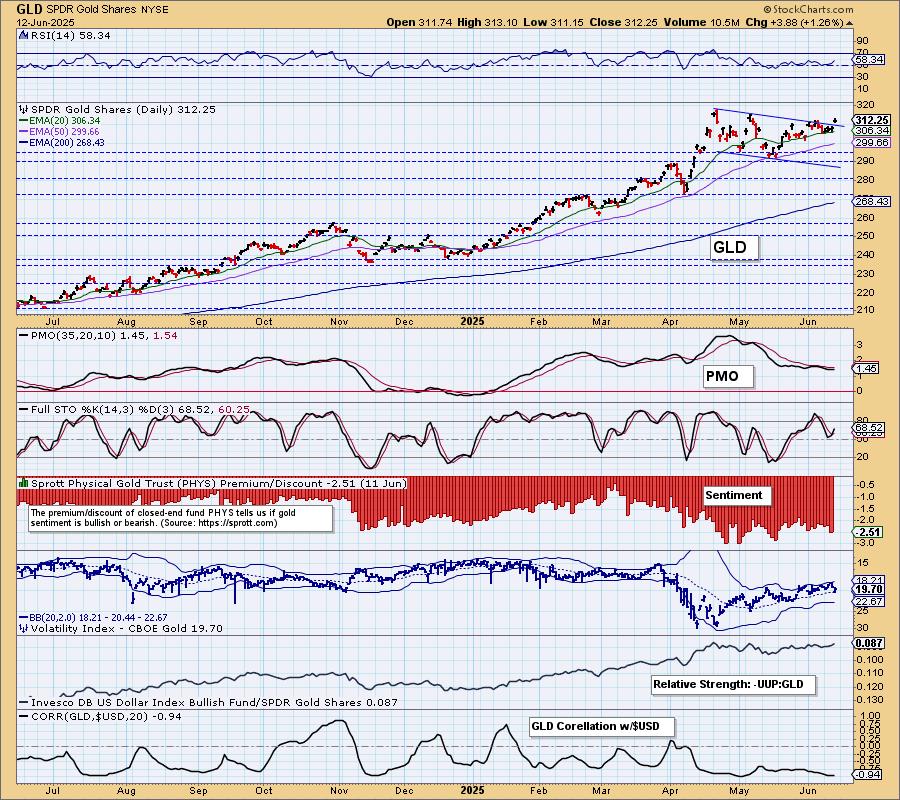
GOLD
IT Trend Model: BUY as of 1/10/2025
LT Trend Model: BUY as of 10/20/2023
GLD Daily Chart: Gold rallied strongly on the Dollar's weakness today. It was up more than the Dollar was down so we had additional buyers come in on the rally. Stochastics have turned back as has the PMO. This was a tiny breakout above resistance and there is more resistance ahead, but this was a very bullish move. We are at risk for a reverse island which would mean a gap down soon, but for now we are looking for more upside.
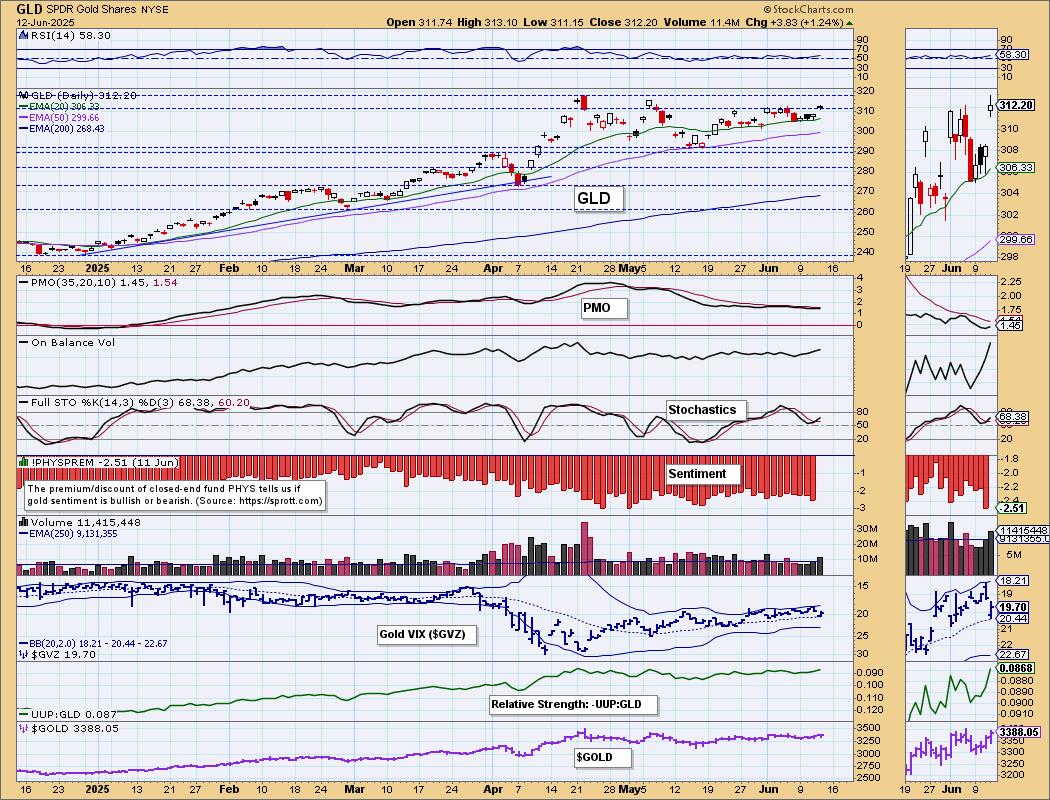
Discounts popped yesterday and are nearing extremes again. That generally works in its favor although they have been quite elevated throughout this consolidation or the formation of the current flag on a flagpole. Note that the correlation with the Dollar is very negative. This will work in Gold's favor as the Dollar remains weak.
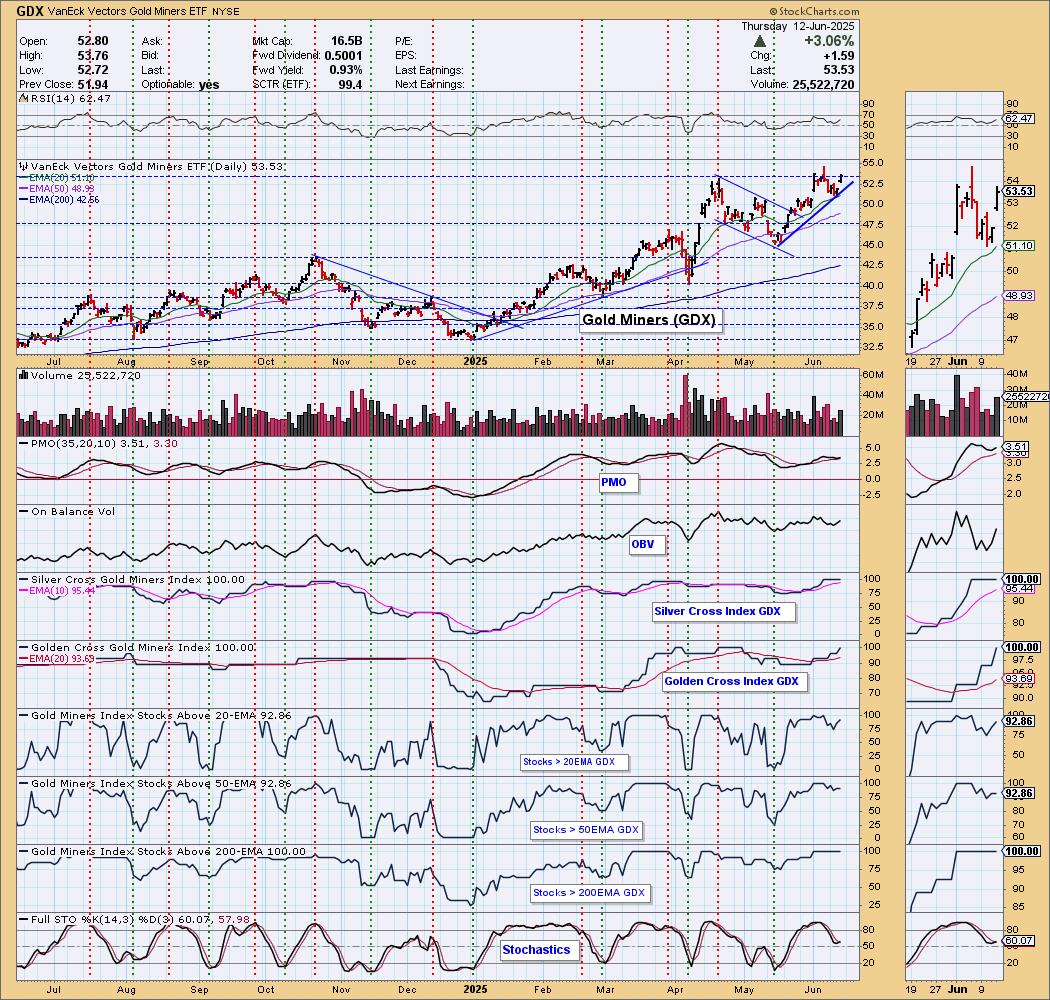
GOLD MINERS (GDX) Daily Chart: We were unsure about GDX yesterday, but we now have a nice rising bottoms trendline. Price does look ready to breakout once again. The PMO has surged above the signal line and participation remains very high. Stochastics turned up in positive territory. We think there is more upside available here.
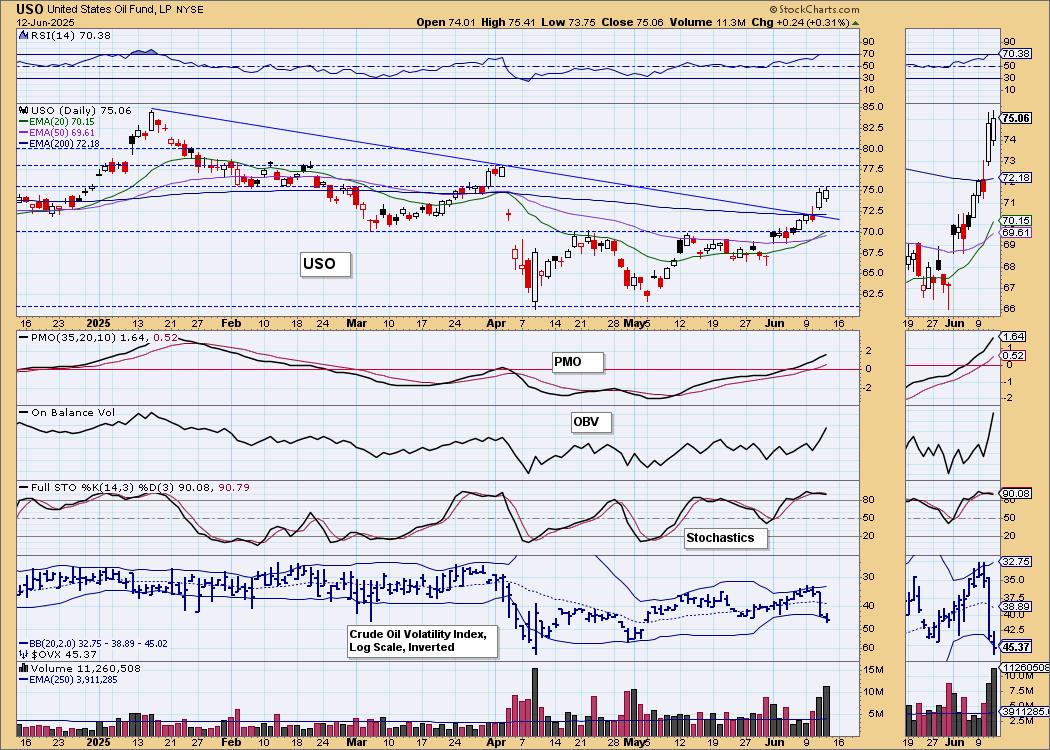
CRUDE OIL (USO)
IT Trend Model: BUY as of 6/11/2025
LT Trend Model: SELL as of 3/18/2025
USO Daily Chart: Crude Oil looks very bullish on this new rally that took it out of the declining trend and above the 200-day EMA. Yesterday's Silver Cross also confirms this rally. The PMO is rising above the zero line and Stochastics are holding above 80. It is due for a pullback as the RSI just moved into overbought territory. Overall we like Crude Oil and think we could get a move up to 77.50 to test overhead resistance.

Good Luck & Good Trading!
Erin Swenlin and Carl Swenlin
Technical Analysis is a windsock, not a crystal ball. --Carl Swenlin
(c) Copyright 2025 DecisionPoint.com
Disclaimer: This blog is for educational purposes only and should not be construed as financial advice. The ideas and strategies should never be used without first assessing your own personal and financial situation, or without consulting a financial professional. Any opinions expressed herein are solely those of the author, and do not in any way represent the views or opinions of any other person or entity.
DecisionPoint is not a registered investment advisor. Investment and trading decisions are solely your responsibility. DecisionPoint newsletters, blogs or website materials should NOT be interpreted as a recommendation or solicitation to buy or sell any security or to take any specific action.
NOTE: The signal status reported herein is based upon mechanical trading model signals, specifically, the DecisionPoint Trend Model. They define the implied bias of the price index based upon moving average relationships, but they do not necessarily call for a specific action. They are information flags that should prompt chart review. Further, they do not call for continuous buying or selling during the life of the signal. For example, a BUY signal will probably (but not necessarily) return the best results if action is taken soon after the signal is generated. Additional opportunities for buying may be found as price zigzags higher, but the trader must look for optimum entry points. Conversely, exit points to preserve gains (or minimize losses) may be evident before the model mechanically closes the signal.
Helpful DecisionPoint Links:
DecisionPoint Alert Chart List
DecisionPoint Golden Cross/Silver Cross Index Chart List
DecisionPoint Sector Chart List
Price Momentum Oscillator (PMO)