
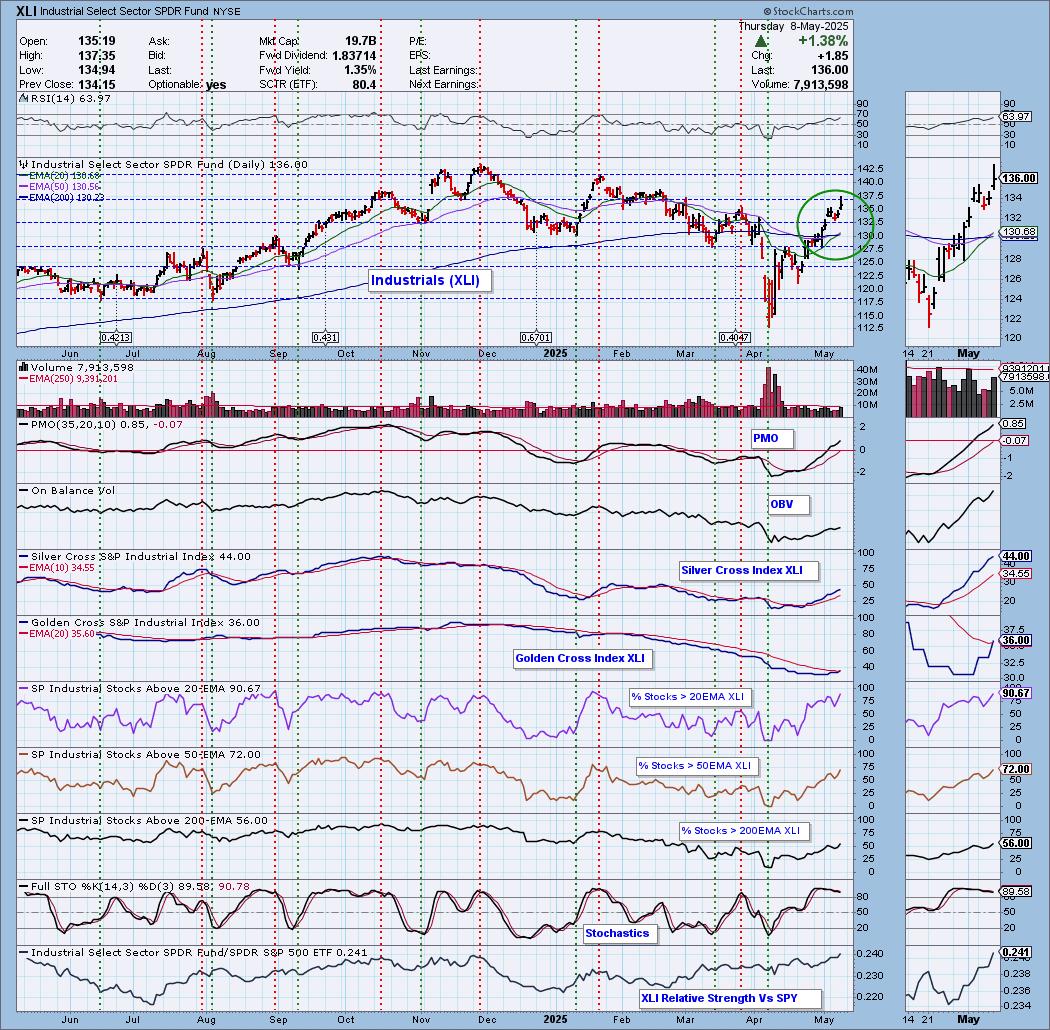
Today the Industrial Sector ETF (XLI) 20-day EMA crossed up through the 50-day EMA (Silver Cross) generating an IT Trend Model BUY Signal. XLI is on a strong rally and it looks as if it will challenge all-time highs very soon. Participation is very robust. The Silver Cross Index is rising strongly and the Golden Cross Index just moved above its signal line giving us a BULLISH LT Bias. Best of all, the RSI is not yet overbought and could accommodate more upside.
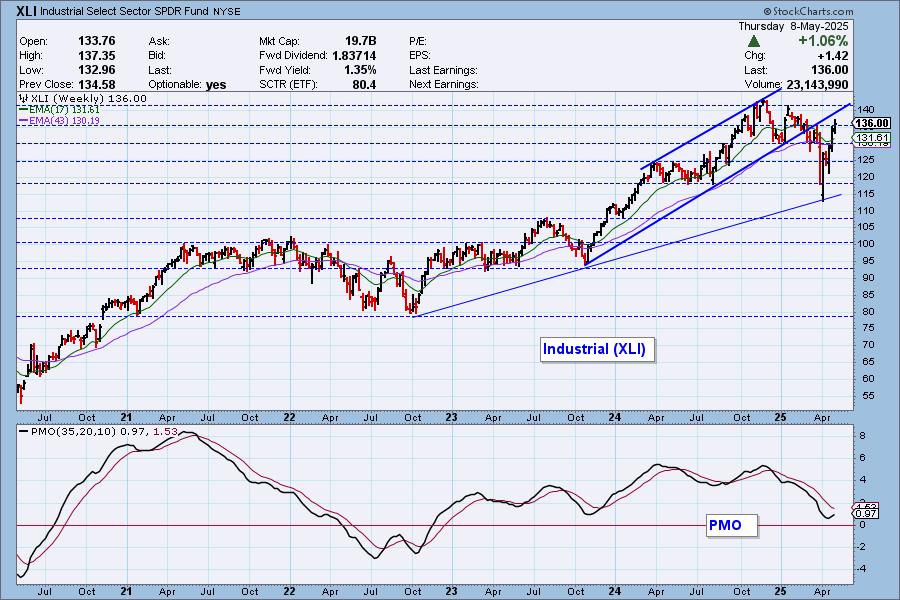
It bounced right off the rising bottoms trendline out of 2022 low and is headed back into the prior rising trend. The weekly PMO has turned up suggesting we could get more upside.
__________
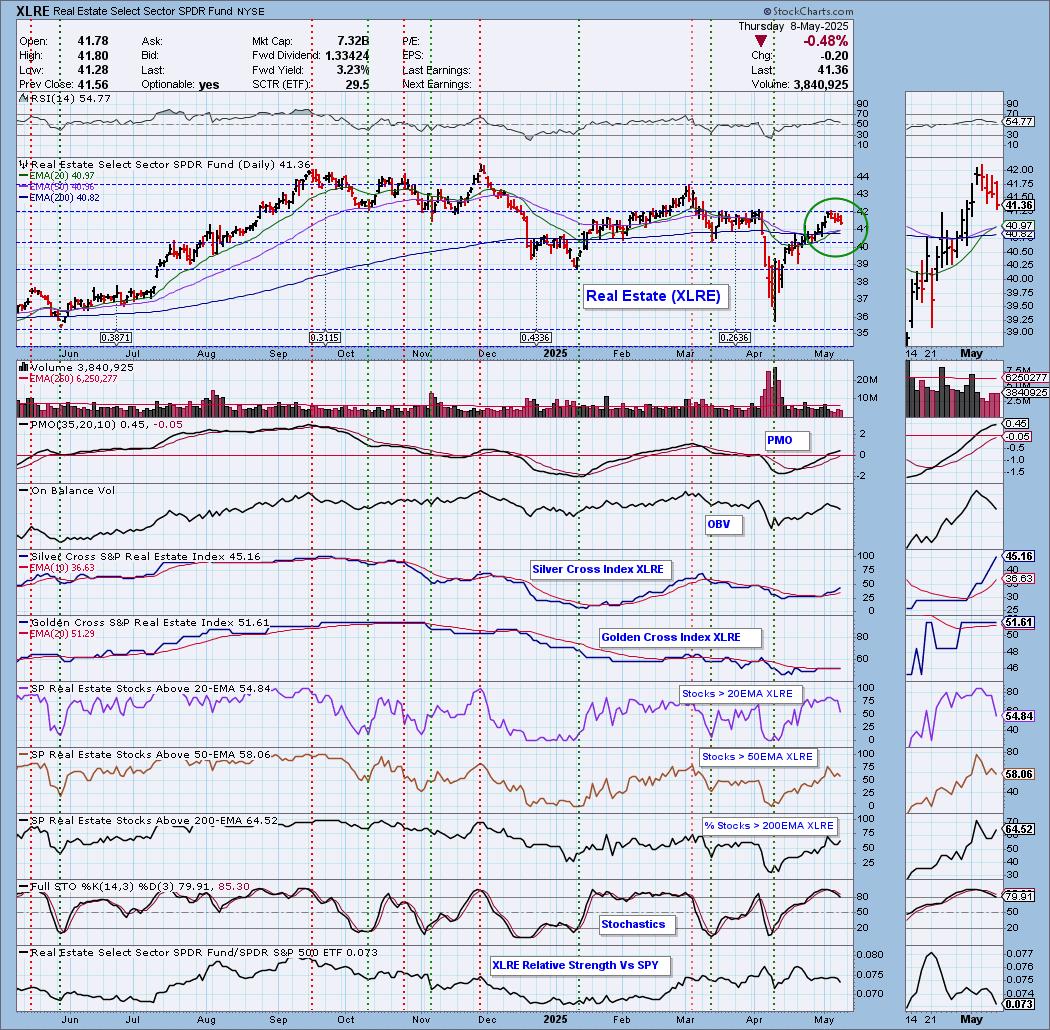
Also today, the Real Estate Sector ETF (XLRE) 20-day EMA crossed up through the 50-day EMA (Silver Cross) generating an IT Trend Model BUY Signal. XLRE is struggling a bit right now. If it drops below the 50-day EMA, the Silver Cross could be lost. Participation of stocks above their 20-day EMA is diving lower right now and Stochastics have dropped below 80. The Silver and Golden Cross Indexes are above their signal lines so the IT and LT Bias is BULLISH. It is in pullback mode.
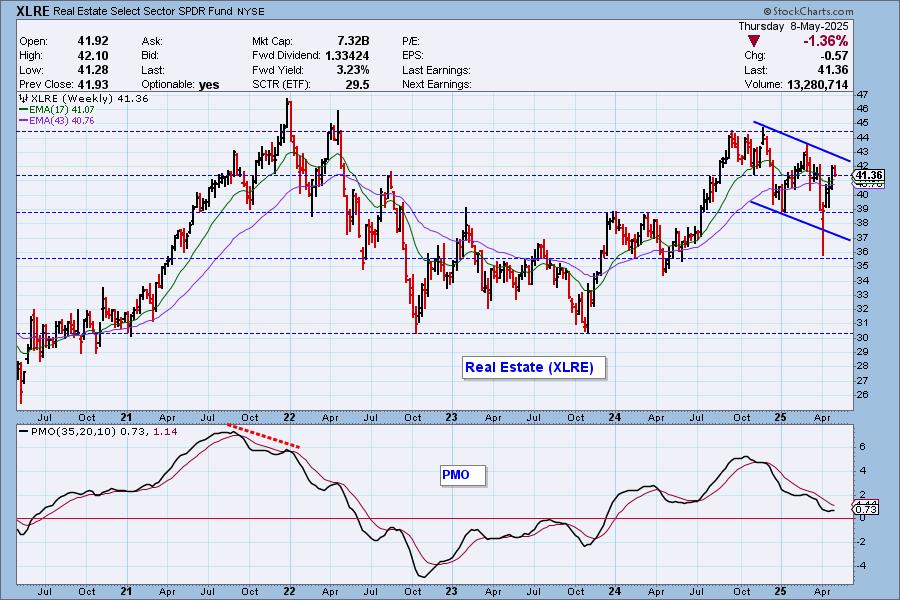
The weekly chart shows a declining trend channel. Price has nearly hit the top and that is where we would expect some more downside. The weekly PMO is flat and unresponsive so we do think there will be some more downside for this defensive sector.
The DecisionPoint Alert Weekly Wrap presents an end-of-week assessment of the trend and condition of the Stock Market, the U.S. Dollar, Gold, Crude Oil, and Bonds. The DecisionPoint Alert daily report (Monday through Thursday) is abbreviated and gives updates on the Weekly Wrap assessments.
MARKET/INDUSTRY GROUP/SECTOR INDEXES
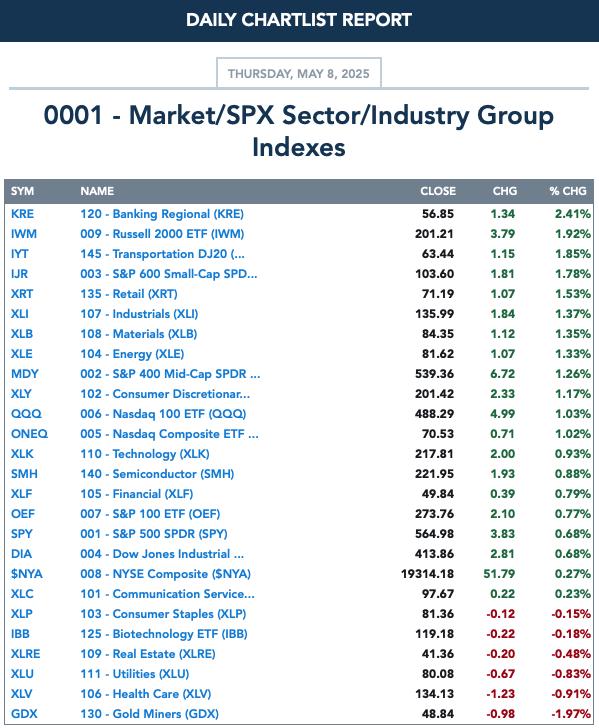
CLICK HERE for Carl's annotated Market Index, Sector, and Industry Group charts.
THE MARKET (S&P 500)
IT Trend Model: NEUTRAL as of 3/4/2025
LT Trend Model: SELL as of 4/16/2025
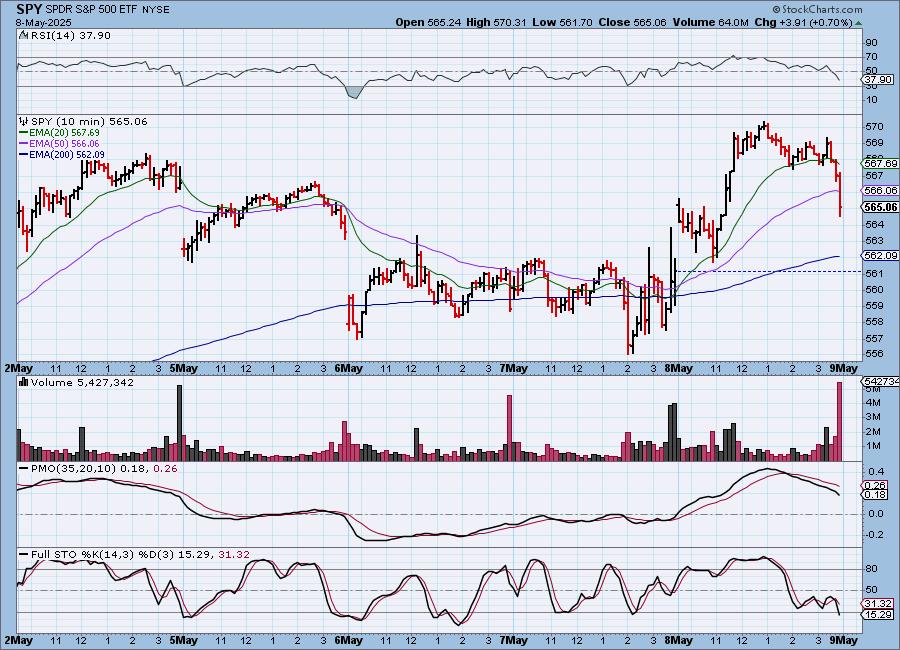
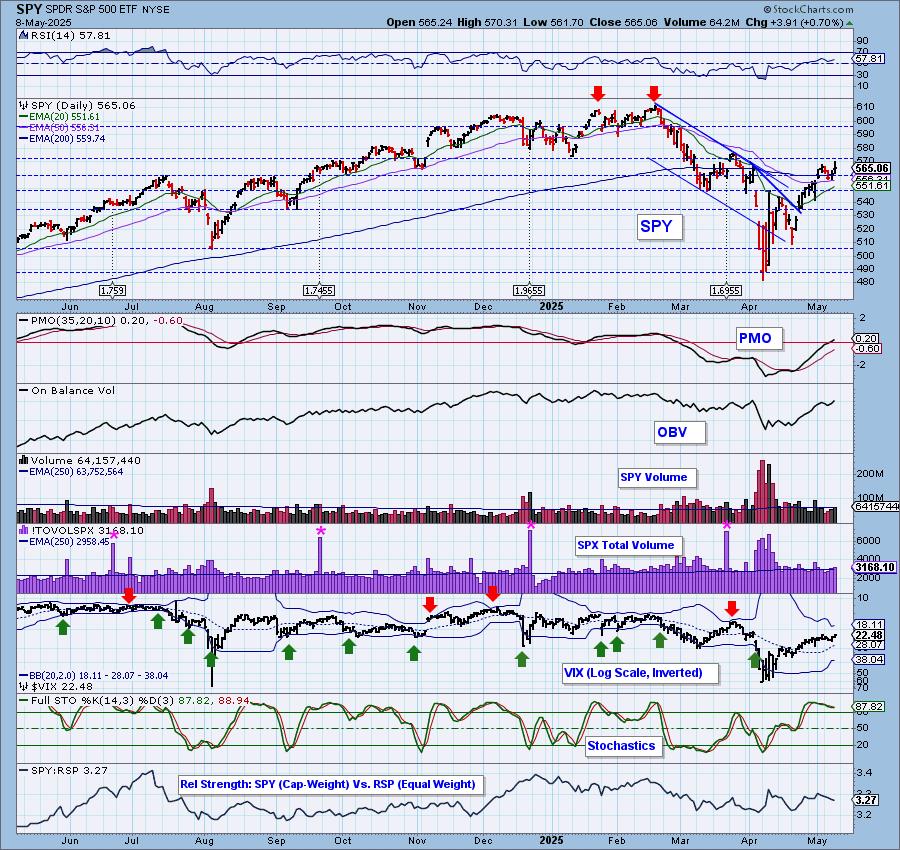
SPY 10-Minute Chart: The day started with a declining trend, but a strong rally ensued likely on news of a trade deal with the UK. However, as the afternoon progressed, a double top was set up and confirmed. The 10-minute PMO is dropping and suggests more downside on tomorrow's open.
SPY Daily Chart: Today's candlestick is a doji. These are a sign of indecision and can often mark a trend change. Given the rally failure to finish the day, we think there is a possibility this is marking a change to the downside. Still, we do have a small bull flag that was confirmed with today's rally so more upside isn't out of the question.
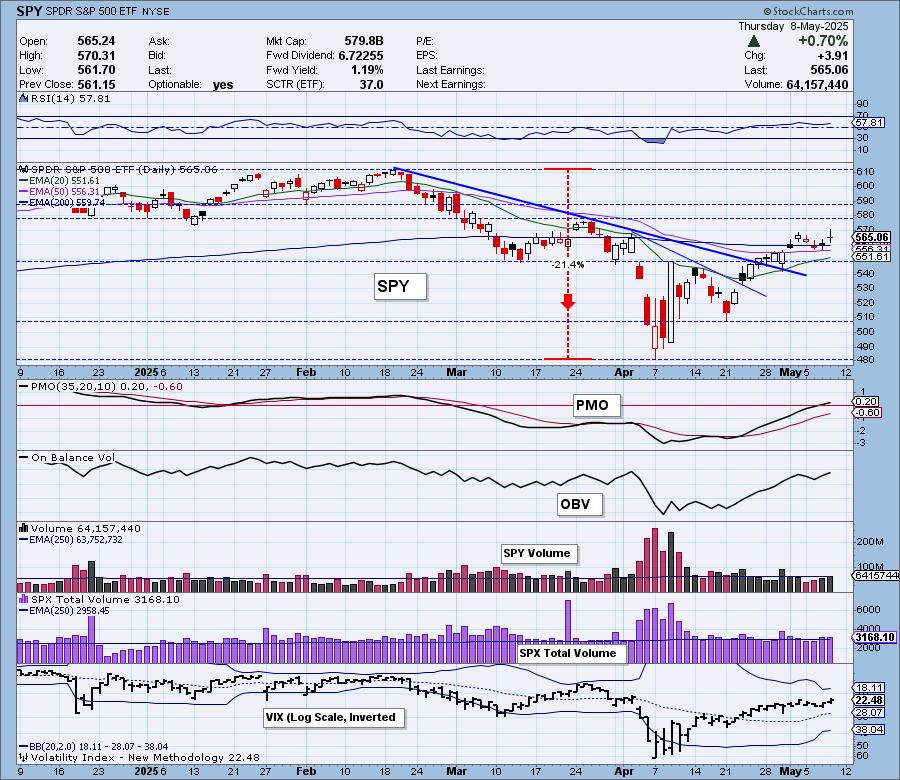
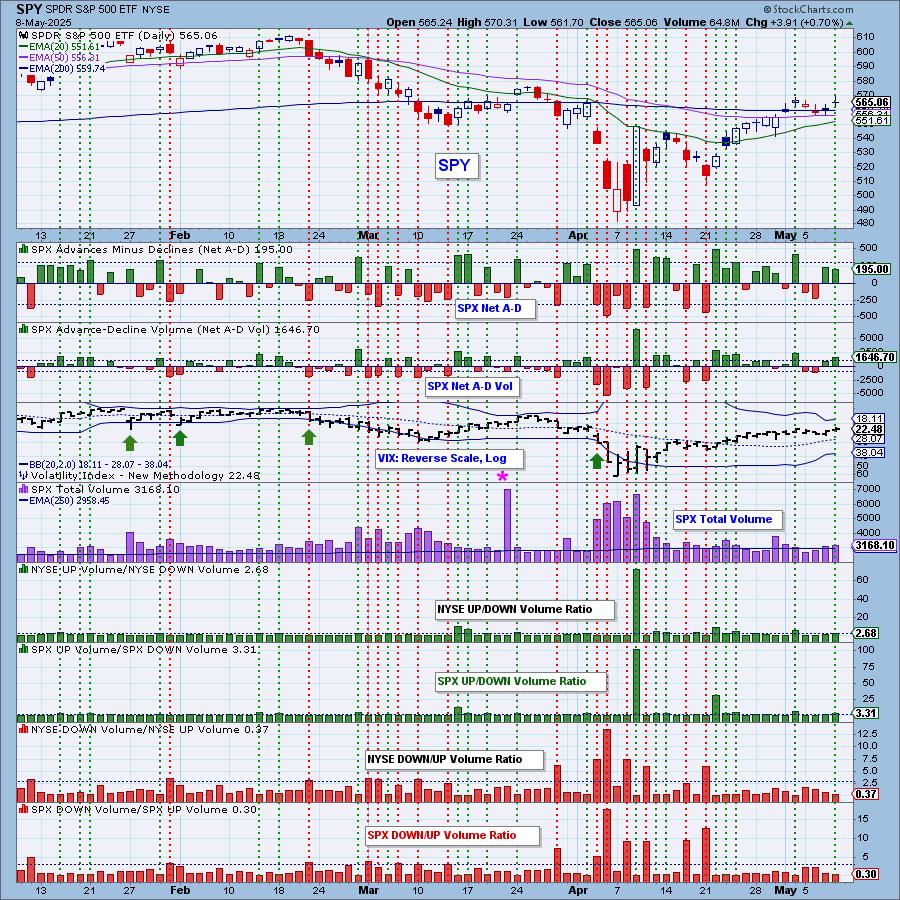
The VIX is above its moving average on the inverted scale. It is slowly making its way higher as investors warm to the rally. Stochastics are turning back up again above 80 and that also bodes well for a rally continuation.
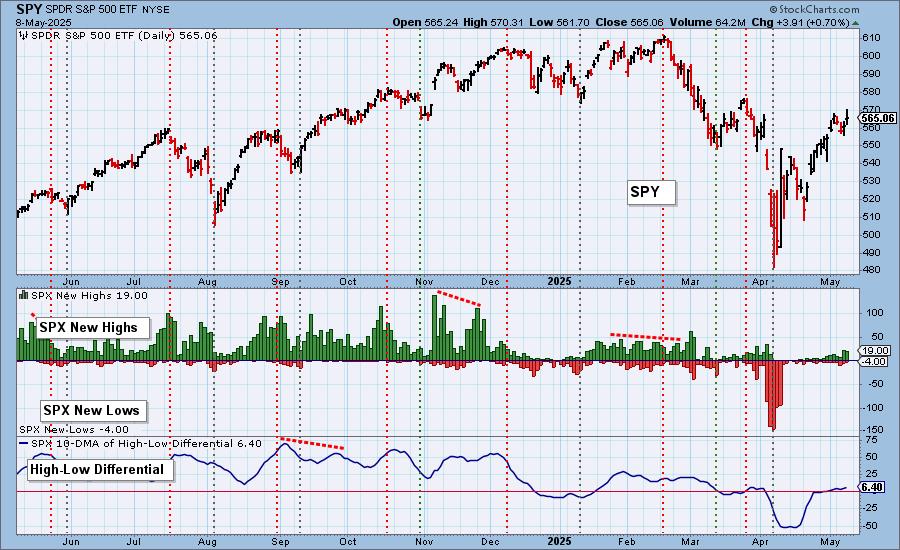
S&P 500 New 52-Week Highs/Lows: New Highs were prevalent but did contract on the rally. We saw fewer New Lows. The High-Low Differential is gently rising above the zero line.
Climax* Analysis: There were two climax readings on the four relevant indicators. While they are not particularly strong, we will rate today to be an upside exhaustion climax.
*A climax is a one-day event when market action generates very high readings in, primarily, breadth and volume indicators. We also include the VIX, watching for it to penetrate outside the Bollinger Band envelope. The vertical dotted lines mark climax days -- red for downside climaxes, and green for upside. Climaxes are at their core exhaustion events; however, at price pivots they may be initiating a change of trend.
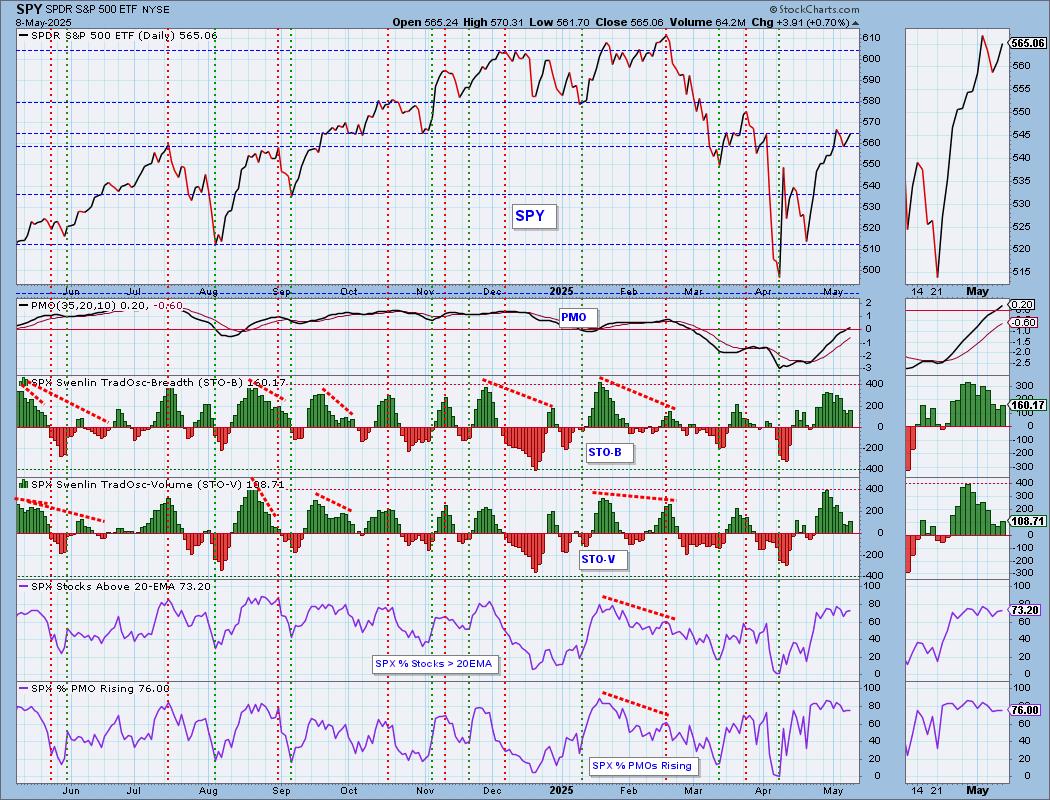
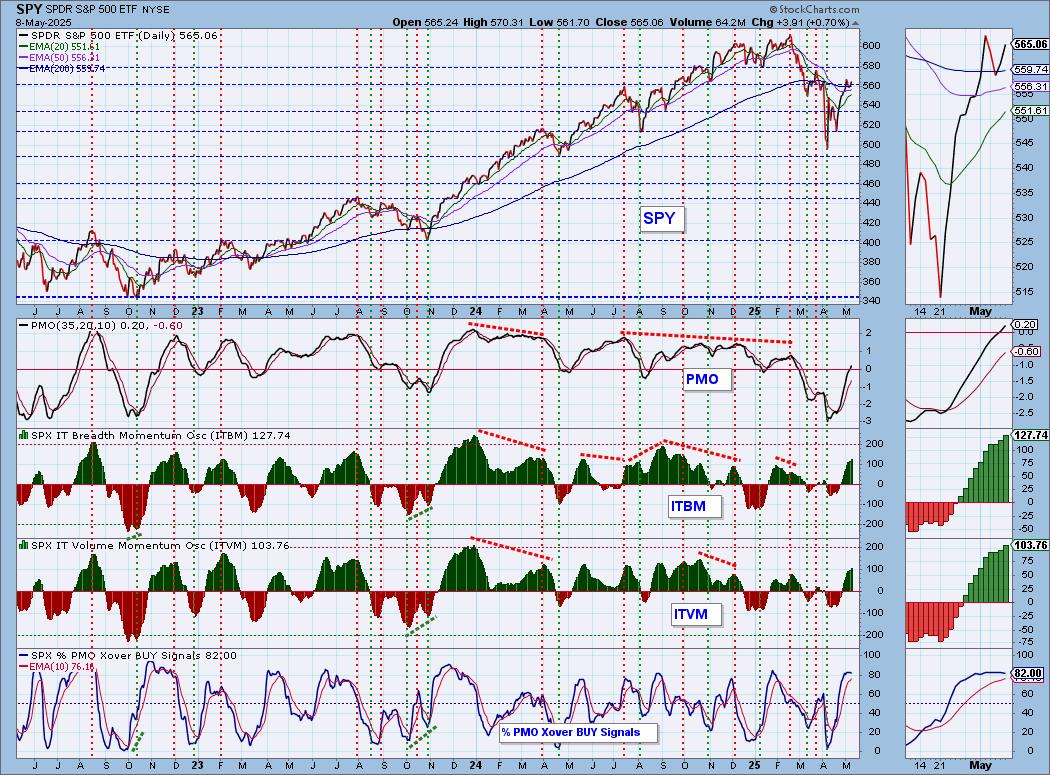
Short-Term Market Indicators: The short-term market trend is UP and the condition is NEUTRAL.
Swenlin Trading Oscillators (STOs) bullishly turned up today which could mean more rally ahead. Participation of stocks above their 20-day EMA didn't move much, but it was slightly higher. We saw no new rising PMOs on the rally which could mean we're at an inflection point.
Intermediate-Term Market Indicators: The intermediate-term market trend is DOWN and the condition is OVERBOUGHT.
We would say that the ITBM and ITVM are now overbought, particularly given readings going back to late 2024. We can see that they can get much higher in a bull market move. %PMO Xover BUY Signals turned down today.
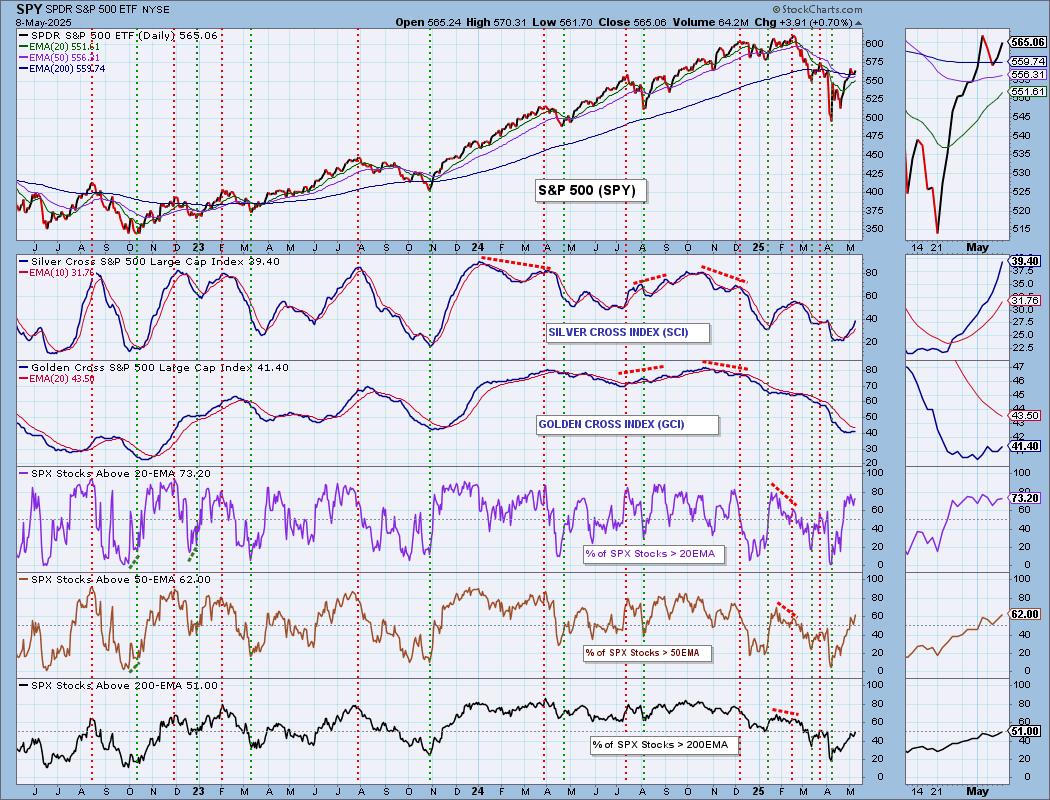
PARTICIPATION CHART (S&P 500): The following chart objectively shows the depth and trend of participation for the SPX in two time frames.
- Intermediate-Term - the Silver Cross Index (SCI) shows the percentage of SPX stocks on IT Trend Model BUY signals (20-EMA > 50-EMA). The opposite of the Silver Cross is a "Dark Cross" -- those stocks are, at the very least, in a correction.
- Long-Term - the Golden Cross Index (GCI) shows the percentage of SPX stocks on LT Trend Model BUY signals (50-EMA > 200-EMA). The opposite of a Golden Cross is the "Death Cross" -- those stocks are in a bear market.
The market bias is BULLISH in the intermediate term.
The market bias is BEARISH in the long term.
Participation readings are now all above our bullish 50% threshold. The Silver Cross Index is above its signal line so the IT Bias is BULLISH. The Golden Cross Index has started rising again, but it is below its signal line so the LT Bias is BEARISH.
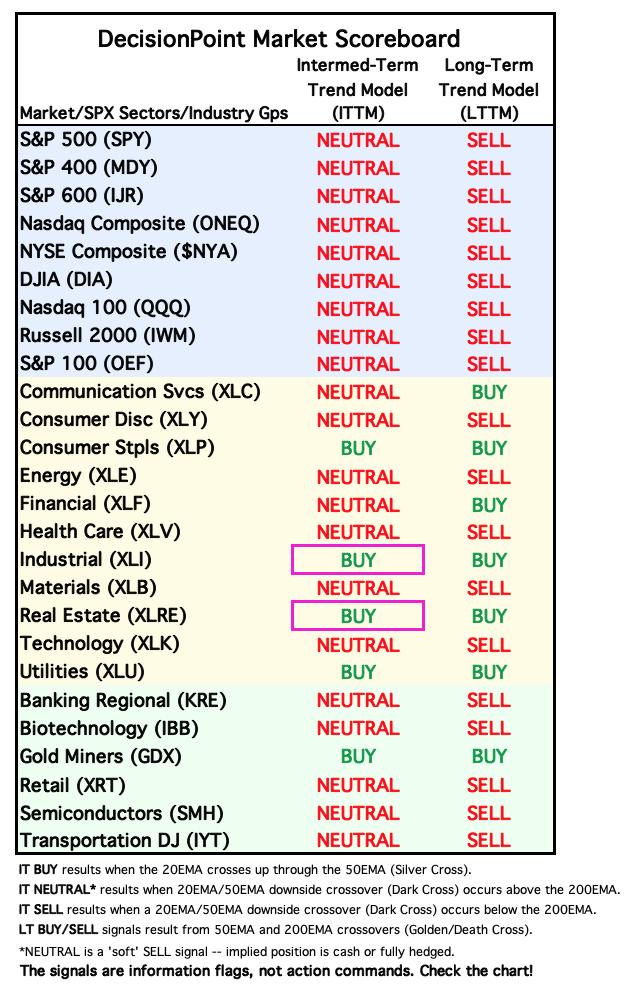
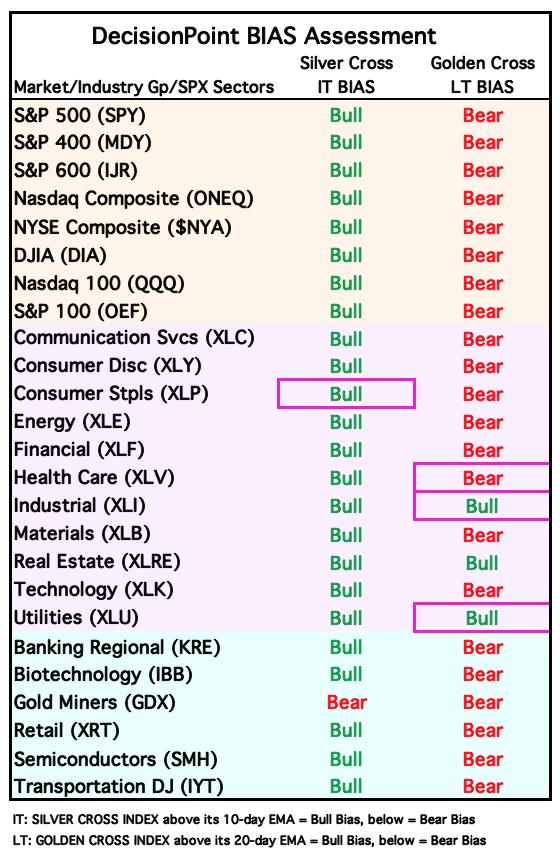
BIAS Assessment: The following table expresses the current BIAS of various price indexes based upon the relationship of the Silver Cross Index to its 10-day EMA (intermediate-term), and of the Golden Cross Index to its 20-day EMA (long-term). When the Index is above the EMA it is bullish, and it is bearish when the Index is below the EMA. The BIAS does not imply that any particular action should be taken. It is information to be used in the decision process.
The items with highlighted borders indicate that the BIAS changed today.
*****************************************************************************************************
CONCLUSION: The trade deal with the UK was cheered, but the market fell flat to finish trading. This was punctuated by an upside exhaustion climax. We saw no new rising PMOs on the rally and we started to lose some PMO BUY Signals. The foundation of our indicators are bullish overall with participation now reaching above our bullish 50% thresholds. STOs did turn back up today. We expect we will see some downside tomorrow, but we don't think this rally is going to fail miserably given indicators overall are moving in the right direction.
Erin is 10% long, 0% short. (This is intended as information, not a recommendation.)
*****************************************************************************************************
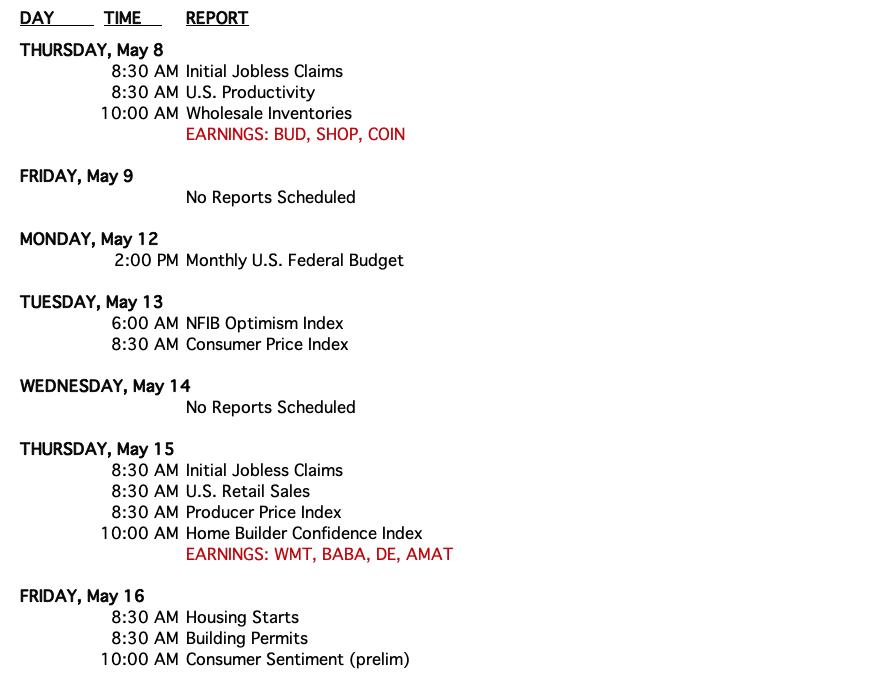
CALENDAR
BITCOIN
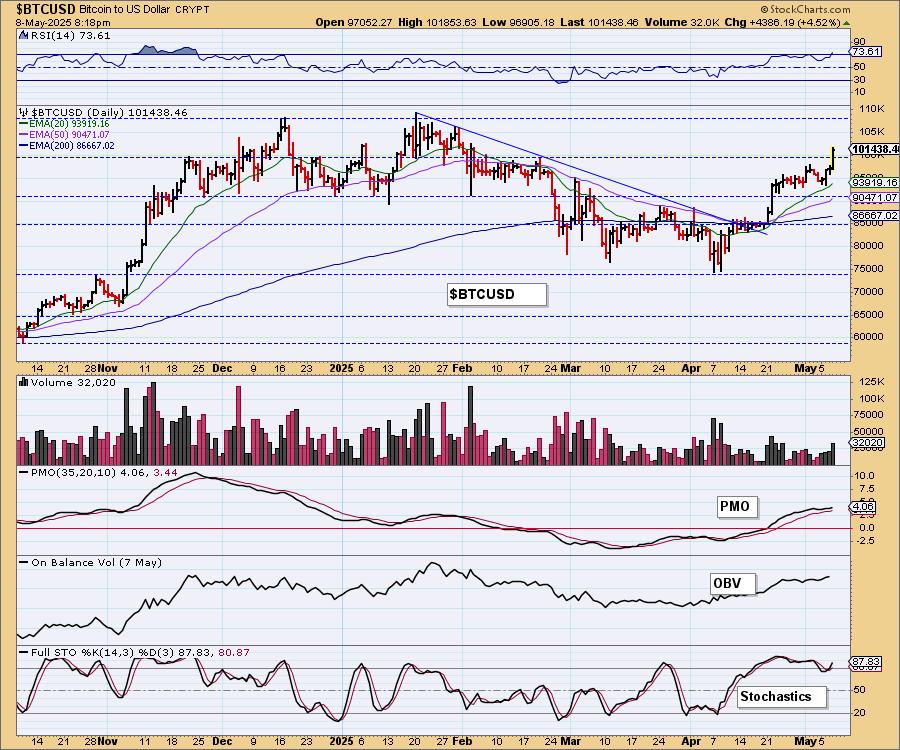
The consolidation is over and now Bitcoin is zooming higher. We expect it will challenge all-time highs soon. One problem is that the RSI is overbought so more consolidation may need to occur, but given its prior history, it can hold overbought conditions for awhile if it stays in a bull market. The PMO looks bullish above the zero line and Stochastics are rising above 80. This is a good sign.
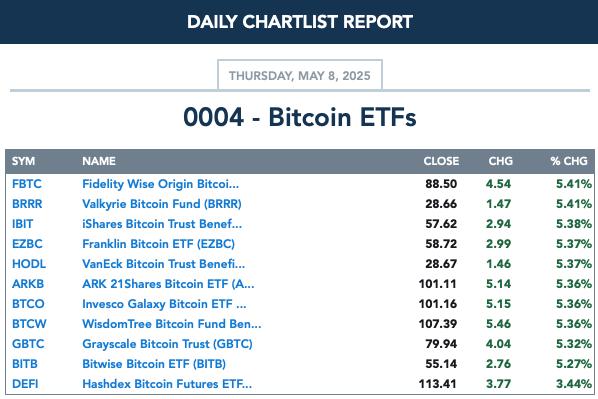
BITCOIN ETFs
INTEREST RATES
Yields rose on the day. This is setting up some new rising trends.
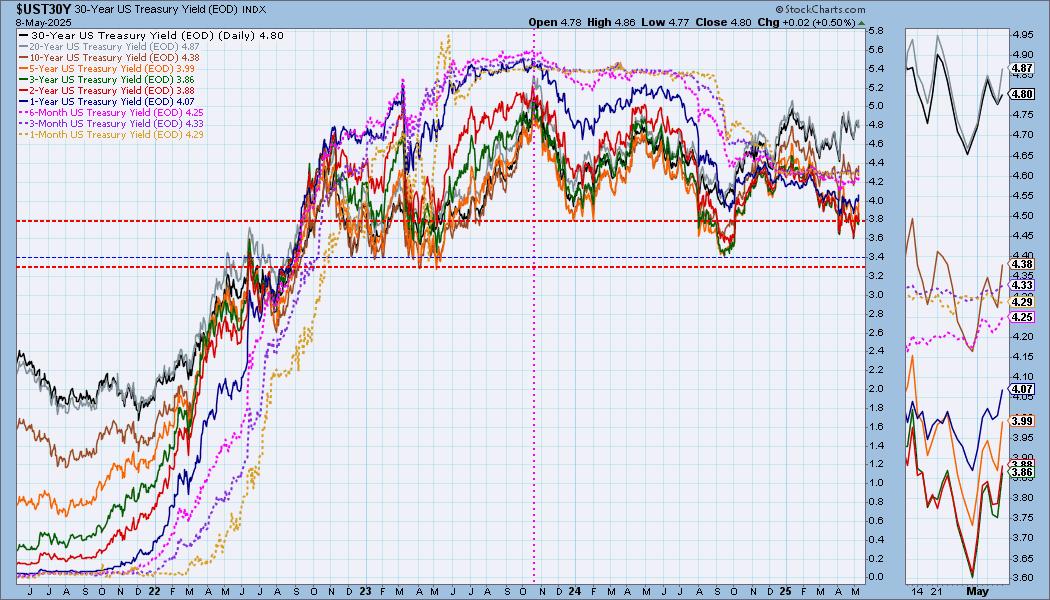
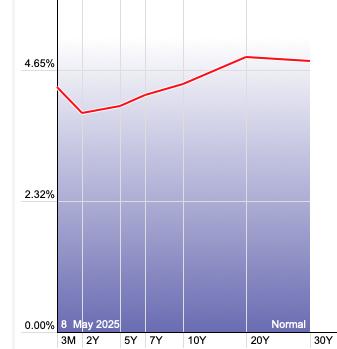
The Yield Curve Chart from StockCharts.com shows us the inversions taking place. The red line should move higher from left to right. Inversions are occurring where it moves downward.
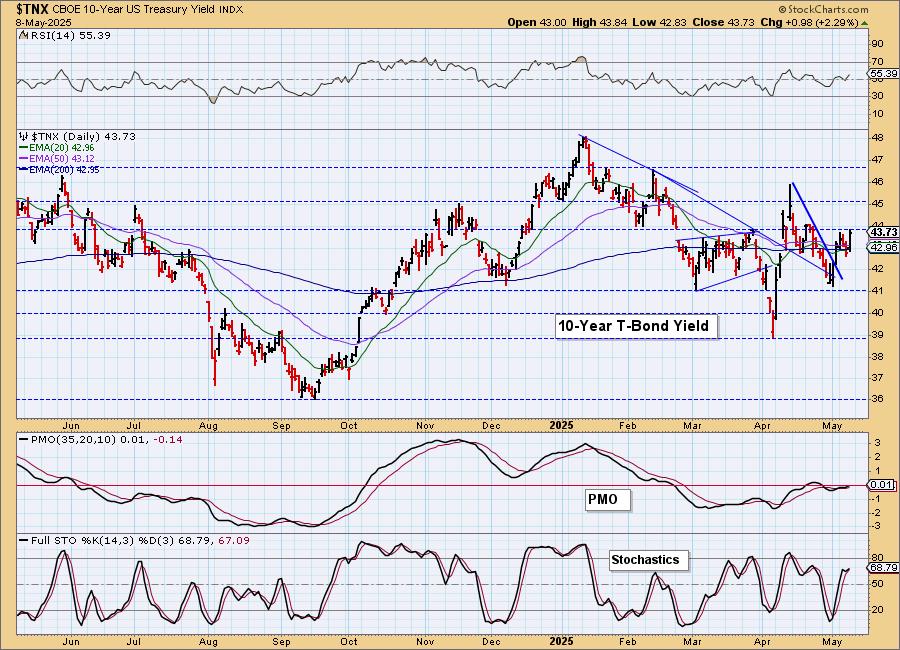
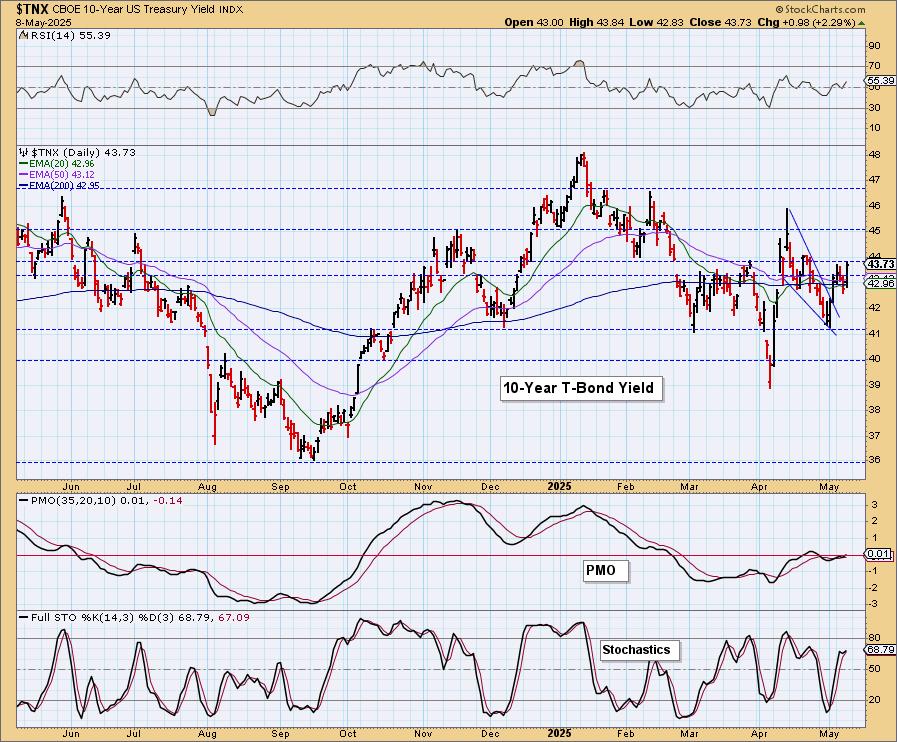
10-YEAR T-BOND YIELD
$TNX advanced strongly today. The RSI is positive and the PMO does appear to be rising. Stochastics tipped upward in positive territory. We should expect the yield to rise from here.
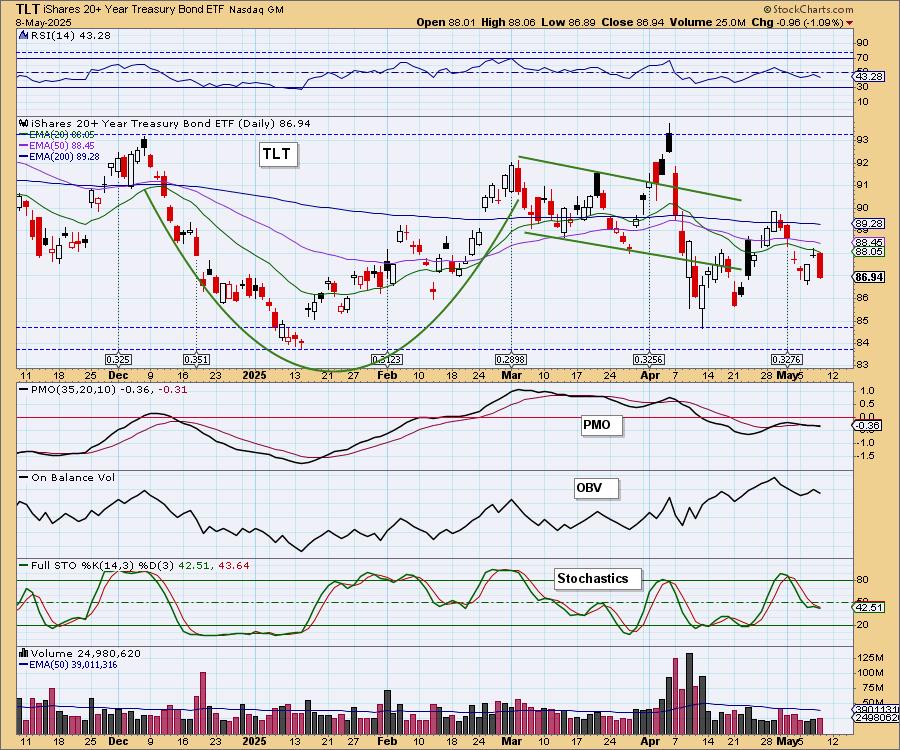
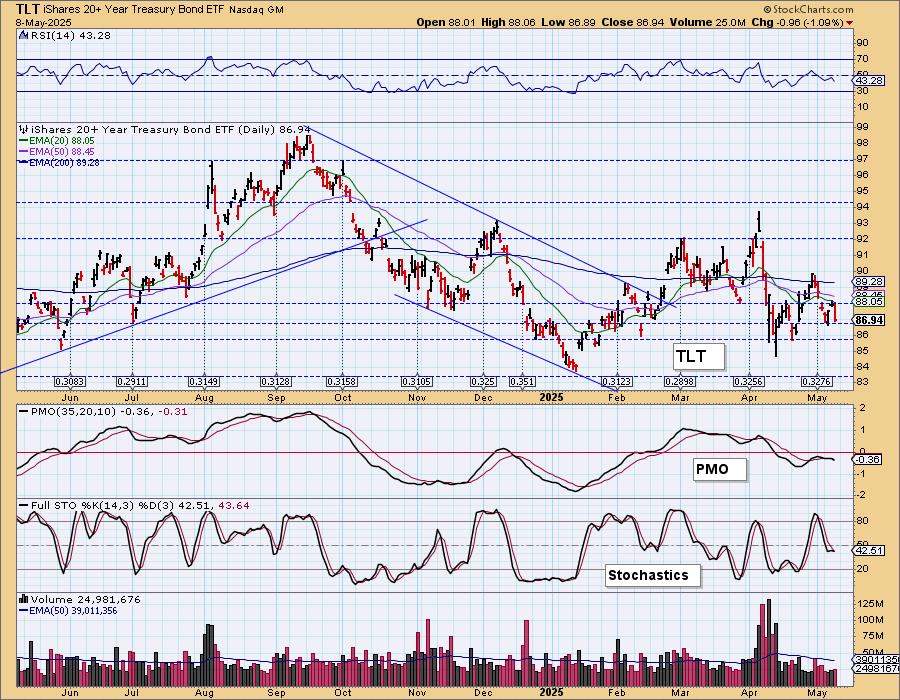
BONDS (TLT)
IT Trend Model: SELL as of 4/14/2025
LT Trend Model: SELL as of 12/13/2024
TLT Daily Chart: We do have a rising trend still, but the PMO has triggered a Crossover SELL Signal. Stochastics have topped in negative territory. With the rising trend intact, we could see them inch higher, but if yields get going again, that will put a damper on all Bond funds.
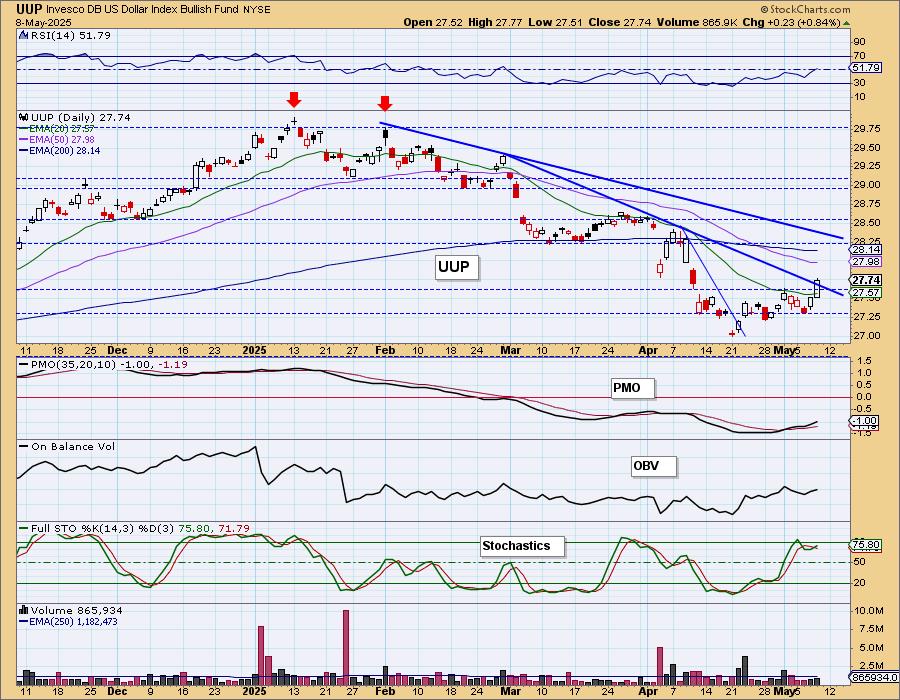
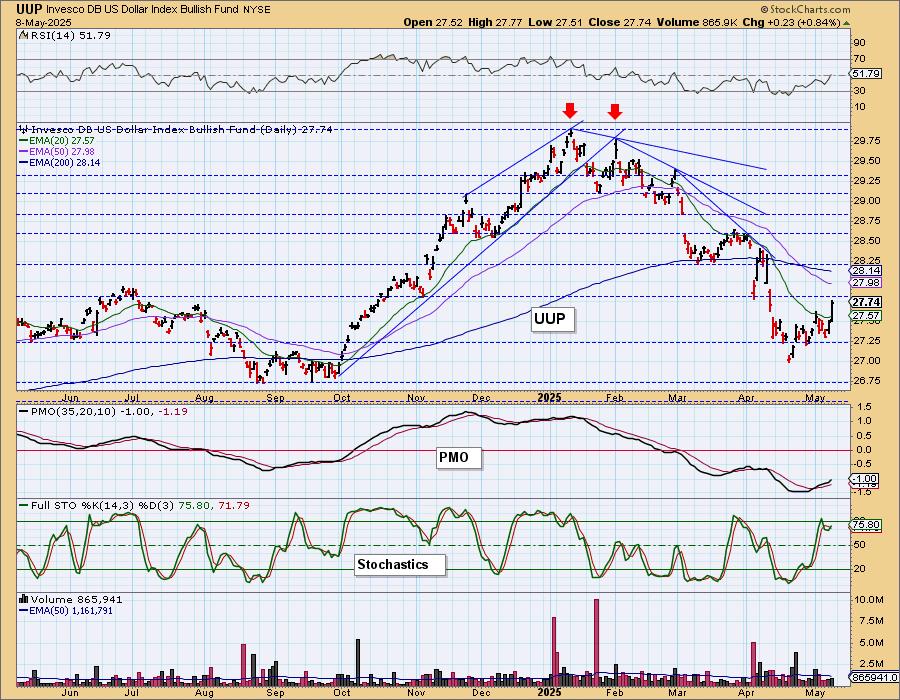
DOLLAR (UUP)
IT Trend Model: NEUTRAL as of 3/5/2025
LT Trend Model: SELL as of 4/25/2025
UUP Daily Chart: The Dollar had strong rally today and that has pushed it out of the declining trend. There is still another area of resistance at the next declining tops trendline. Notice it coincides with horizontal resistance at the March lows. We think it could make its way back up to the 200-day EMA. The RSI just moved into positive territory and the PMO is rising. The PMO is still very negative in its reading so we can't get overly bullish especially with resistance nearing.
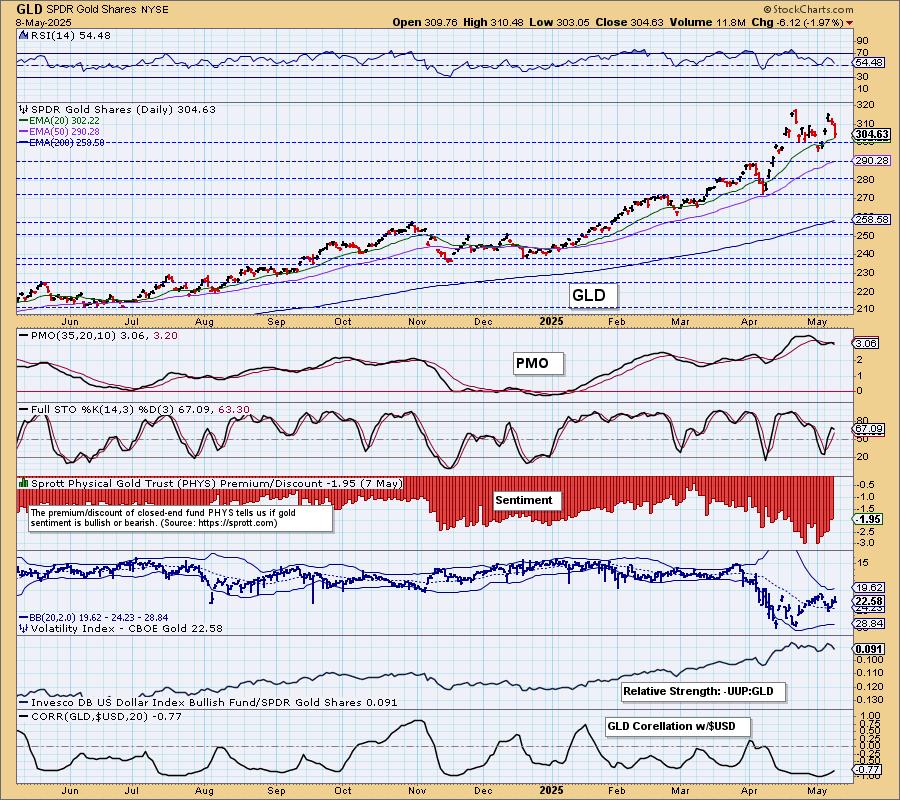
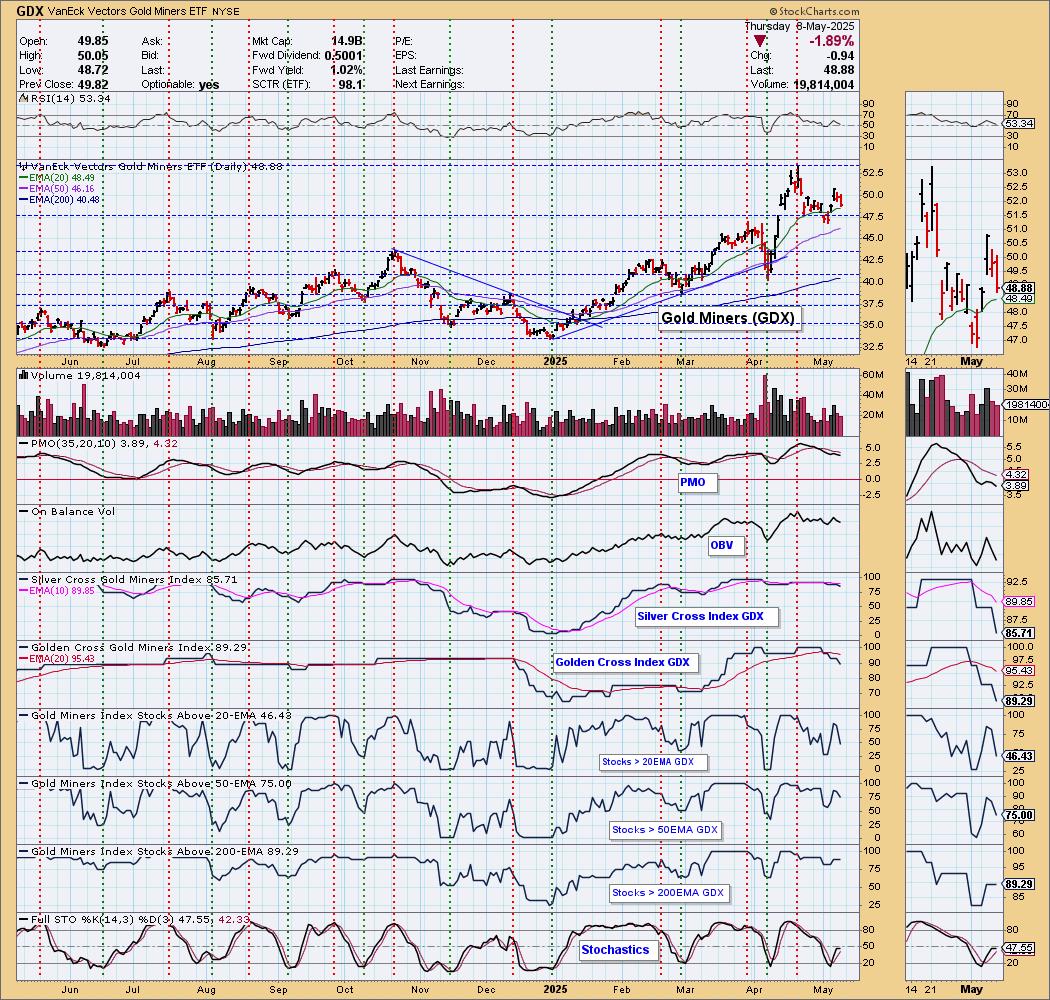
GOLD
IT Trend Model: BUY as of 1/10/2025
LT Trend Model: BUY as of 10/20/2023
GLD Daily Chart: We saw another huge decline in Gold. It was down much farther than the Dollar was up. This means we had plenty of sellers, it wasn't just due to the rising Dollar.We now have a double top developing on Gold and the Dollar looks more bullish than it has in awhile so we should expect more downside ahead. The double top won't be confirmed until price drops below the May low.
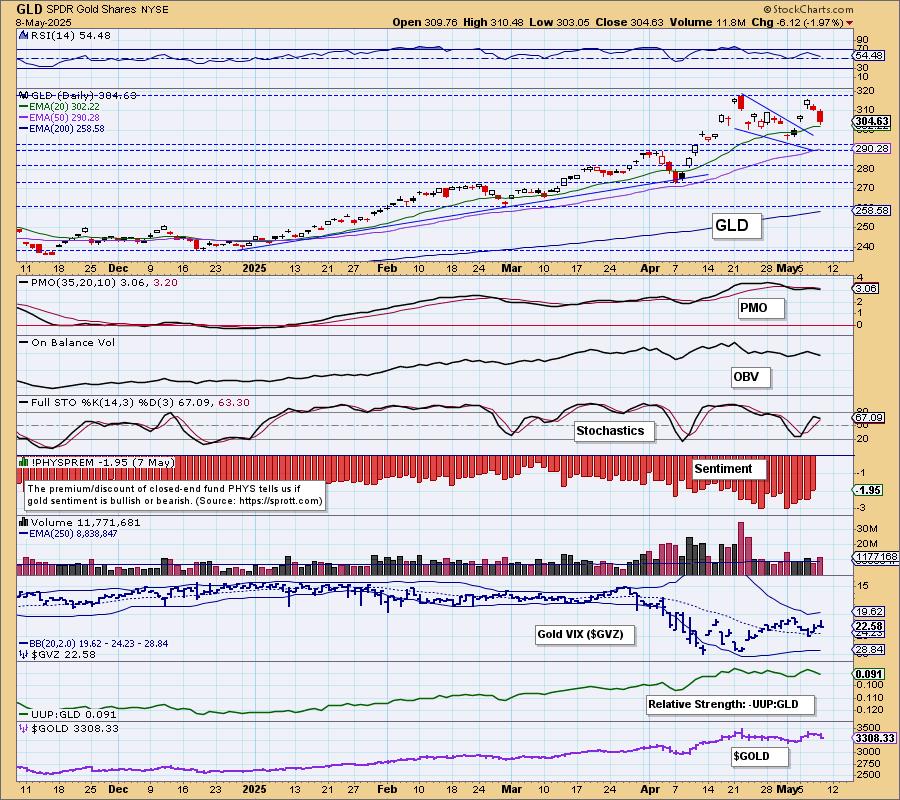
The PMO topped beneath the signal line which is especially bearish. Stochastics also topped.
GOLD MINERS (GDX) Daily Chart: Gold Miners struggled on Gold's decline. They appear headed for support again. The tops aren't particularly even, but you could make a case for a double top. The PMO has topped beneath its signal line and participation is leaking out of the group. The Silver and Golden Cross Indexes look very bearish. They are below their signal lines so the IT and LT Biases are BEARISH.
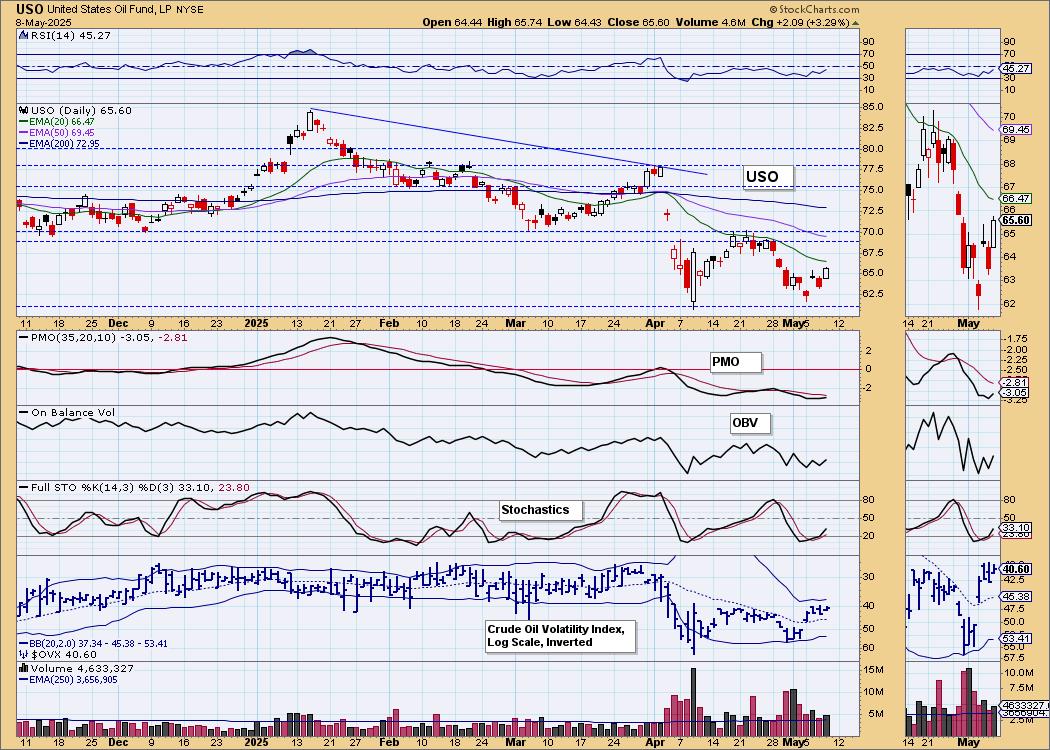
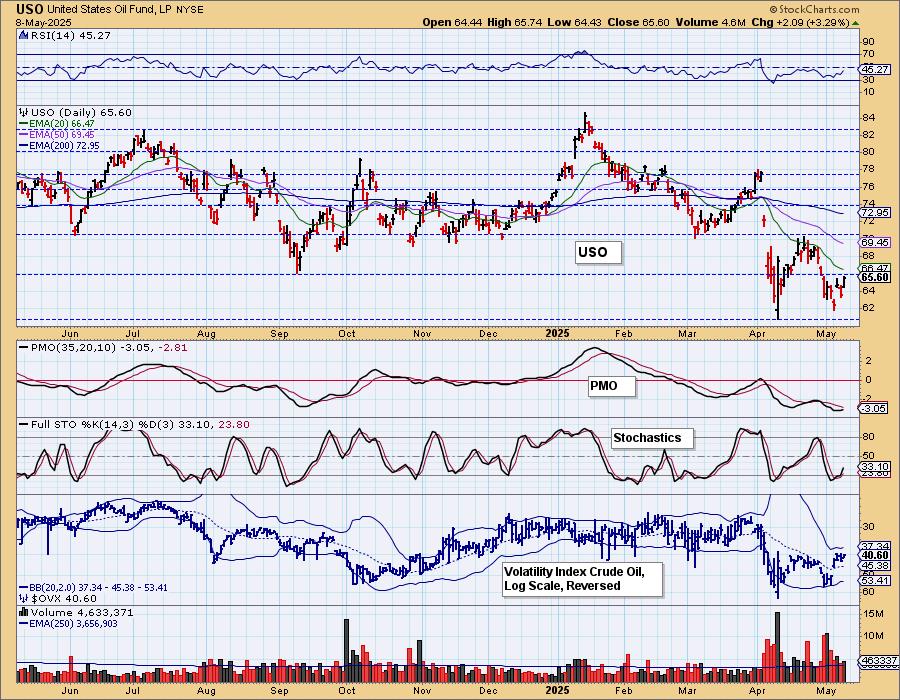
CRUDE OIL (USO)
IT Trend Model: NEUTRAL as of 2/27/2025
LT Trend Model: SELL as of 3/18/2025
USO Daily Chart: We see that a bullish double bottom is forming on USO. The rally tipped to PMO back up and Stochastics are rising. The PMO is still at a very low reading so what we're seeing is likely diminishing weakness not new strength. The double bottom won't be confirmed until we get a breakout. We think we could see more upside here, but "diminishing weakness" means the rally could fail at any time.
Good Luck & Good Trading!
Erin Swenlin and Carl Swenlin
Technical Analysis is a windsock, not a crystal ball. --Carl Swenlin
(c) Copyright 2025 DecisionPoint.com
Disclaimer: This blog is for educational purposes only and should not be construed as financial advice. The ideas and strategies should never be used without first assessing your own personal and financial situation, or without consulting a financial professional. Any opinions expressed herein are solely those of the author, and do not in any way represent the views or opinions of any other person or entity.
DecisionPoint is not a registered investment advisor. Investment and trading decisions are solely your responsibility. DecisionPoint newsletters, blogs or website materials should NOT be interpreted as a recommendation or solicitation to buy or sell any security or to take any specific action.
NOTE: The signal status reported herein is based upon mechanical trading model signals, specifically, the DecisionPoint Trend Model. They define the implied bias of the price index based upon moving average relationships, but they do not necessarily call for a specific action. They are information flags that should prompt chart review. Further, they do not call for continuous buying or selling during the life of the signal. For example, a BUY signal will probably (but not necessarily) return the best results if action is taken soon after the signal is generated. Additional opportunities for buying may be found as price zigzags higher, but the trader must look for optimum entry points. Conversely, exit points to preserve gains (or minimize losses) may be evident before the model mechanically closes the signal.
Helpful DecisionPoint Links:
DecisionPoint Alert Chart List
DecisionPoint Golden Cross/Silver Cross Index Chart List
DecisionPoint Sector Chart List
Price Momentum Oscillator (PMO)