
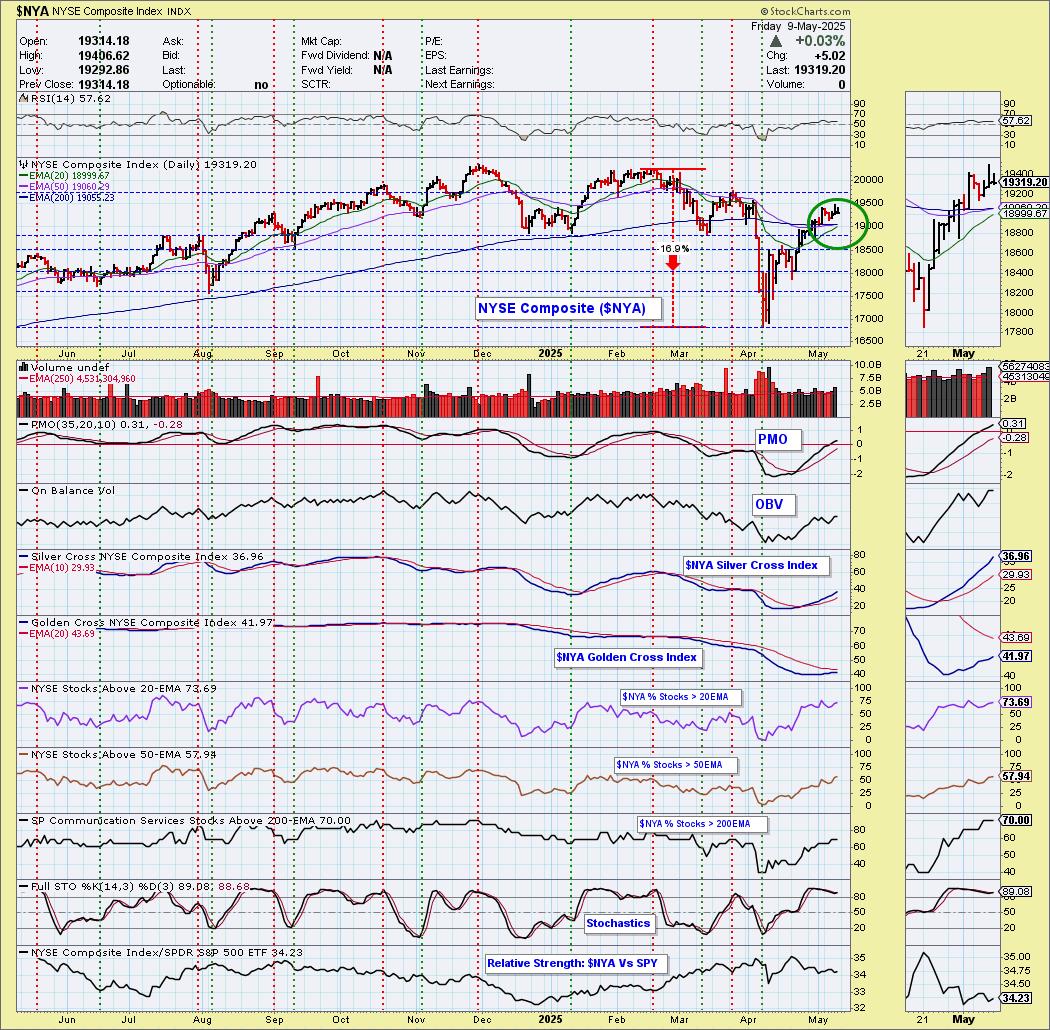
Today the NYSE Composite ($NYA) 50-day EMA crossed up through the 200-day EMA (Golden Cross), generating an IT Trend Model BUY Signal. The rally continues for the NYSE. The RSI is not at all overbought and the PMO is rising above the zero line. The Silver Cross Index is rising, but is below our bullish 50% threshold. It is above its signal line so there is a BULLISH IT Bias. The Golden Cross Index is rising, but is still below its signal line giving us a BEARISH LT Bias. Participation is very healthy above our 50% threshold and none are overbought. Stochastics are very positive so we should look for more upside from the broad market.
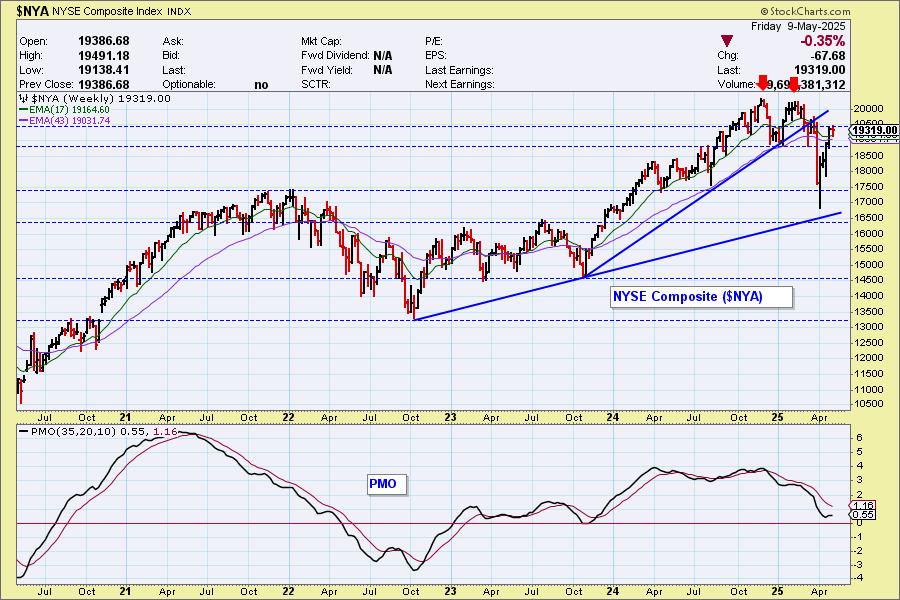
Price bounced of rising bottoms trendline support but hasn't quite reached the prior rising trend. The weekly PMO is rising so we should expect more upside in the intermediate term.
__________
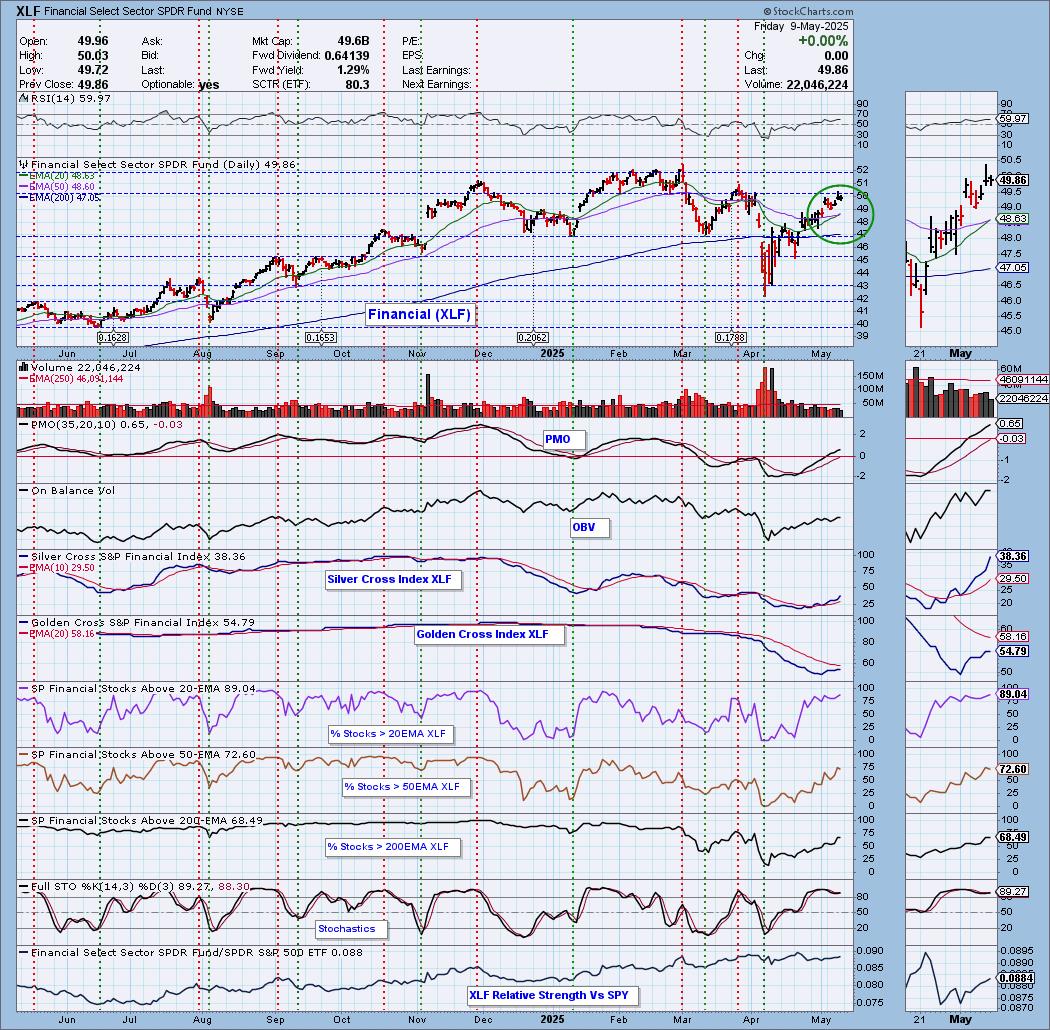
Today the Financial Sector ETF (XLF) 20-day EMA crossed up through the 50-day EMA (Silver Cross) generating an IT Trend Model BUY Signal. Price has rallied to resistance and based on the indicators, we should see a breakout. The PMO is on the rise, the RSI is not overbought and the Silver Cross Index is rising strongly above its signal line. The Golden Cross Index is attempting to advance toward its signal line. Participation is robust across the board so the Silver and Golden Cross Indexes should continue to rise from here. Stochastics are rising above 80.
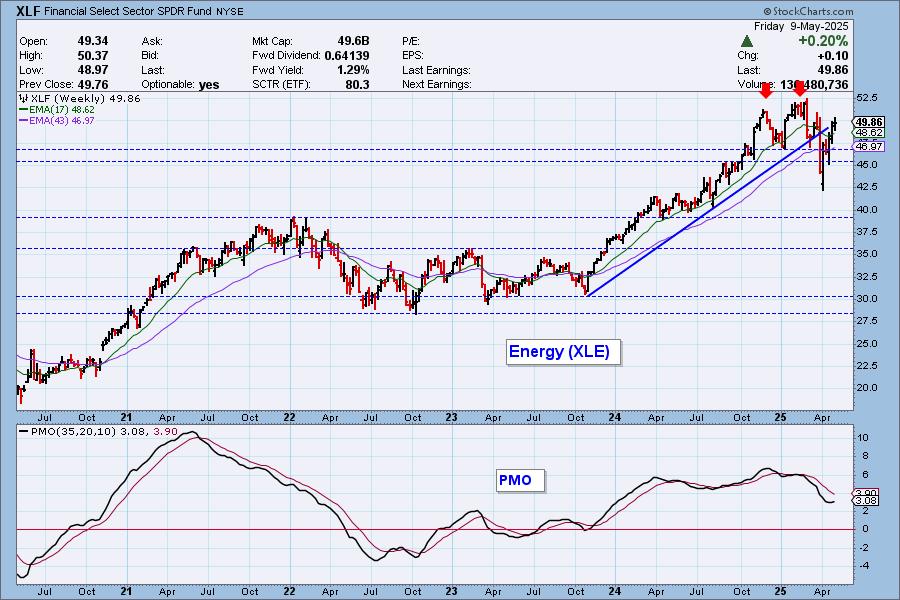
XLF has essentially recaptured its prior rising trend and the weekly PMO is rising again. We should expect more upside here.
The DecisionPoint Alert Weekly Wrap presents an end-of-week assessment of the trend and condition of the Stock Market, the U.S. Dollar, Gold, Crude Oil, and Bonds. The DecisionPoint Alert daily report (Monday through Thursday) is abbreviated and gives updates on the Weekly Wrap assessments.
Watch the latest episode of DecisionPoint on our YouTube channel here!
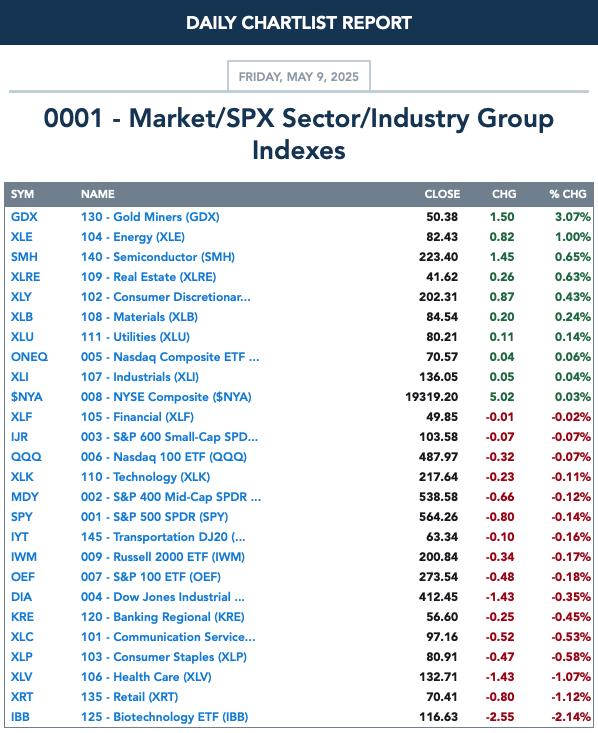
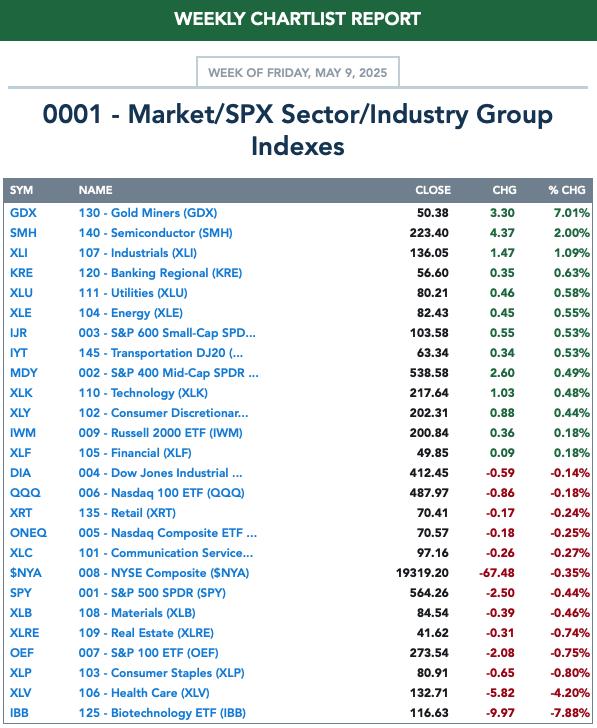
MARKET/SPX SECTOR/INDUSTRY GROUP INDEXES
Change Today:
Change for the Week:
CLICK HERE for Carl's annotated Market Index, Sector, and Industry Group charts.
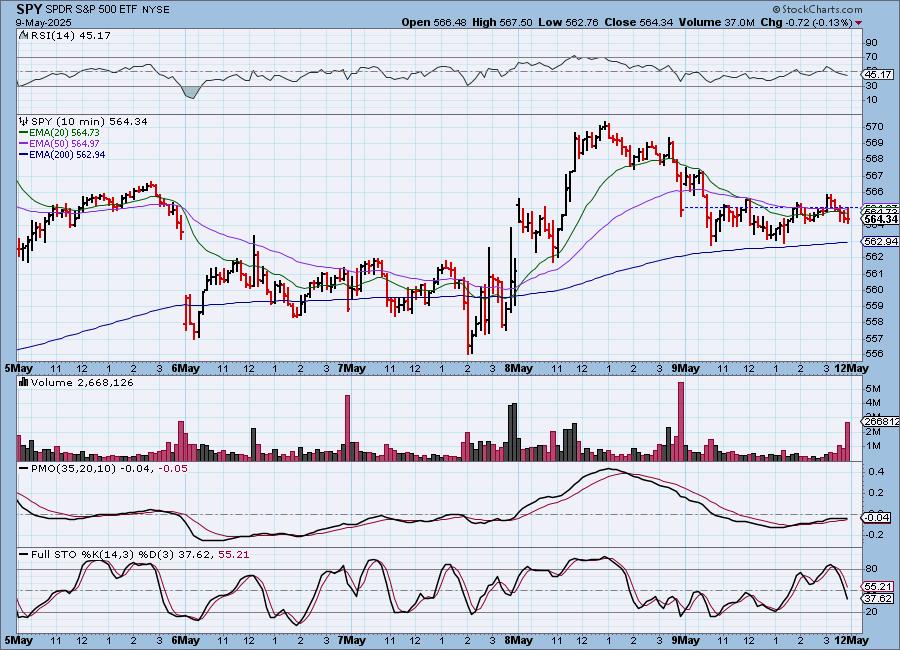
THE MARKET (S&P 500)
IT Trend Model: NEUTRAL as of 3/4/2025
LT Trend Model: SELL as of 4/16/2025
SPY 10-Minute Chart: The market was basically in a holding pattern today but did spend most of the day down. The 10-minute PMO has topped and Stochastics are diving lower so the expectation would be a down day on Monday.
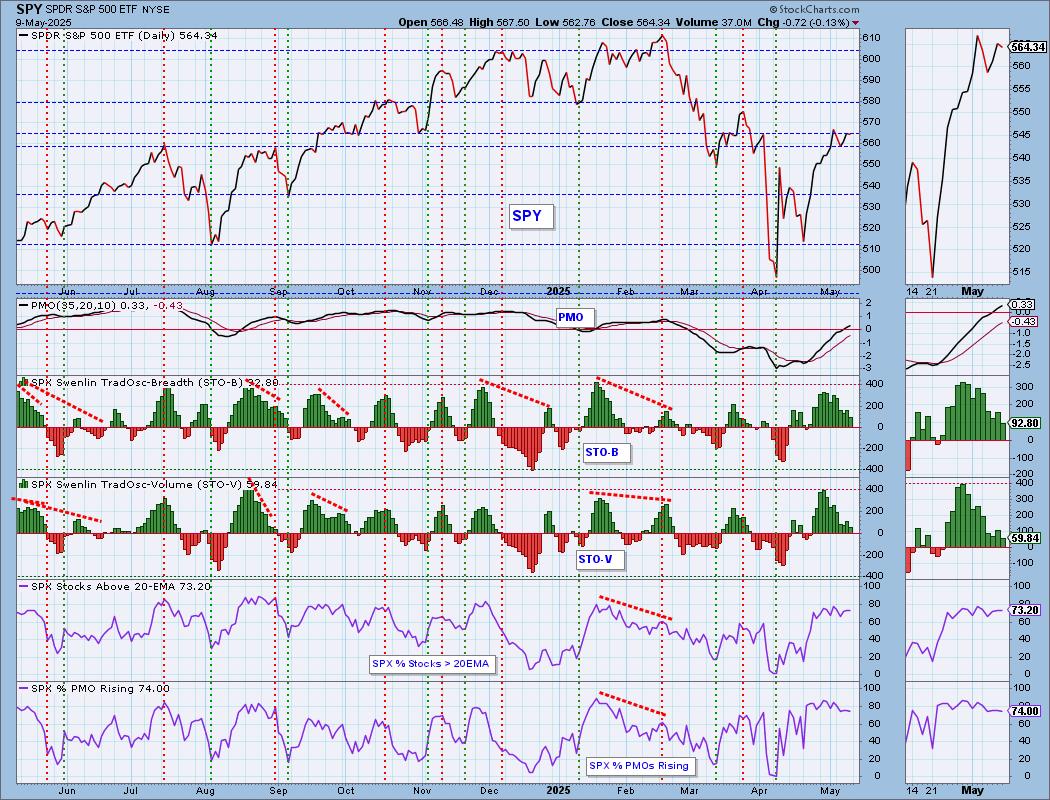
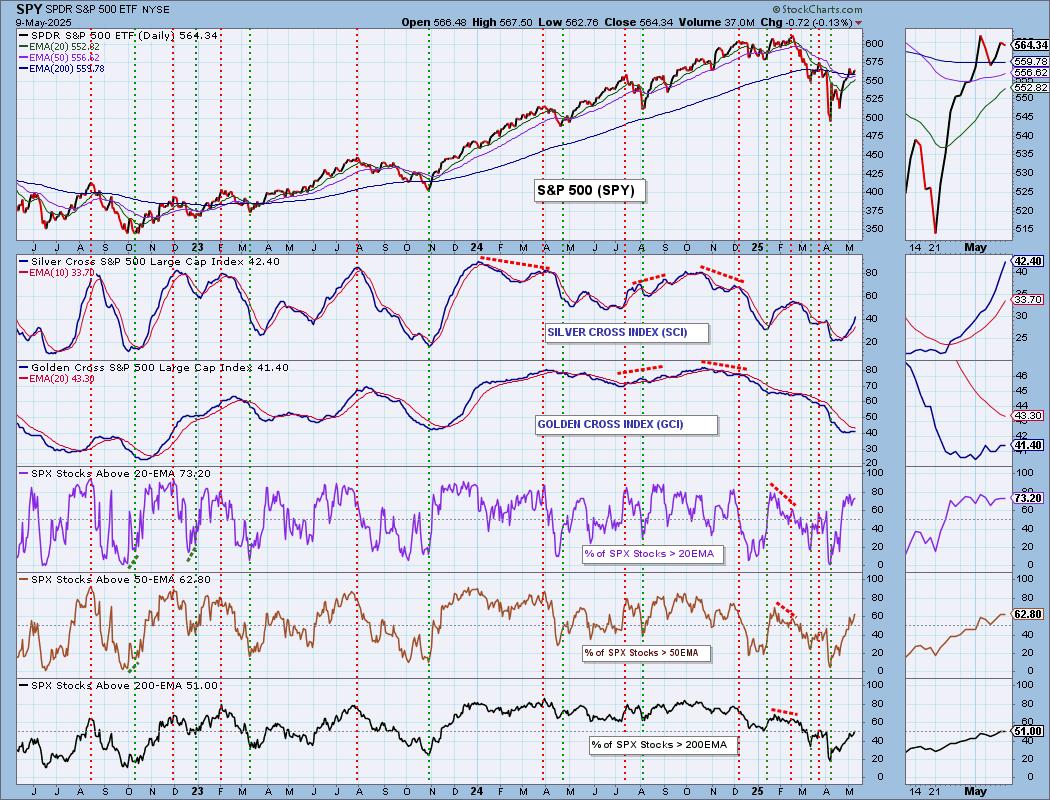
SPY Daily Chart: We can see that price essentially moved sideways this week. This could be a time for the market to build energy to eventually continue to move higher or it could be the calm before a storm. With news headlines whipping the market around, it is honestly hard to tell which is the correct assumption. The technicals are positive with the PMO rising strongly and the RSI positive and not overbought.
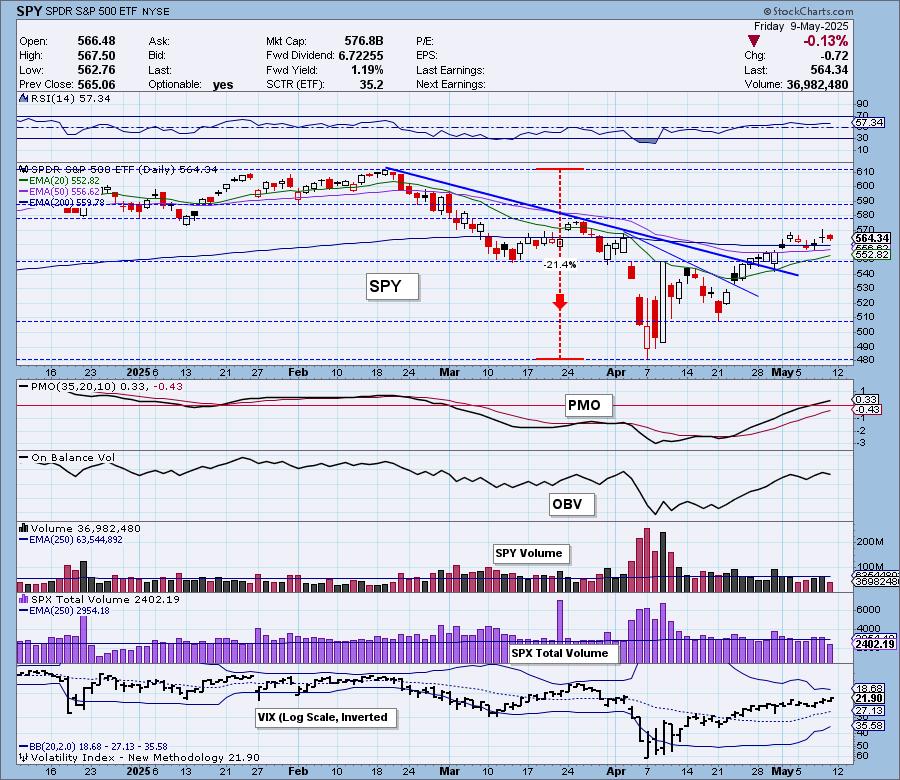
The VIX readings are slowly receding which has the VIX above its moving average on the inverted scale. There really isn't much fear to detect at the moment. Stochastics are very strong as they hold above 80.
SPY Weekly Chart: The market was down on the week and is currently holding above support. The rebound came right at the rising bottoms trendline. With the weekly PMO rising again, we do think there is likely more upside to be had.

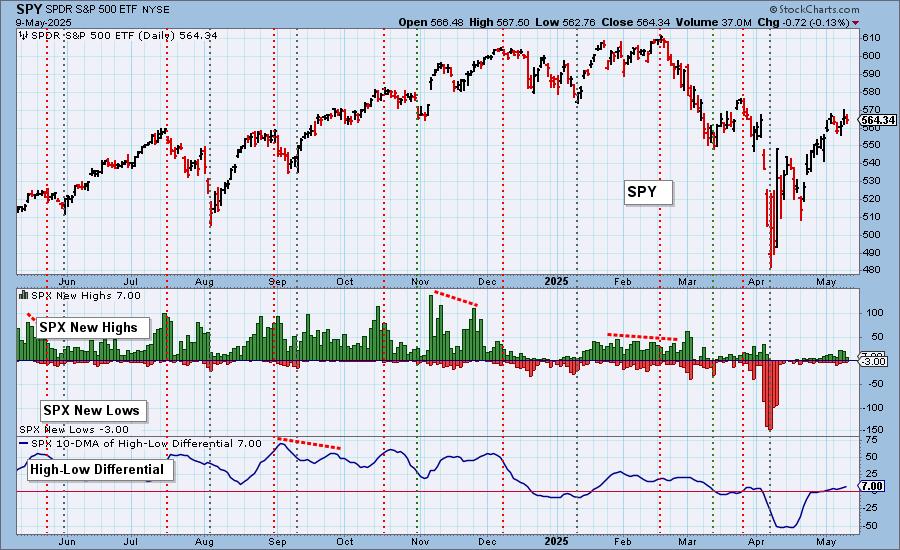
New 52-Week Highs/Lows: New Highs and New Lows were negligible. Most important would be the High-Low Differential rising above the zero line.
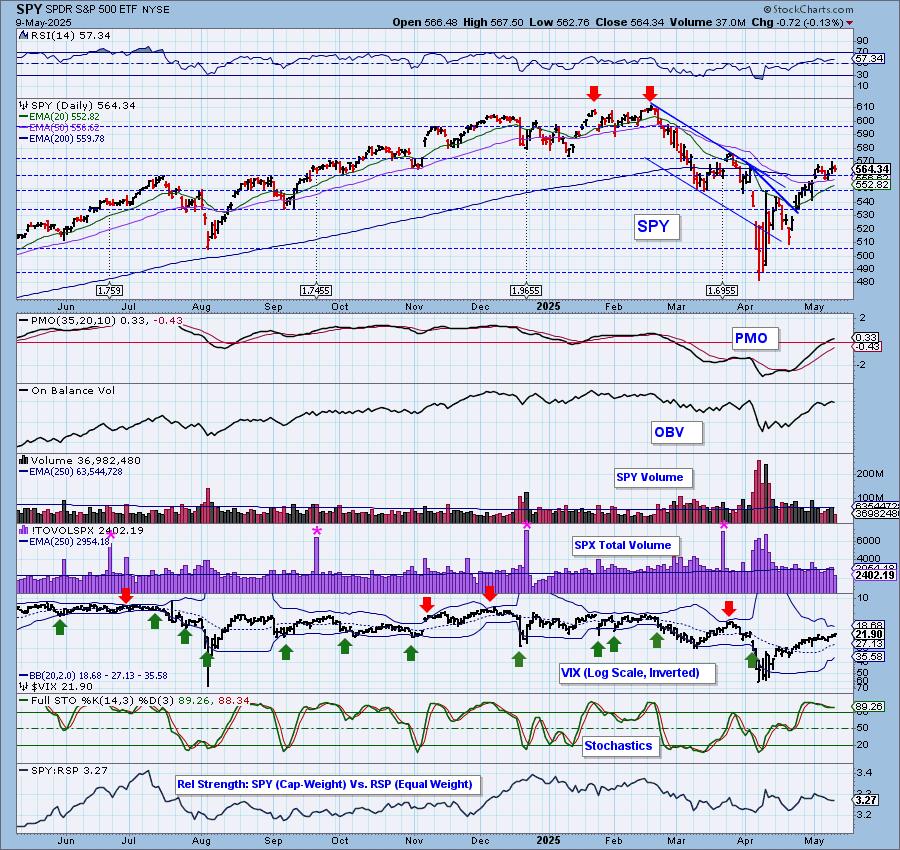
Climax Analysis: There were no climax readings today. SPX Total Volume was 81% of the one-year average daily volume, not a lot of conviction on this decline.
*A climax is a one-day event when market action generates very high readings in, primarily, breadth and volume indicators. We also include the VIX, watching for it to penetrate outside the Bollinger Band envelope. The vertical dotted lines mark climax days -- red for downside climaxes, and green for upside. Climaxes are at their core exhaustion events; however, at price pivots they may be initiating a change of trend.
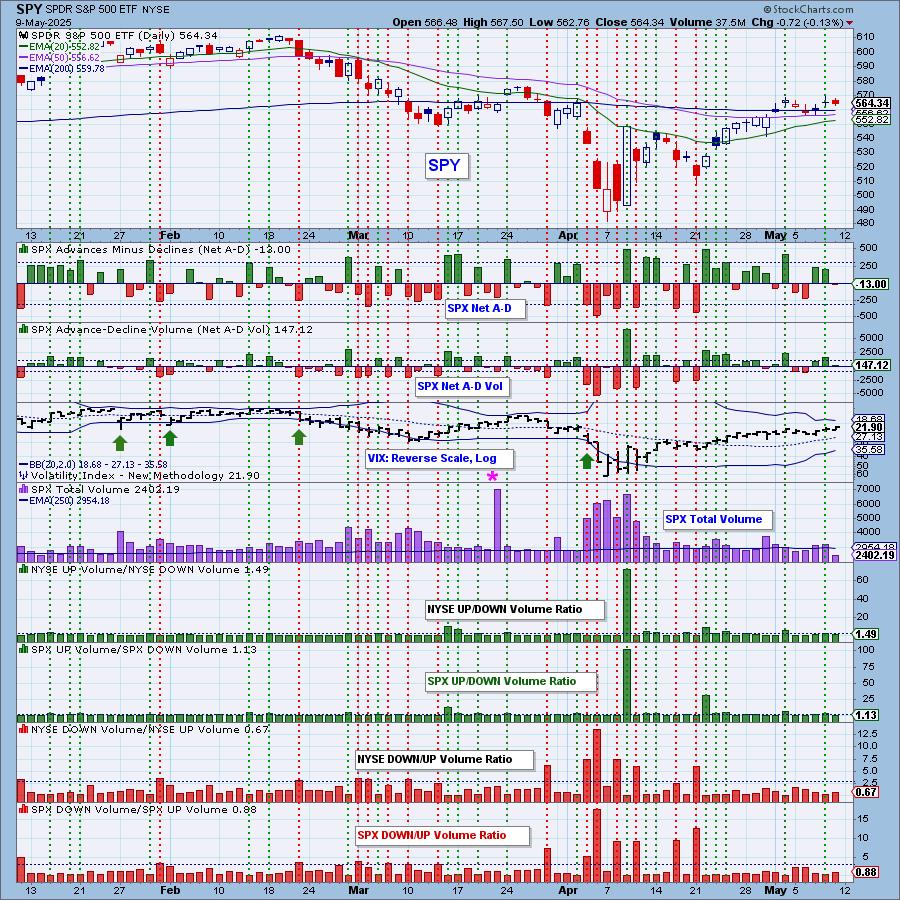
Short-Term Market Indicators: The short-term market trend is UP and the condition is NEUTRAL.
Swenlin Trading Oscillators (STOs) have been jumping around. Today they reversed course and moved lower. Overall we see a negative divergence here as STOs are in declining trends while the short-term trend is UP. Participation is holding at a good level and we do have nearly 75% of the index holding rising momentum.
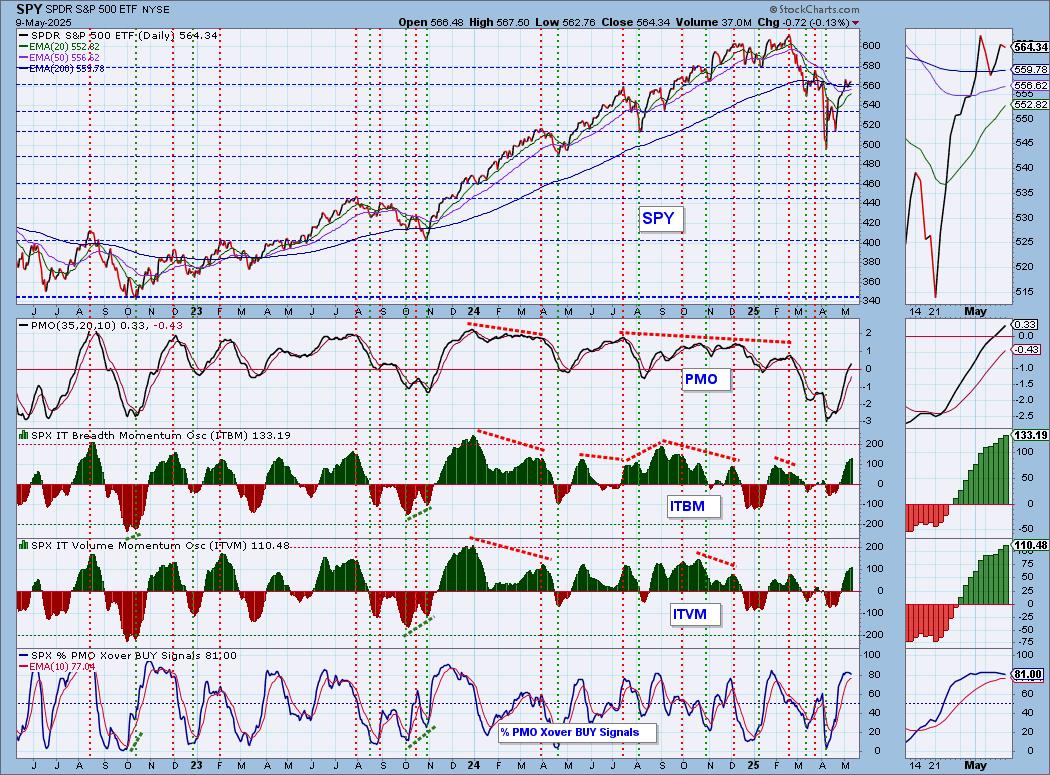
Intermediate-Term Market Indicators: The intermediate-term market trend is DOWN and the condition is OVERBOUGHT.
The ITBM and ITVM are rising bullishly but have reached overbought territory which is somewhat worrisome. We do see that they can get much higher on a good bull market run. If price is on its way to new all-time highs, we should look for them to move toward the top of the range. For now we still think we are technically in a bear market and these readings are definitely overbought in that case. We're slowly losing PMO Xover BUY Signals as there are fewer rising PMOs.
_______
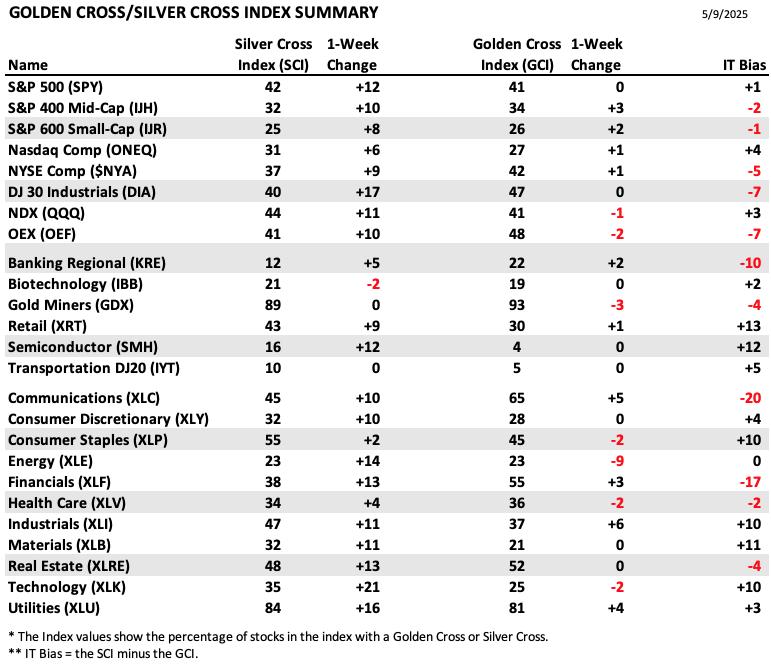
PARTICIPATION TABLES: The following tables summarize participation for the major market indexes and sectors. The 1-Week Change columns inject a dynamic aspect to the presentation. There are three groups: Major Market Indexes, Miscellaneous Industry Groups, and the 11 S&P 500 Sectors.
IT Biases are now starting to have positive readings which is good for the market. The highest goes to Retail (XRT) which is definitely improving given the adds to both the SCI and GCI. Readings are still below our bullish 50% threshold so caution should be applied.
This table is sorted by SCI values. This gives a clear picture of strongest to weakest index/sector in terms of intermediate-term participation.
All but three of the members of our list gained SCI points which is a sign that this market could continue to move higher from here. The greatest gain was seen by Technology (XLK), but we do note its SCI reading is at a low 35%.
Biotechs (IBB) lost ground on the SCI this week as they have really begun to suffer.
We also note that all but three members of our list hold readings above our bullish 50% threshold. This does look like a market healing itself, but based on the SCIs and GCIs, more work needs to be done.
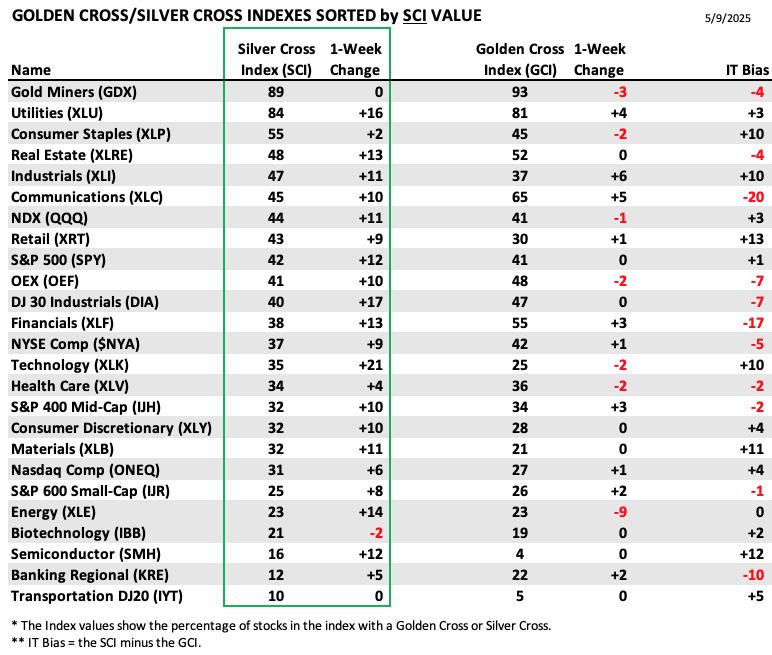
This table is sorted by GCI values. This gives a clear picture of strongest to weakest index/sector in terms of long-term participation.
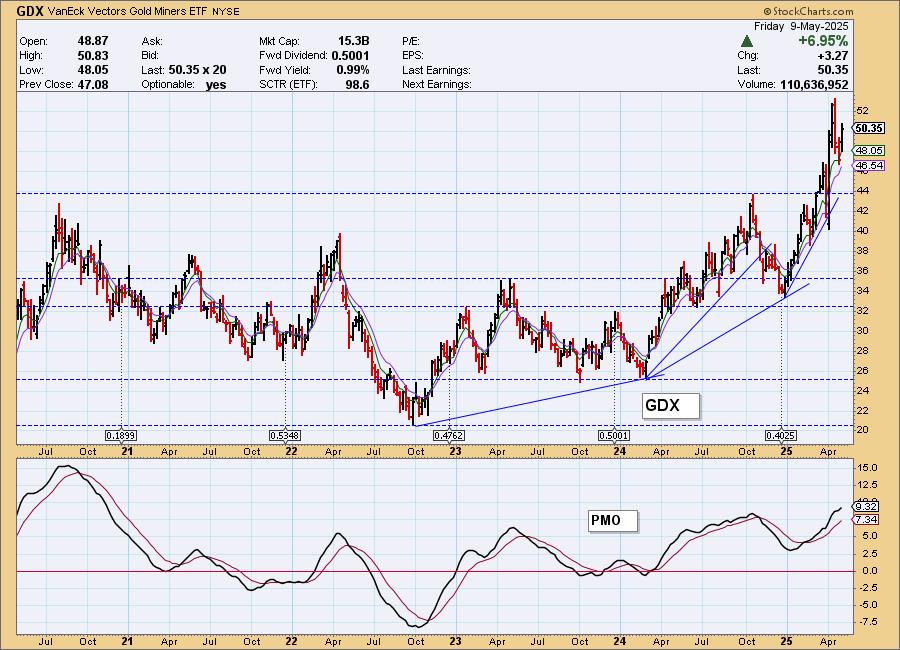
The highest GCI reading goes to Gold Miners (GDX). They are starting to show some weakness as three points were lost this week.
All but three of the members of our list have GCI readings below our bullish 50% threshold. As noted above more work needs to be done to preserve this rally.

PARTICIPATION CHART (S&P 500): The following chart objectively shows the depth and trend of participation for the SPX in two time frames.
- Intermediate-Term - the Silver Cross Index (SCI) shows the percentage of SPX stocks on IT Trend Model BUY signals (20-EMA > 50-EMA). The opposite of the Silver Cross is a "Dark Cross" -- those stocks are, at the very least, in a correction.
- Long-Term - the Golden Cross Index (GCI) shows the percentage of SPX stocks on LT Trend Model BUY signals (50-EMA > 200-EMA). The opposite of a Golden Cross is the "Death Cross" -- those stocks are in a bear market.
The market bias is BULLISH in the intermediate term.
The market bias is BEARISH in the long term.
Participation is holding above our bullish 50% thresholds so we should see both the Silver Cross Index and Golden Cross Index move higher from here. These readings could support more rally. The Silver Cross Index is above its signal line so the IT Bias is BULLISH. The Golden Cross Index is below its signal line so the LT Bias is BEARISH.
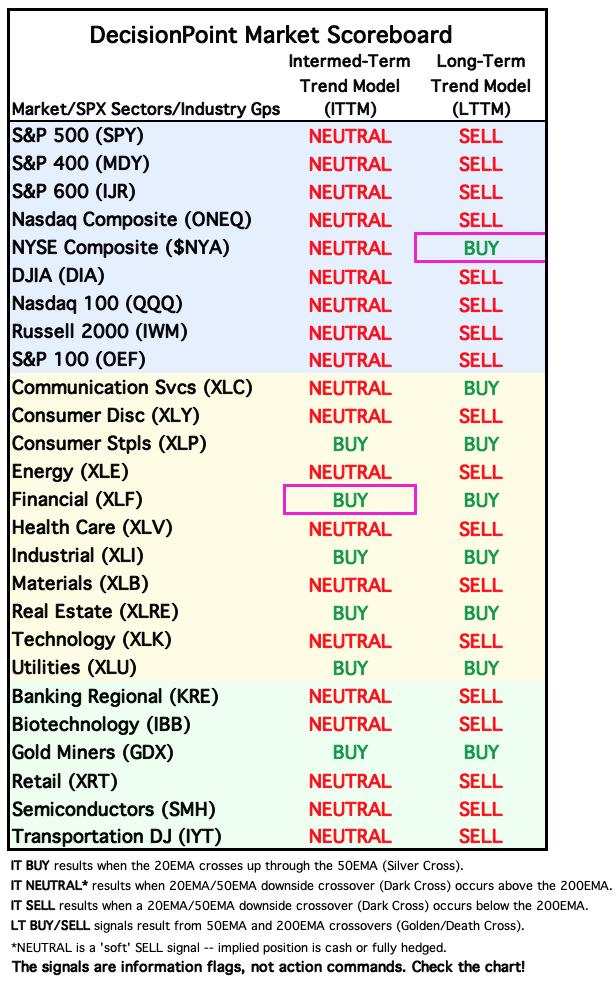
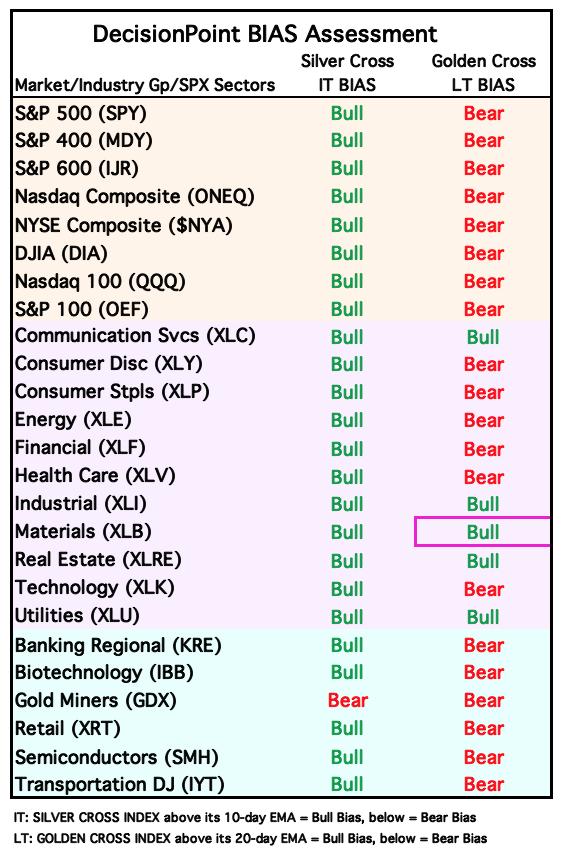
BIAS Assessment: The following table expresses the current BIAS of various price indexes based upon the relationship of the Silver Cross Index to its 10-day EMA (intermediate-term), and of the Golden Cross Index to its 20-day EMA (long-term). When the Index is above the EMA it is bullish, and it is bearish when the Index is below the EMA. The BIAS does not imply that any particular action should be taken. It is information to be used in the decision process.
The items with highlighted borders indicate that the BIAS changed today.
*****************************************************************************************************
CONCLUSION: The market spent the week mostly consolidating sideways with a negative finish. We expect more short-term weakness given the STOs have topped and are in declining trends. Past that, the majority of our indicators are bullish and the Bias Table is very green so we have to expect this rally will continue on. Since we do see weakness with the STOs, we would look for a difficult week ahead, but ultimately we don't see a large decline in the near future with participation holding up. The market is in rebuild mode. There is still work to do as far as the level of the Silver Cross Index and Golden Cross Index which are below our bullish 50% threshold. We would look for some decline next week or at best consolidation. This, of course, could be turned on its head if another trade deal is announced.
Erin is 10% long, 0% short. (This is intended as information, not a recommendation.)
*****************************************************************************************************
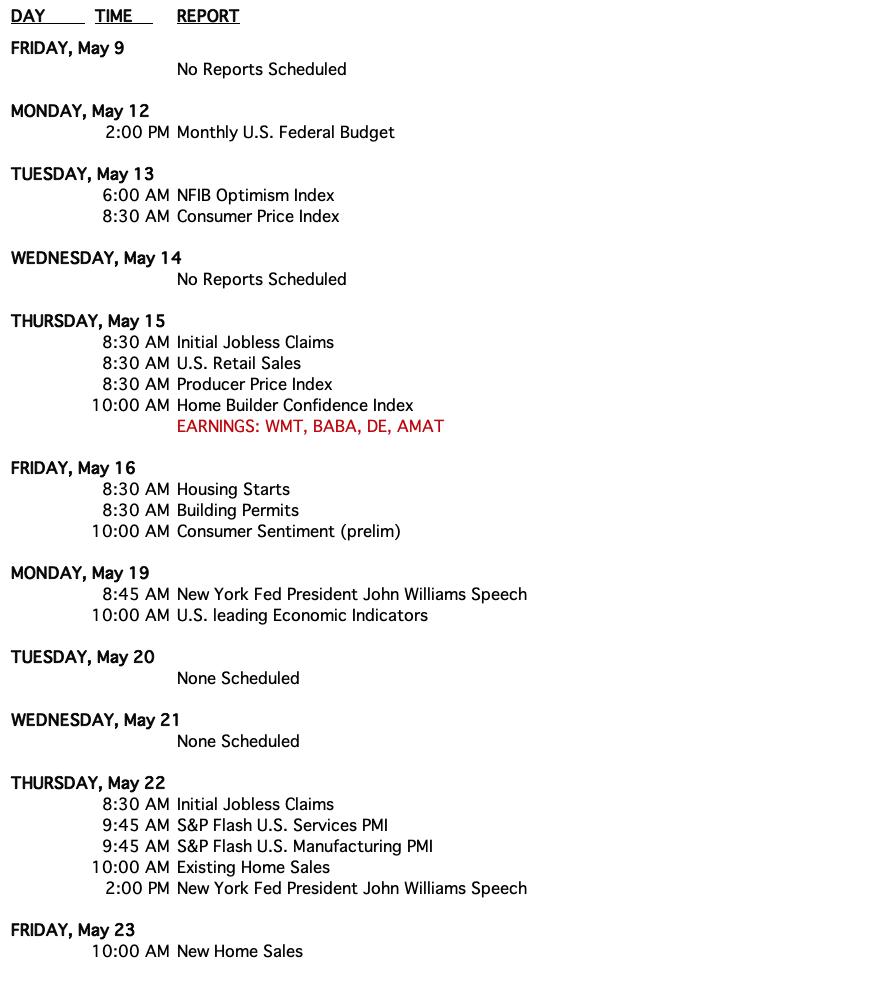
CALENDAR
BITCOIN
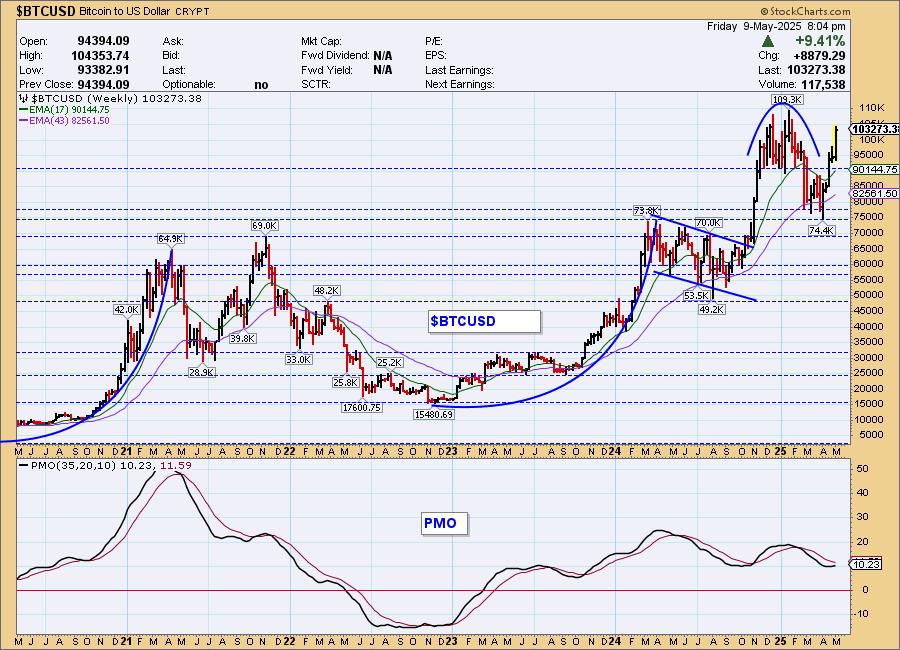
Bitcoin Daily Chart: Bitcoin rallied strongly this week after a period of consolidation. We believe that it will make new all-time highs soon given the rising PMO and Stochastics. There is the problem of an overbought RSI, but Bitcoin generally has no problem holding those conditions so more upside is likely.
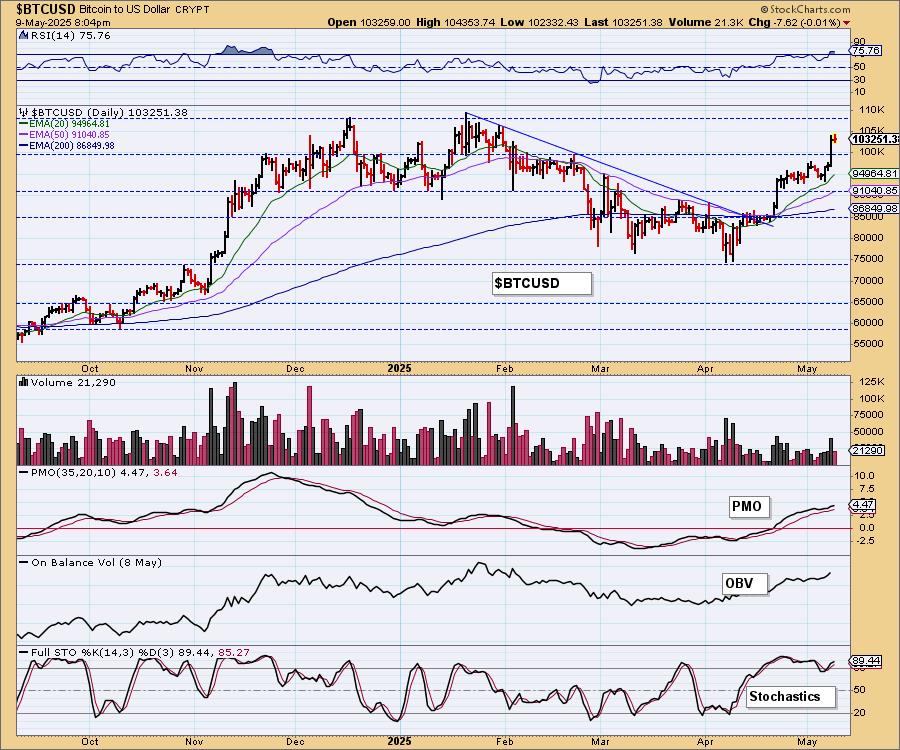
Bitcoin Weekly Chart: We can see that Bitcoin is up to its old tricks. We get a period of strong rally and then consolidation or decline back to support and then another rush ahead. The weekly PMO is rising. It looks like this is the next leg up and that should take price to all-time highs again.
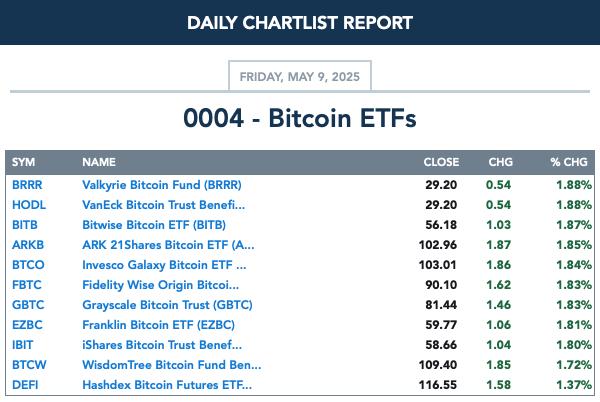
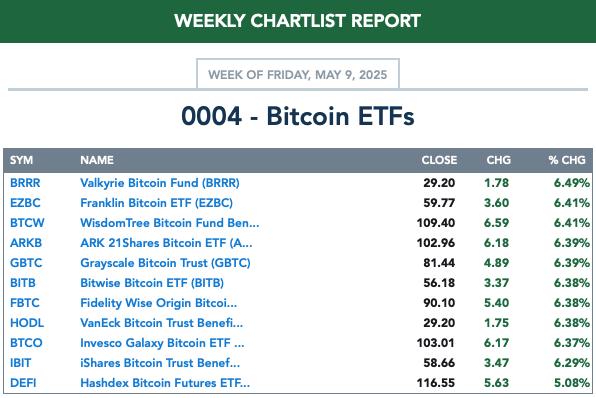
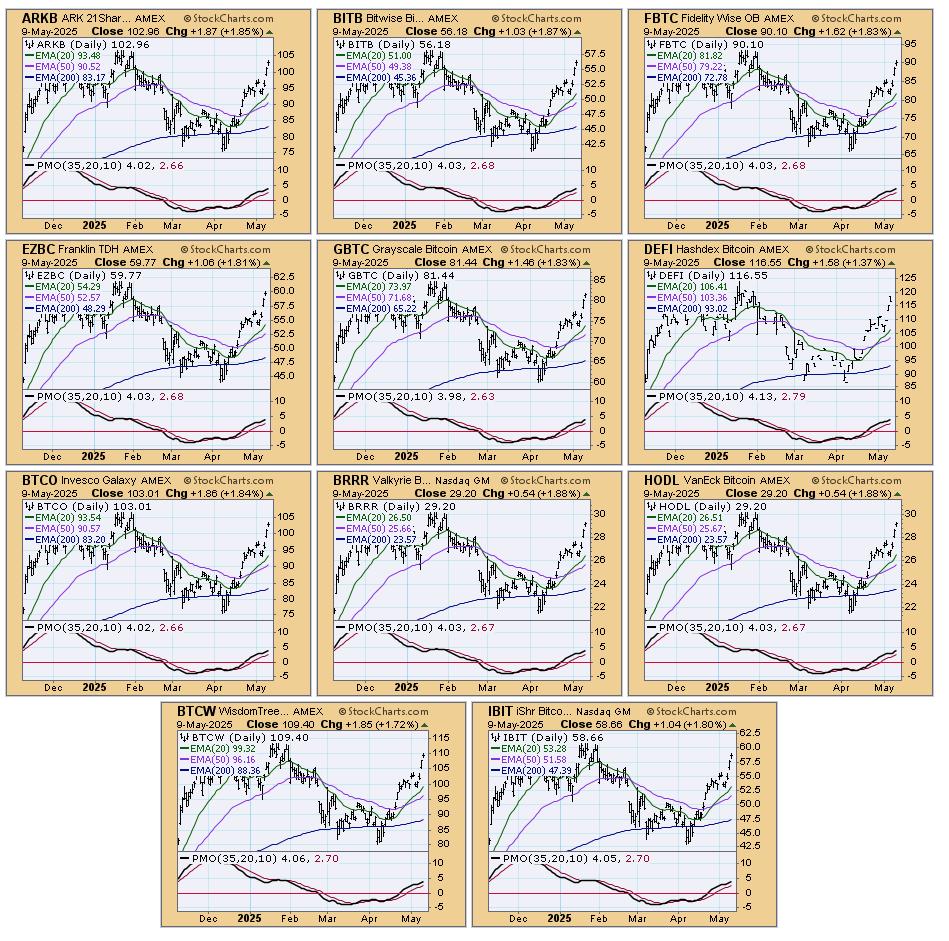
BITCOIN ETFs
Today:
This Week:
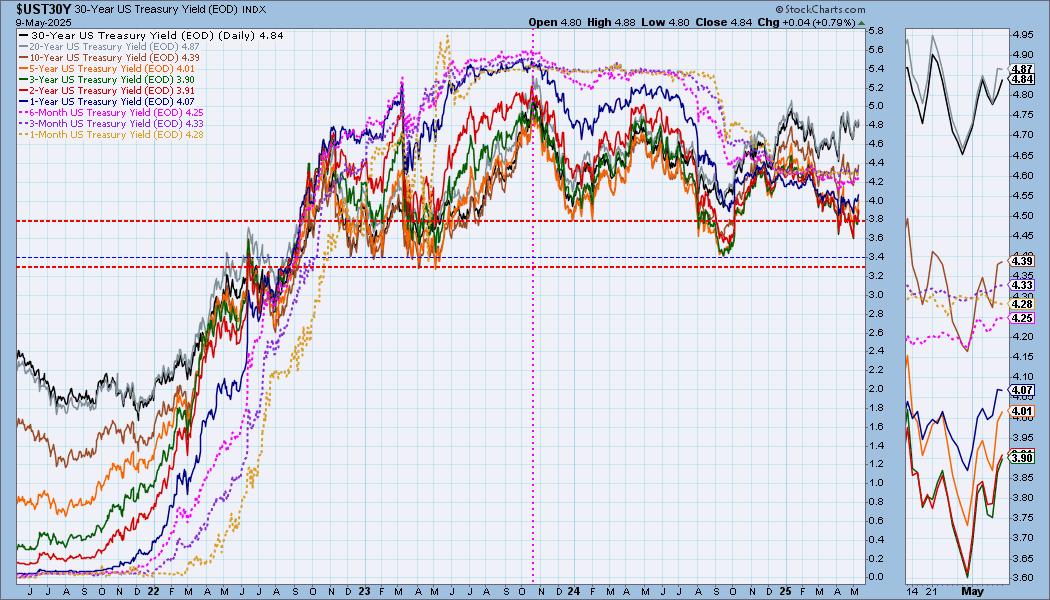
INTEREST RATES
Yields were mostly up on the day. They have new rising trends in place so we expect them to rise further from here.
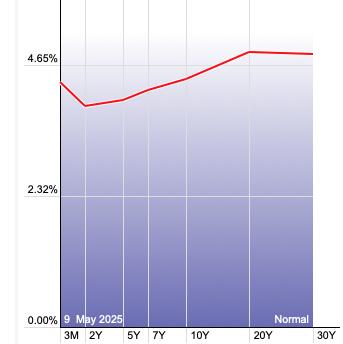
The Yield Curve Chart from StockCharts.com shows us the inversions taking place. The red line should move higher from left to right. Inversions are occurring where it moves downward.
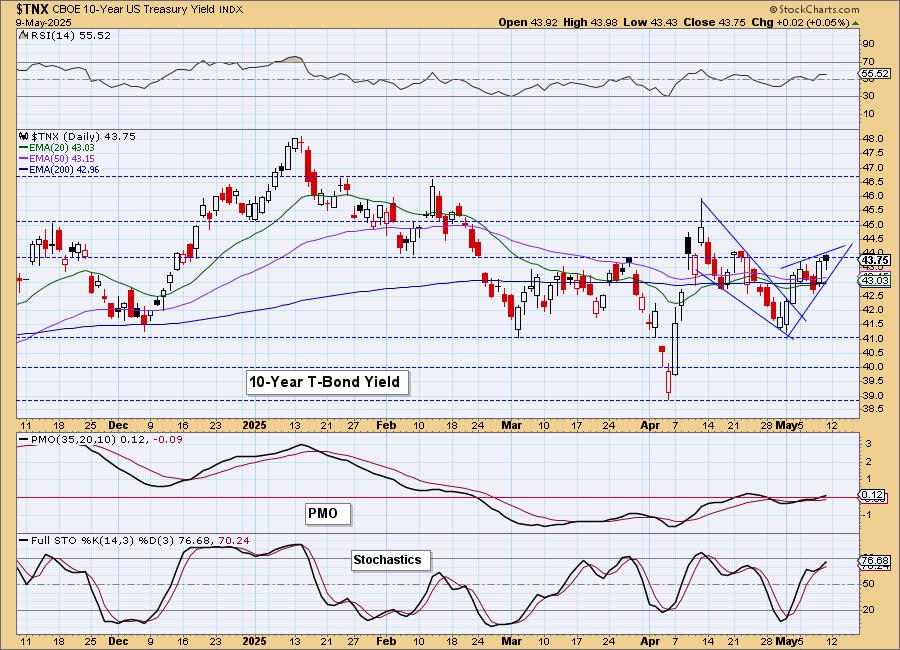
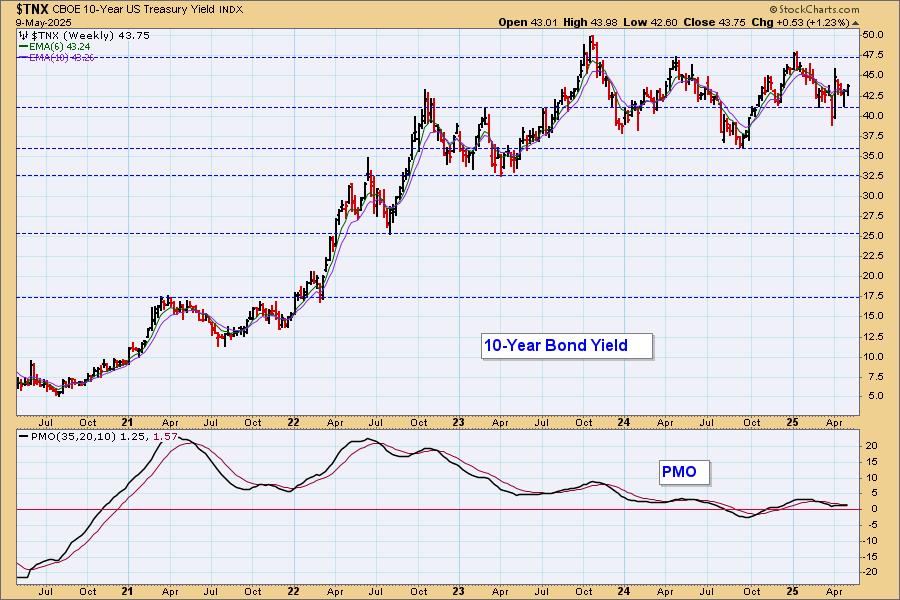
10-YEAR T-BOND YIELD
This looks like a good rally, but it is noteworthy that we now have a bearish rising wedge in the very short-term and that generally leads to a breakdown. Today we did see a bearish filled black candlestick so a decline may be in the cards on Monday. However, overall we have a rising trend out of the April low and the PMO is now in positive territory. We could see a hiccup off this bearish pattern, but ultimately we do expect the rising trend to continue.
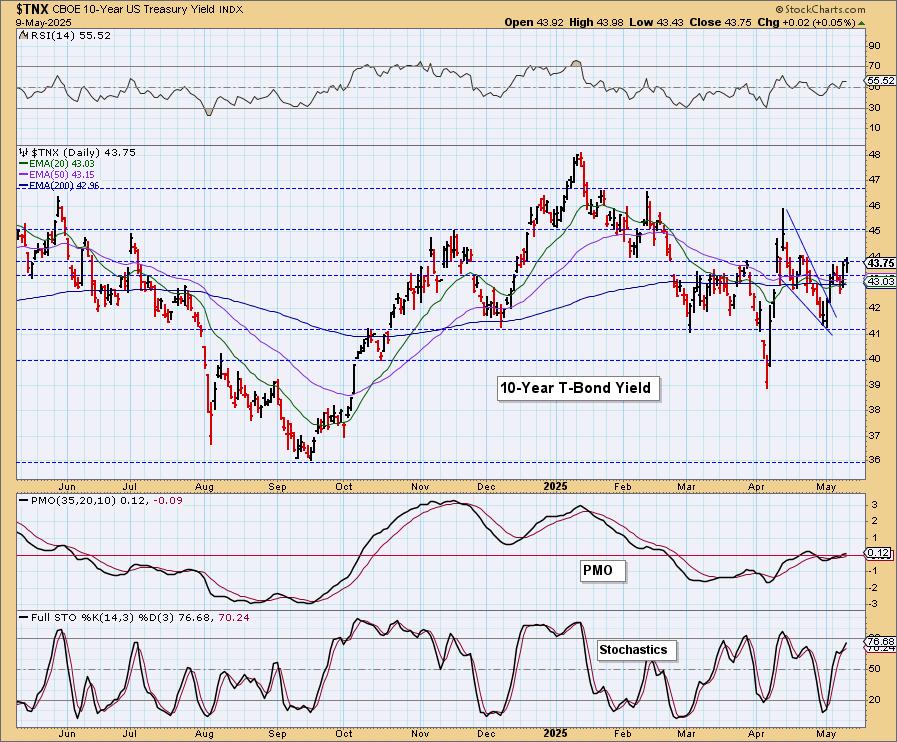
10-Year Bond Yield Weekly Chart: It appears $TNX will come back up to the top of its current trading range. It did not require a trip to the 2024 low before this upside reversal and that is bullish. The weekly PMO is flat, but wants to rise.
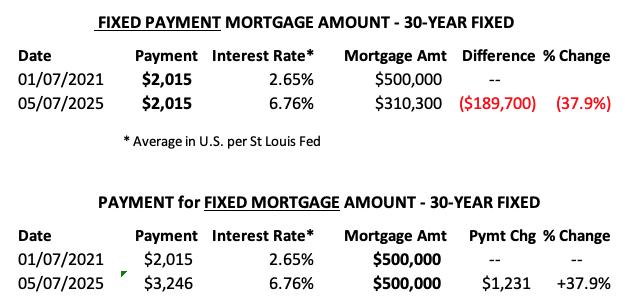
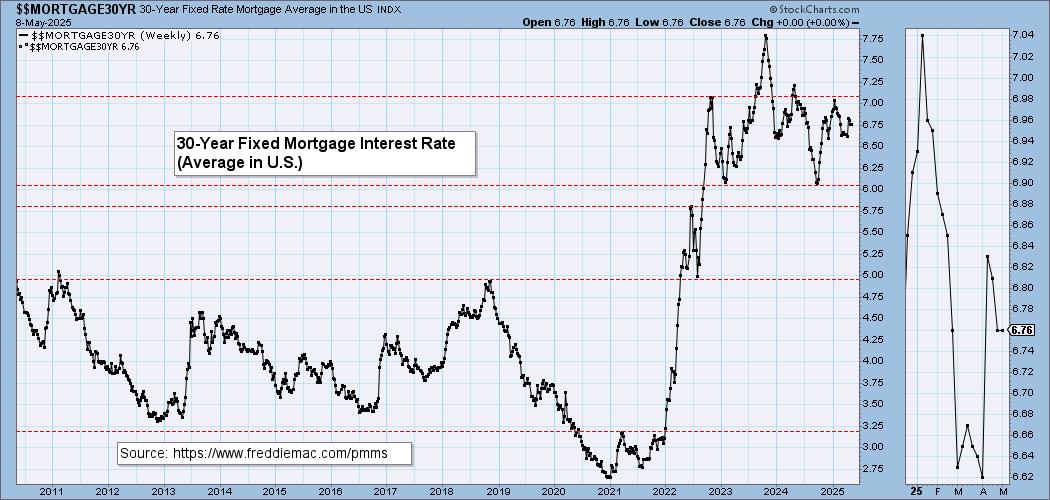
MORTGAGE INTEREST RATES (30-Yr)**
**We watch the 30-Year Fixed Mortgage Interest Rate, because, for the most part, people buy homes based upon the maximum monthly payment they can afford. As rates rise, a fixed monthly payment will carry a smaller mortgage amount, which shuts many buyers out of the market, and potential sellers will experience pressure to lower prices (to no effect so far).
--
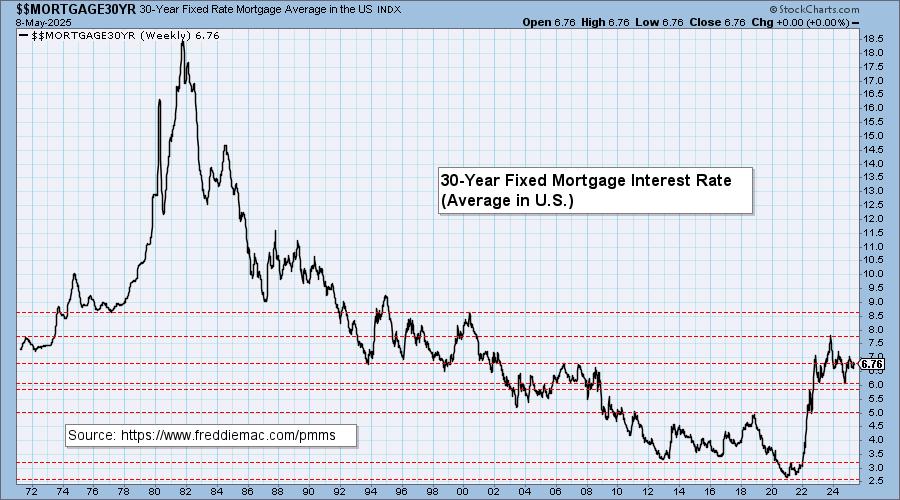
This week the 30-Year Fixed Rate was unchanged at 6.76.
Here is a 50-year chart for better perspective.
BONDS (TLT)
IT Trend Model: SELL as of 4/14/2025
LT Trend Model: SELL as of 12/13/2024
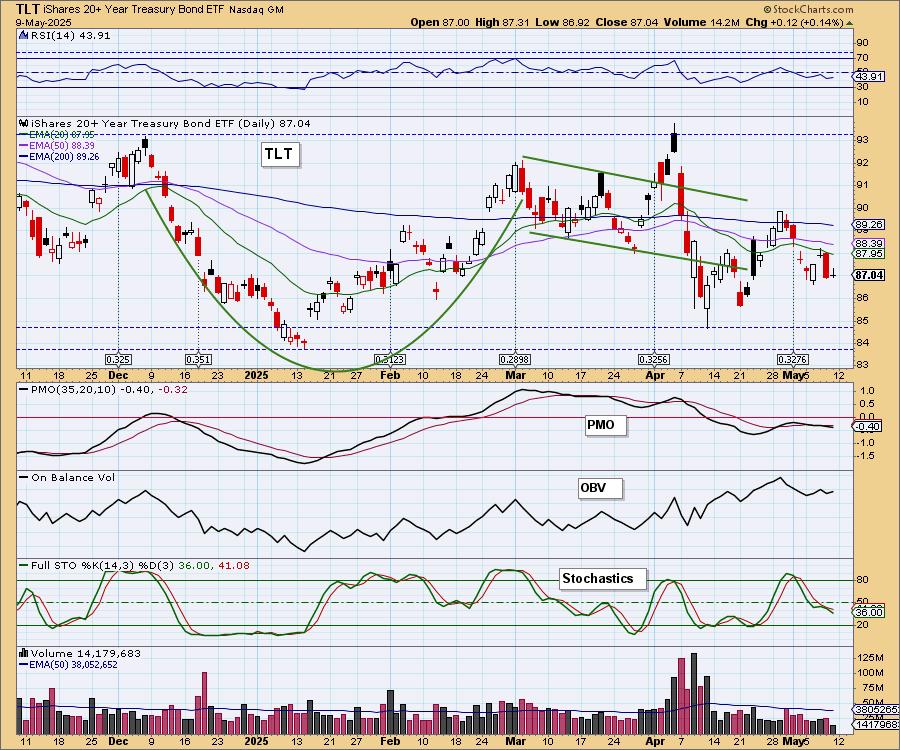
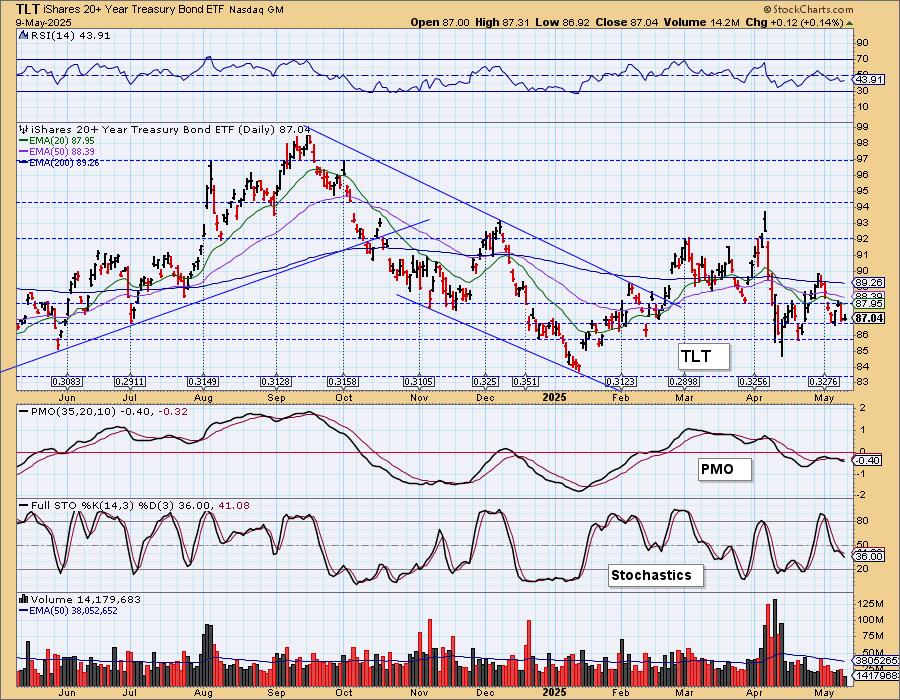
TLT Daily Chart: Bonds look bearish to us. We have a short-term declining trend and indicators are not configured positively. The RSI is negative and the PMO is in decline on a Crossover SELL Signal. Stochastics are also falling. We would look for Bonds to fall from here.
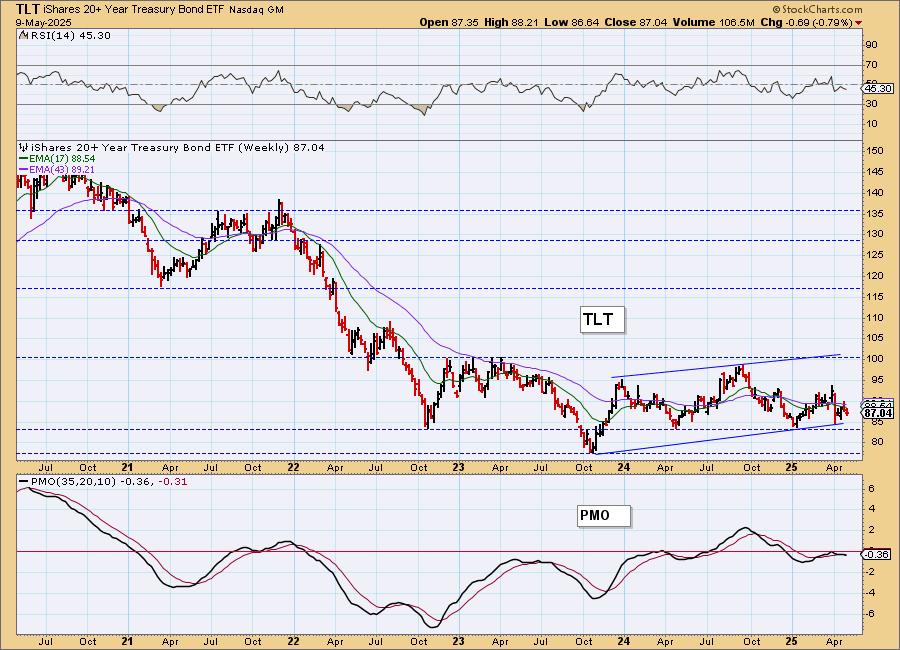
TLT Weekly Chart: We have a gently rising trend channel on the weekly chart. Price is struggling to hold this support. The weekly PMO has triggered a Crossover SELL Signal so we should look for more downside in the intermediate term.
DOLLAR (UUP)
IT Trend Model: NEUTRAL as of 3/5/2025
LT Trend Model: SELL as of 4/25/2025
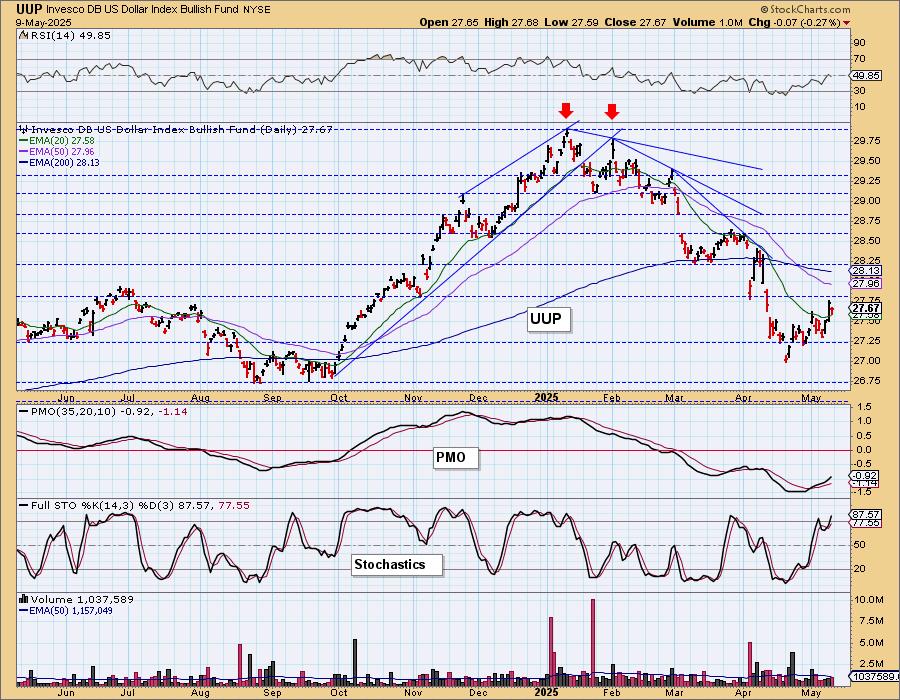
UUP Daily Chart: The Dollar broke out yesterday but essentially reentered the prior declining trend on today's drop. The indicators still look bullish so we are expecting the Dollar to rally further, at least to the next declining tops trendline. The PMO is rising and Stochastics just pushed above 80. The RSI is very close to positive territory.
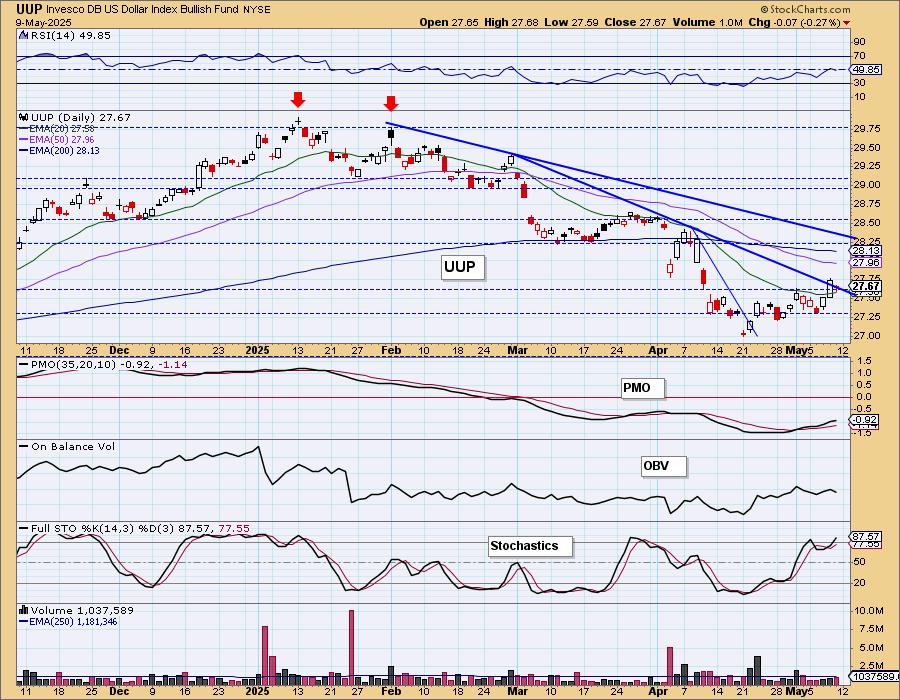
Horizontal resistance is nearing, but we expect it to be broken.
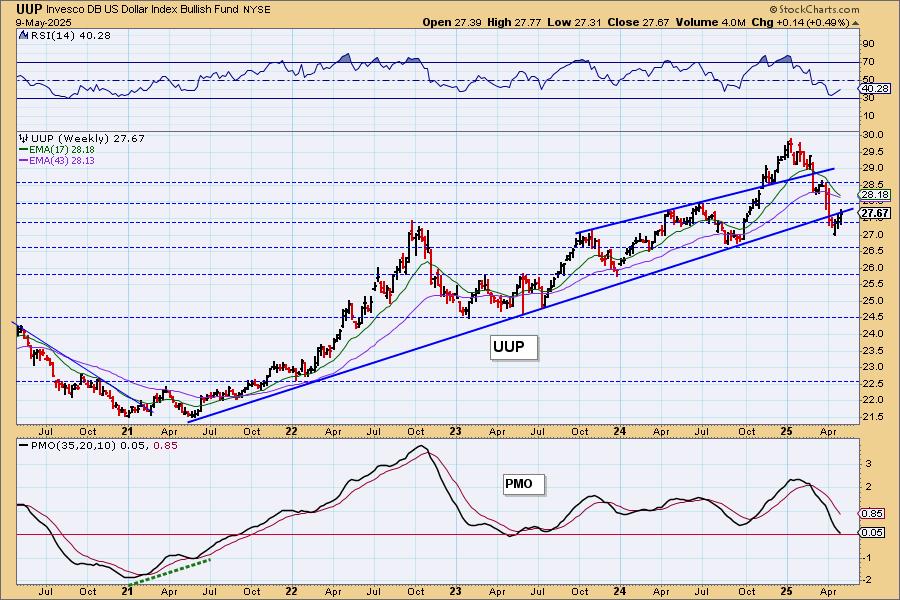
UUP Weekly Chart: Price is reentering the bearish rising wedge. The weekly PMO looks very bearish, but we like this upside reversal that occurred above support at 26.50.
GOLD
IT Trend Model: NEUTRAL as of 12/23/2024
LT Trend Model: BUY as of 10/20/2023
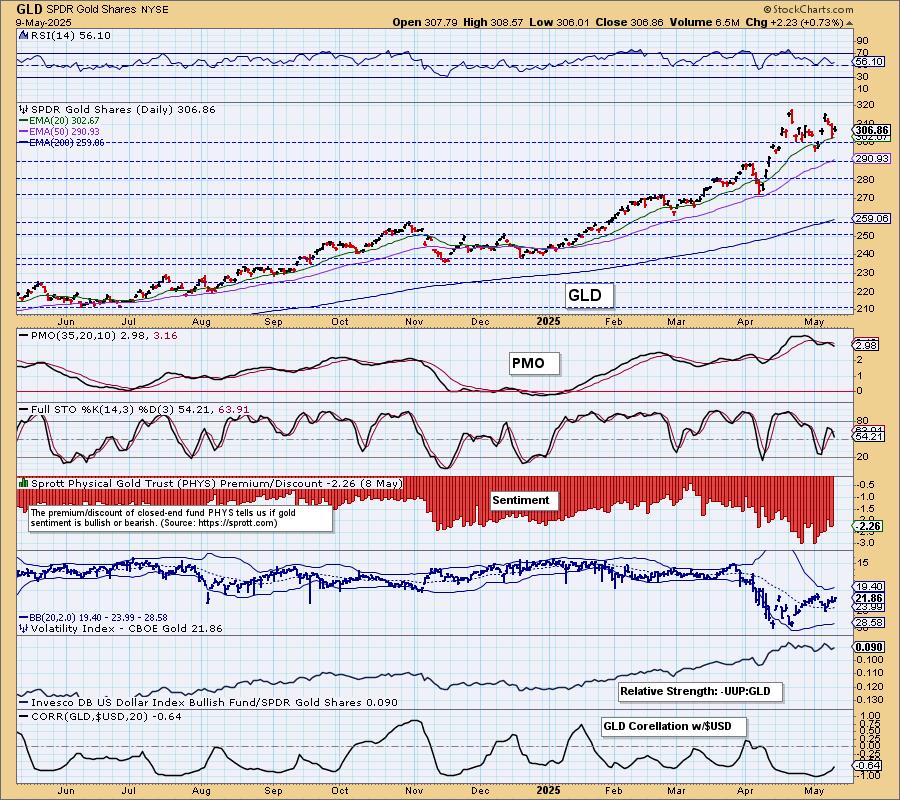
GLD Daily Chart: We see the development of a bearish double top on Gold. It will need to break below the support zone to confirm the pattern so it still has time to turn it around. The Dollar looks mildly bullish so we would expect Gold will continue to show some weakness, but in the longer term, we definitely like Gold. Short-term there are some problems. The PMO is in decline and so are Stochastics.

Investors are very bearish on Gold right now. Discounts have backed off extremes so now we just read this as bearish. Bearish extremes usually lead to higher prices, but these aren't necessarily at extremes right now.
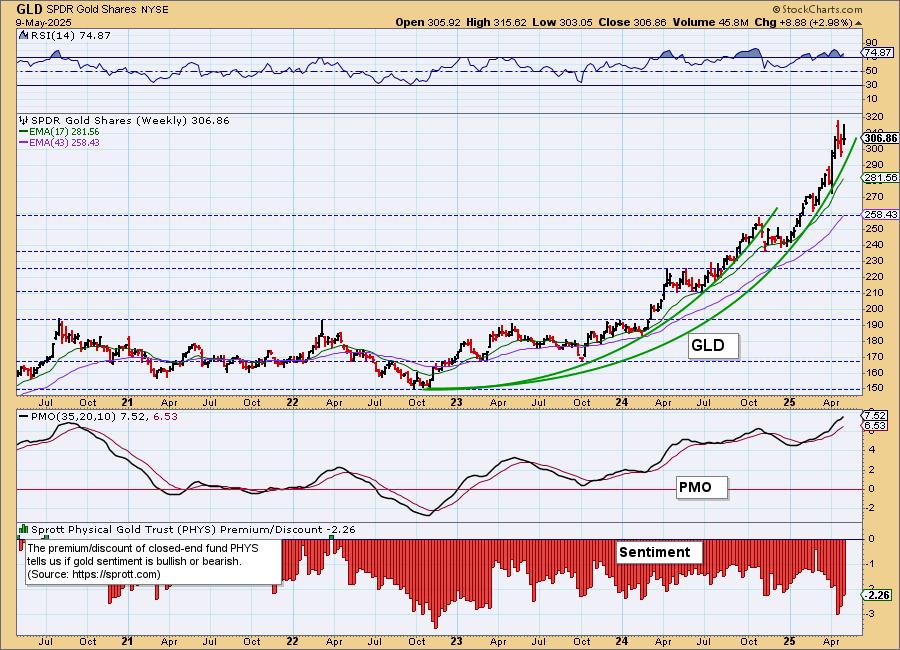
GLD Weekly Chart: Gold broke its first parabolic advance with some high level consolidation. We are now in another parabolic advance that calls for a correction in Gold. It isn't that bearish yet to expect a big breakdown. Price is not quite vertical yet either. The weekly PMO is very bullish so we think this advance in the intermediate term will continue.
GOLD MINERS Daily Chart: GDX is rallying off support and it looks pretty good for more upside given the indicators. The only issue would be weakness in Gold that we are currently detecting. That will put a damper on this rally. Gold and Gold Miners can travel differently from each other, but it will mean a slower advance (if at all) for Gold Miners if Gold struggles. The PMO has turned up on GDX and the RSI is positive. The Silver and Golden Cross Indexes are at very high readings and participation is very strong. We could get more upside here in spite of Gold.

GDX Weekly Chart: We have a parabolic advance on Gold Miners right now and that begs for a correction. However, they do look very bullish on the daily chart and the weekly PMO is on the rise so we don't think we're in for a correction yet.
CRUDE OIL (USO)
IT Trend Model: NEUTRAL as of 2/27/2025
LT Trend Model: BUY as of 3/31/2025
USO Daily Chart: We have a bullish double bottom developing on Crude Oil. We like this rally but sense that it will fail at the upcoming resistance zone. One reason is that the PMO is at a very low level implying weakness. There is a good chance this rally will fail. Fundamentals are higher production which generally leads to lower prices.
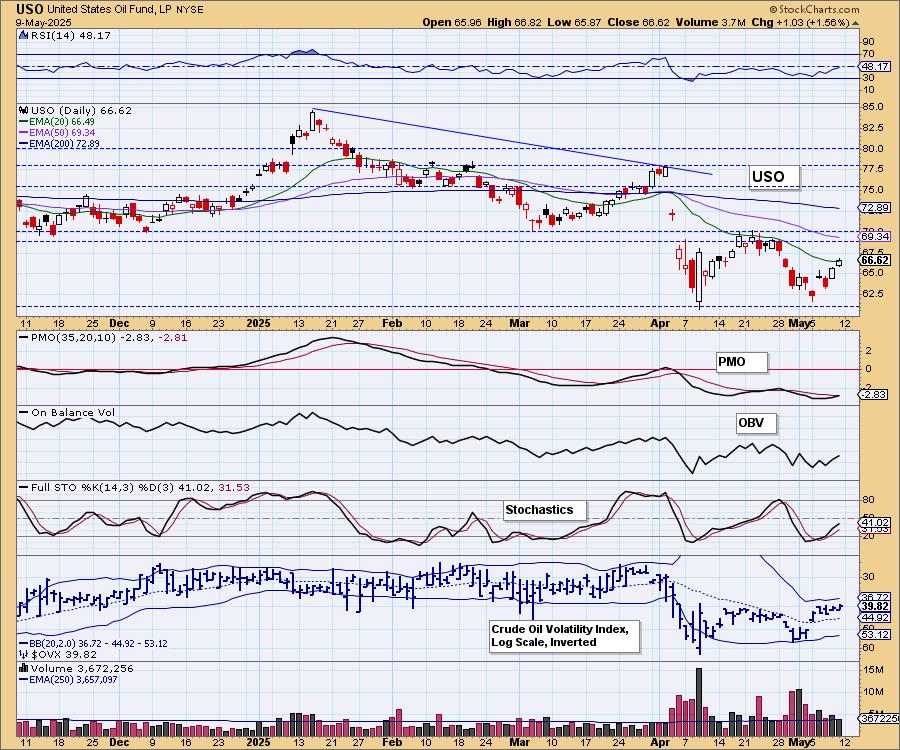
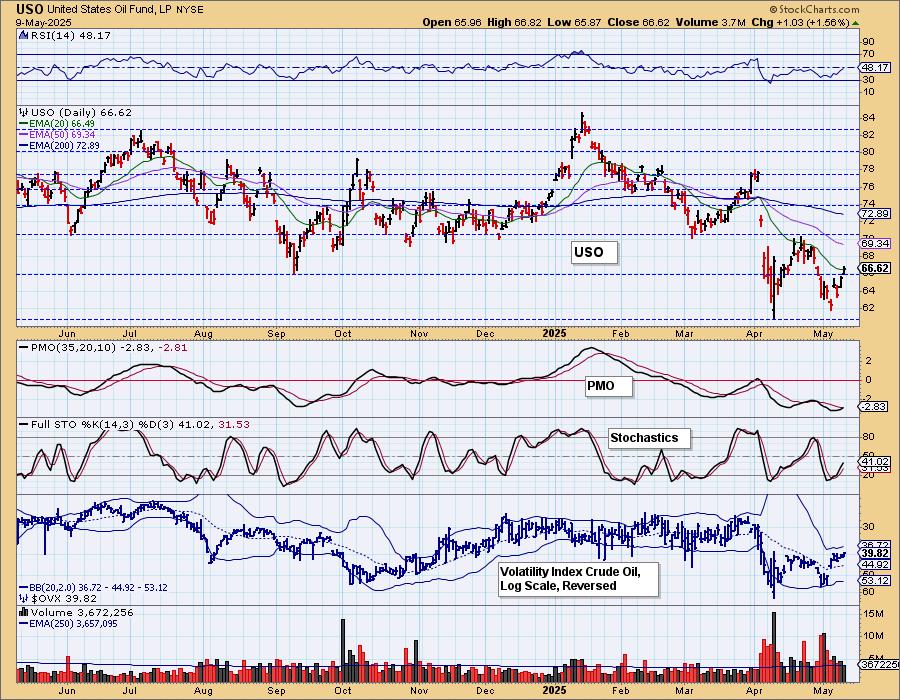
USO/$WTIC Weekly Chart: We have a very long-term trading range on USO and price is near the bottom. This is a good place for a rally. Another reason we think price will fail at overhead resistance on the daily chart is that the weekly PMO is still in decline.

Good Luck & Good Trading!
Erin Swenlin and Carl Swenlin
Technical Analysis is a windsock, not a crystal ball. --Carl Swenlin
(c) Copyright 2025 DecisionPoint.com
Disclaimer: This blog is for educational purposes only and should not be construed as financial advice. The ideas and strategies should never be used without first assessing your own personal and financial situation, or without consulting a financial professional. Any opinions expressed herein are solely those of the author, and do not in any way represent the views or opinions of any other person or entity.
DecisionPoint is not a registered investment advisor. Investment and trading decisions are solely your responsibility. DecisionPoint newsletters, blogs or website materials should NOT be interpreted as a recommendation or solicitation to buy or sell any security or to take any specific action.
NOTE: The signal status reported herein is based upon mechanical trading model signals, specifically, the DecisionPoint Trend Model. They define the implied bias of the price index based upon moving average relationships, but they do not necessarily call for a specific action. They are information flags that should prompt chart review. Further, they do not call for continuous buying or selling during the life of the signal. For example, a BUY signal will probably (but not necessarily) return the best results if action is taken soon after the signal is generated. Additional opportunities for buying may be found as price zigzags higher, but the trader must look for optimum entry points. Conversely, exit points to preserve gains (or minimize losses) may be evident before the model mechanically closes the signal.
Helpful DecisionPoint Links:
DecisionPoint Alert Chart List
DecisionPoint Golden Cross/Silver Cross Index Chart List
DecisionPoint Sector Chart List
Price Momentum Oscillator (PMO)