
There were no surprises as far as what the Fed was going to do with rates, leave them the same. The issue became the comments that Chairman Powell shared. He sees a possibility for stagflation but so far the job market is holding steady. Basically there is still a great deal of uncertainty over tariffs and the economy in general so for now they are keeping rates the same.
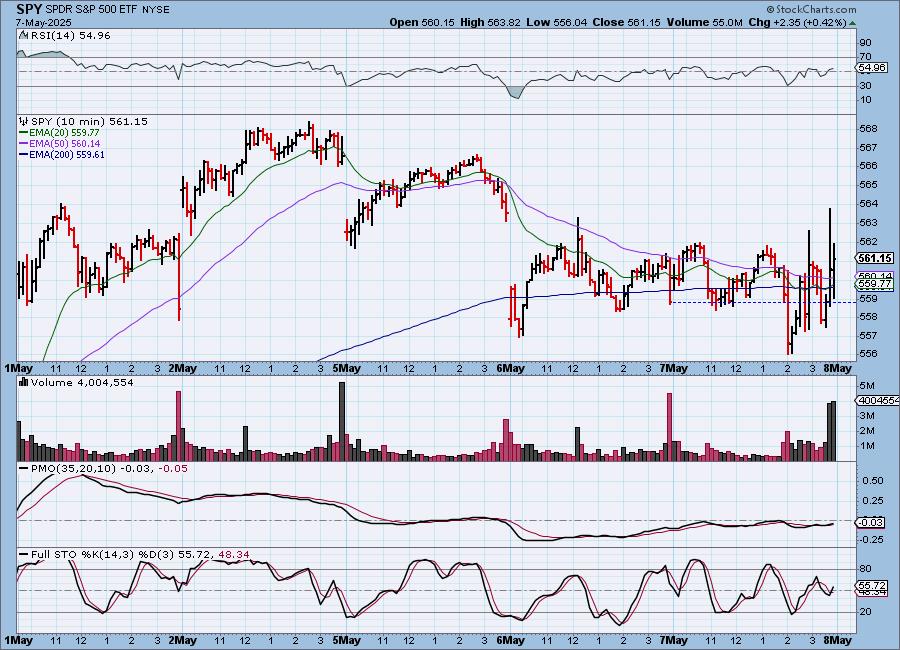
SPY 10-Minute Chart: The Fed announcement caused a great deal of volatility in the afternoon, but ultimately it finished higher on the day, setting up a small rising trend. The 10-minute PMO is rising on a Crossover BUY Signal so we could see some rally to start the day tomorrow.
The DecisionPoint Alert Weekly Wrap presents an end-of-week assessment of the trend and condition of the Stock Market, the U.S. Dollar, Gold, Crude Oil, and Bonds. The DecisionPoint Alert daily report (Monday through Thursday) is abbreviated and gives updates on the Weekly Wrap assessments.
MARKET/INDUSTRY GROUP/SECTOR INDEXES
CLICK HERE for Carl's annotated Market Index, Sector, and Industry Group charts.
THE MARKET (S&P 500)
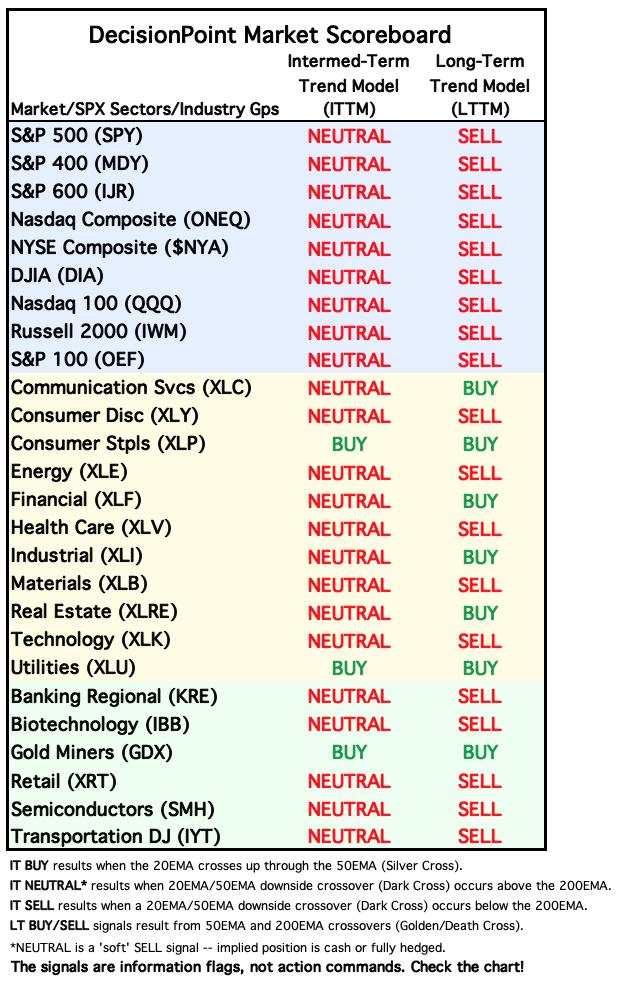
IT Trend Model: NEUTRAL as of 3/4/2025
LT Trend Model: SELL as of 4/16/2025
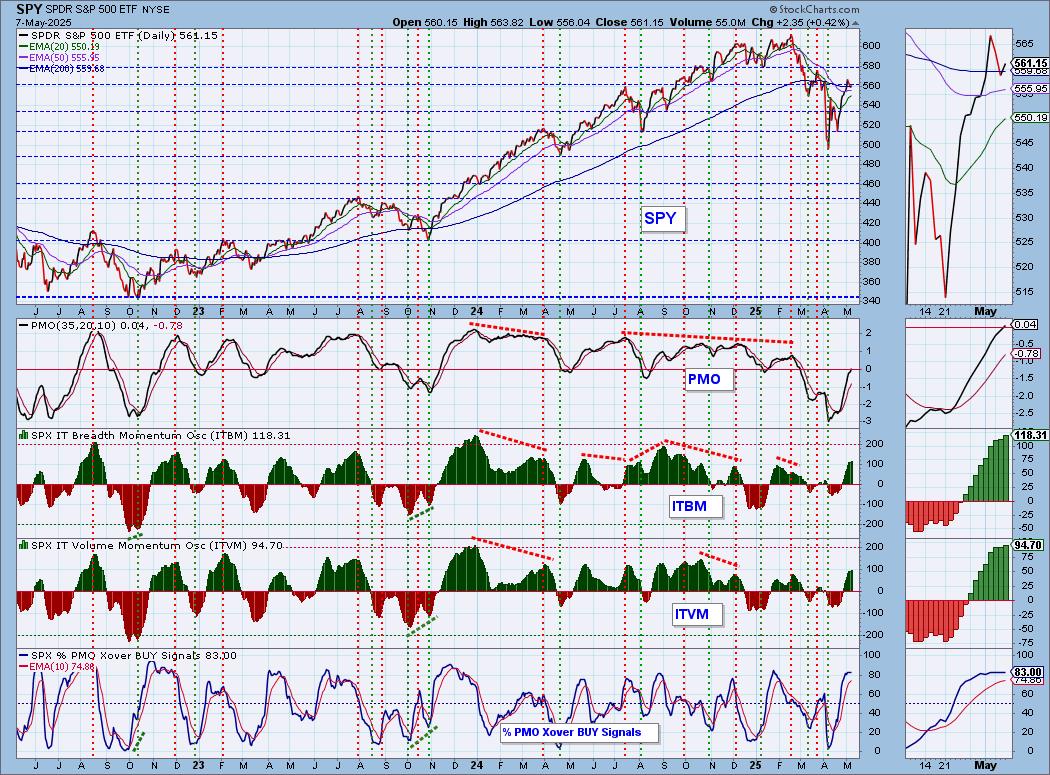
SPY Daily Chart: The PMO has now reached positive territory which does bode well for this current rally. We believe you could also make a case for a new bull flag formation.
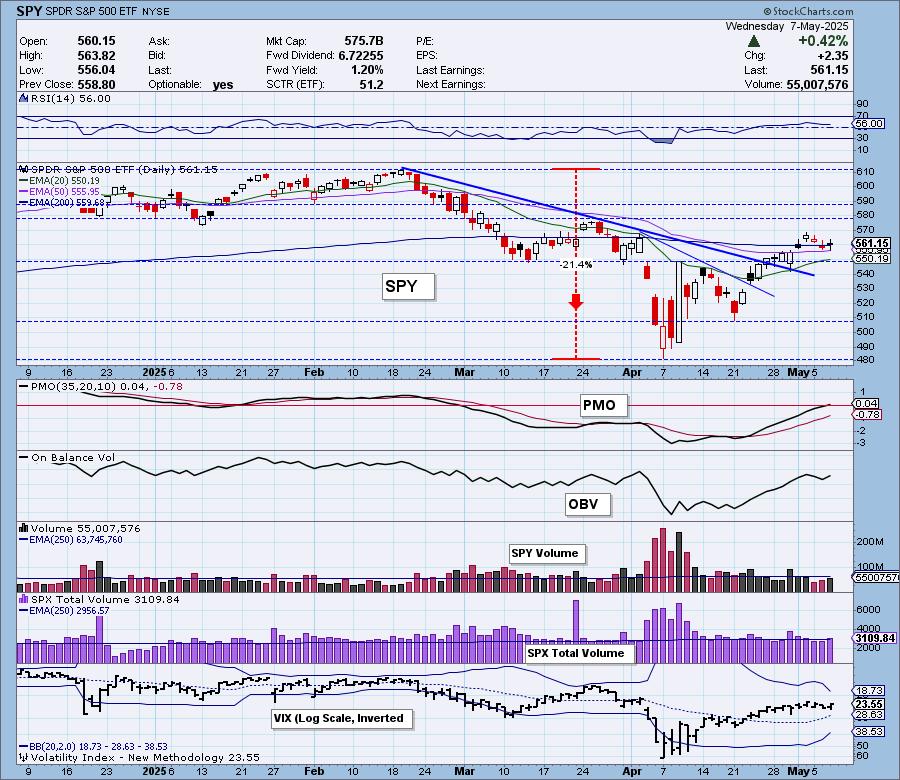
The VIX is holding above its moving average on the inverted scale which is bullish. Stochastics are still headed down which is worrisome, but ultimately they are strong above 80.
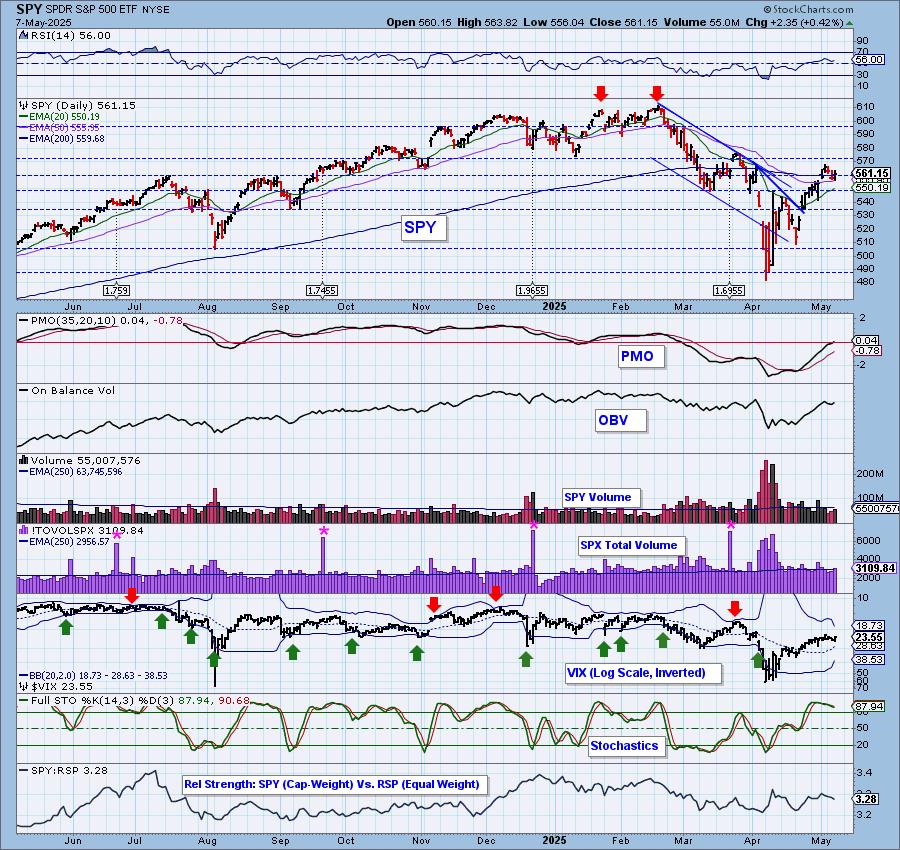
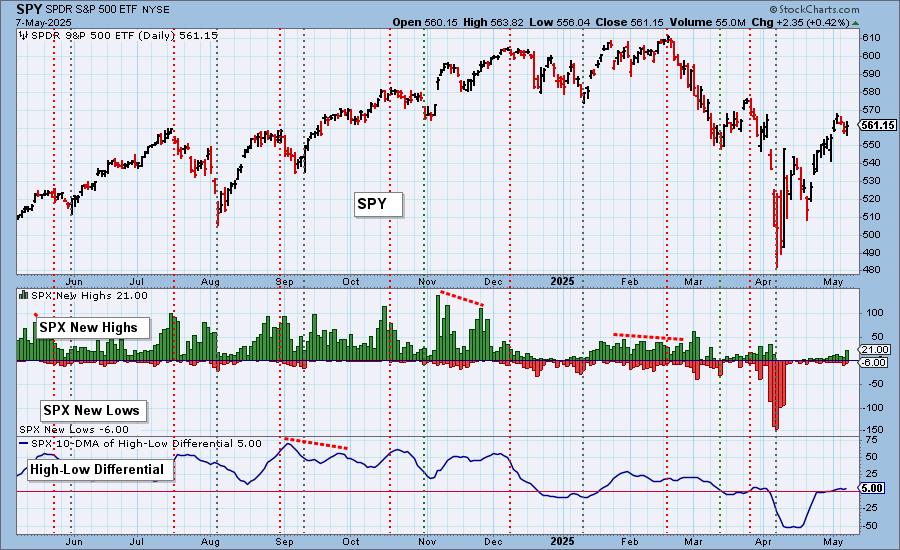
S&P 500 New 52-Week Highs/Lows: New Highs popped on the rally so there are some big winners out there; not very many, but certainly an improvement. New Lows contracted as we would expect. The High-Low Differential is mostly flat, but technically rising again.
Climax* Analysis: There were no climax readings on the four relevant indicators, so today is not a climax day.
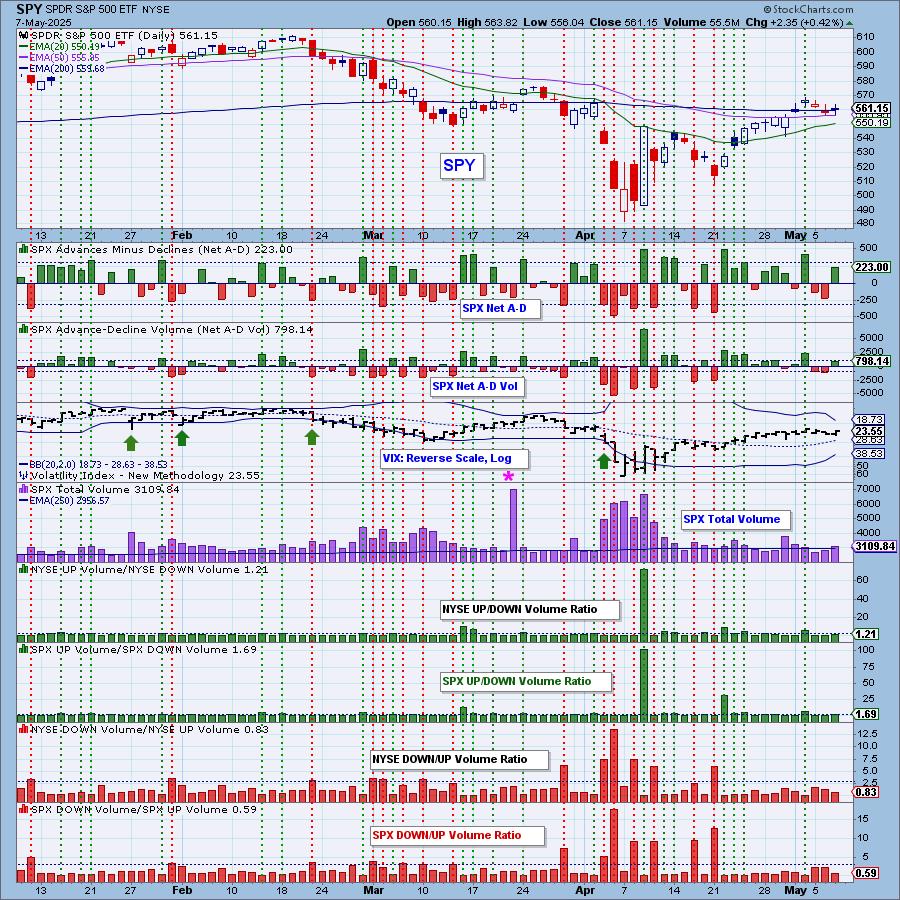
*A climax is a one-day event when market action generates very high readings in, primarily, breadth and volume indicators. We also include the VIX, watching for it to penetrate outside the Bollinger Band envelope. The vertical dotted lines mark climax days -- red for downside climaxes, and green for upside. Climaxes are at their core exhaustion events; however, at price pivots they may be initiating a change of trend.
Short-Term Market Indicators: The short-term market trend is UP and the condition is NEUTRAL.
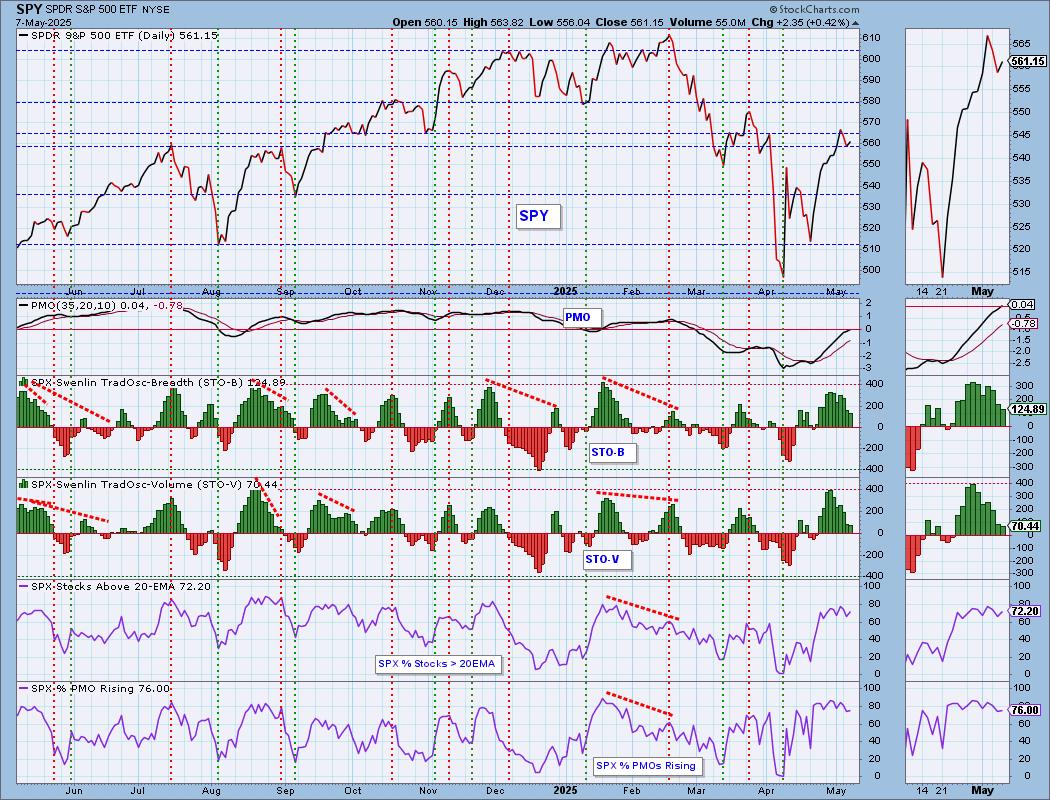
Swenlin Trading Oscillators (STOs) have now left overbought territory. They continue to decline which could put a damper on the current rally. Participation inched higher on the rally. We got a few more rising PMOs.
Intermediate-Term Market Indicators: The intermediate-term market trend is DOWN and the condition is SOMEWHAT OVERBOUGHT.
The ITBM and ITVM are getting overbought. They are already near-term overbought which could be a problem if the bear market returns. We didn't get any gains of PMO BUY Signals.
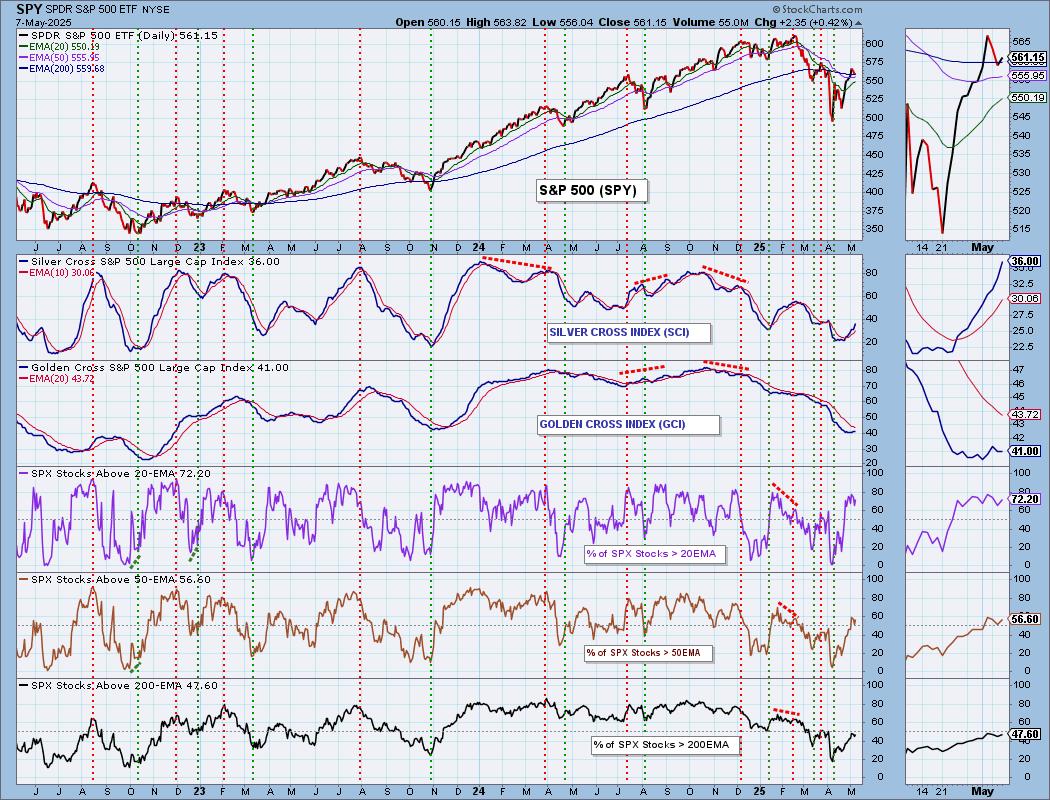
PARTICIPATION CHART (S&P 500): The following chart objectively shows the depth and trend of participation for the SPX in two time frames.
- Intermediate-Term - the Silver Cross Index (SCI) shows the percentage of SPX stocks on IT Trend Model BUY signals (20-EMA > 50-EMA). The opposite of the Silver Cross is a "Dark Cross" -- those stocks are, at the very least, in a correction.
- Long-Term - the Golden Cross Index (GCI) shows the percentage of SPX stocks on LT Trend Model BUY signals (50-EMA > 200-EMA). The opposite of a Golden Cross is the "Death Cross" -- those stocks are in a bear market.
The market bias is BULLISH in the intermediate term.
The market bias is BEARISH in the long term.
Participation of stocks above their 20/50-day EMAs is above our bullish 50% threshold, but we just can't seem to get %Stocks > 200EMA above 50%. We need to build that long-term foundation. The Silver Cross Index looks very bullish on its rise, but we do note it is still at a low 36%. It is above its signal line so the IT Bias is BULLISH. The Golden Cross Index halted its decline and should start to rise again given there are more stocks above their 50/200-day EMAs versus Golden Crosses. It is below its signal line so the LT Bias remains BEARISH.
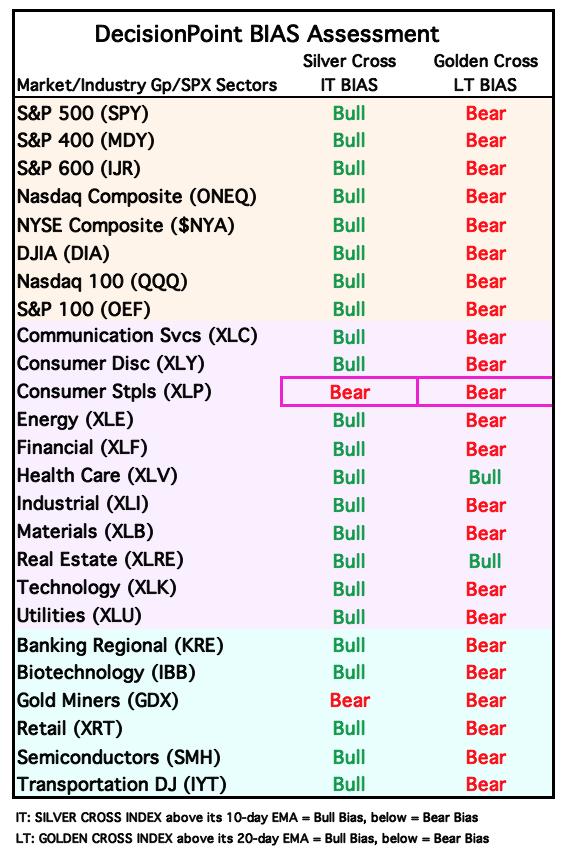
BIAS Assessment: The following table expresses the current BIAS of various price indexes based upon the relationship of the Silver Cross Index to its 10-day EMA (intermediate-term), and of the Golden Cross Index to its 20-day EMA (long-term). When the Index is above the EMA it is bullish, and it is bearish when the Index is below the EMA. The BIAS does not imply that any particular action should be taken. It is information to be used in the decision process.
The items with highlighted borders indicate that the BIAS changed today.
*****************************************************************************************************
CONCLUSION: The Fed announcement held no surprises and ultimately price did rally into the close so investors weren't that concerned about the continued uncertainty brought up by Powell. This bodes well for the SPY. Participation is mostly healthy right now but we still have to deal with falling STOs. So while we do have a rising PMO and ITBM/ITVM, there are problems in the short term. We could see some more weakness given the direction of STOs, but ultimately we have a rising Silver Cross Index and more rising PMOs entering the market. It should be able to hold onto its rising trend for now.
Erin is 10% long, 0% short. (This is intended as information, not a recommendation.)
*****************************************************************************************************
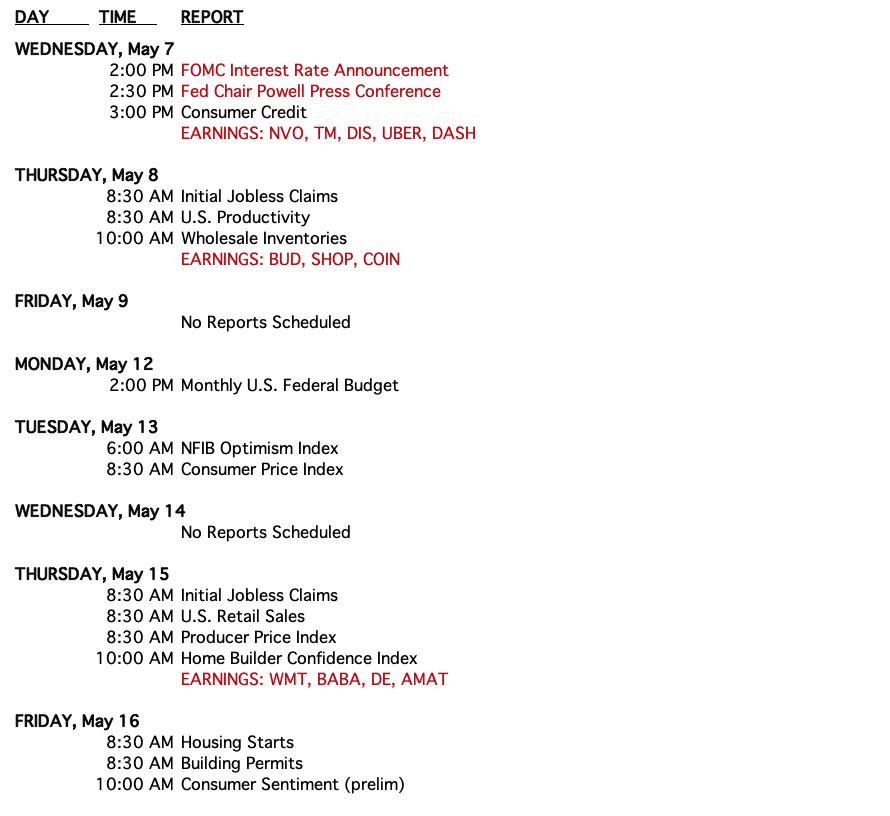
CALENDAR
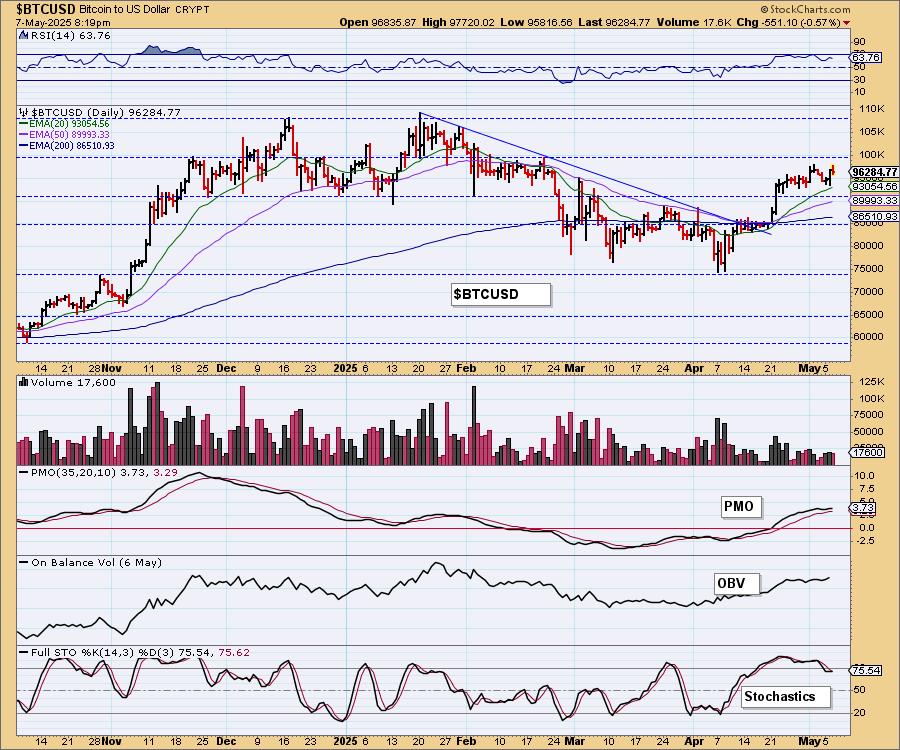
BITCOIN
Bitcoin is essentially digesting its earlier rally. It is melting upward which is bullish. The PMO is on a Crossover BUY Signal above the zero line and Stochastics have tipped upward. We think that Bitcoin will make its way higher, it just may need a bit more consolidation to build up the energy to burst higher.
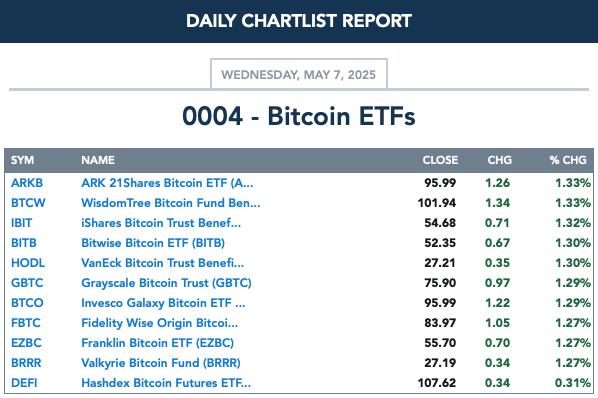
BITCOIN ETFs
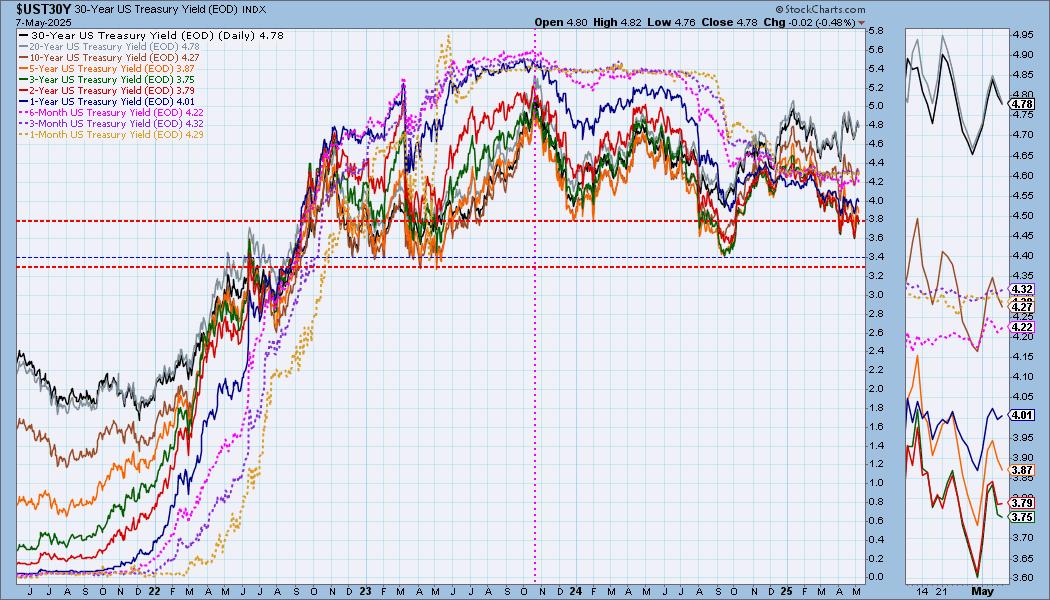
INTEREST RATES
Yields continued to make their way lower today making us less bullish. Erin's Diamond Scans came up with a multitude of Bond funds and that seems to suggest that yields will press lower not higher. We'll see.
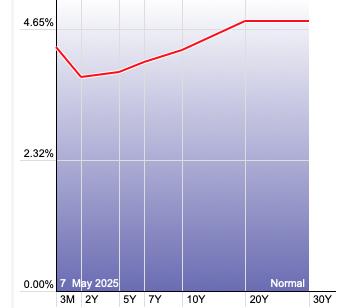
The Yield Curve Chart from StockCharts.com shows us the inversions taking place. The red line should move higher from left to right. Inversions are occurring where it moves downward.
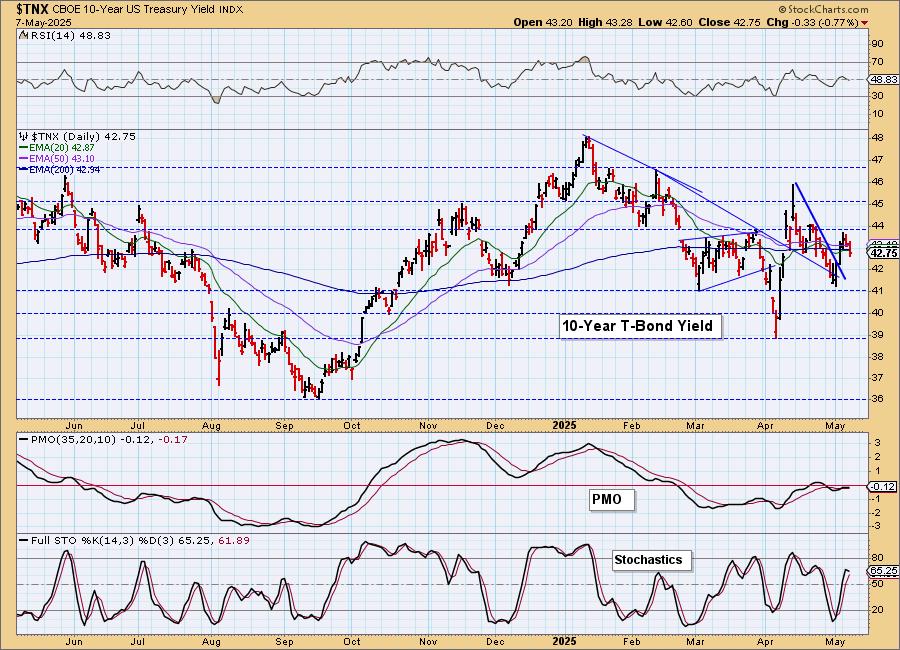
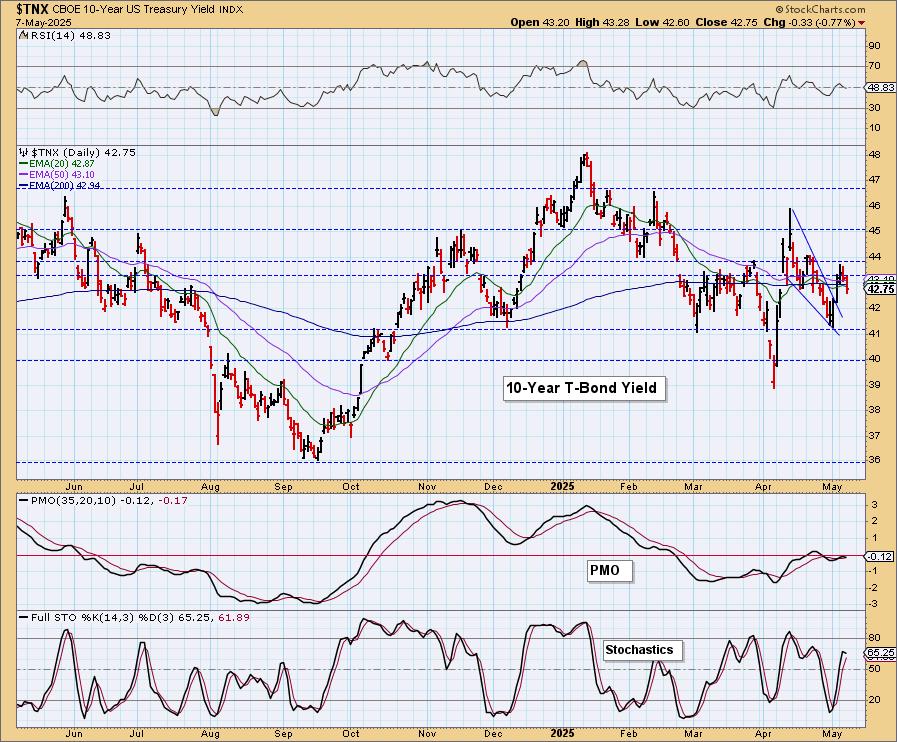
10-YEAR T-BOND YIELD
$TNX is pulling back again. We have a short-term declining trend out of the April high. It had broken that trend, but is already moving lower again. The PMO is technically still on a Crossover BUY Signal, but it has decelerated and appears ready to top beneath the zero line. Stochastics also topped today. It looked like we would have another trip higher, but it is already seeing failure.
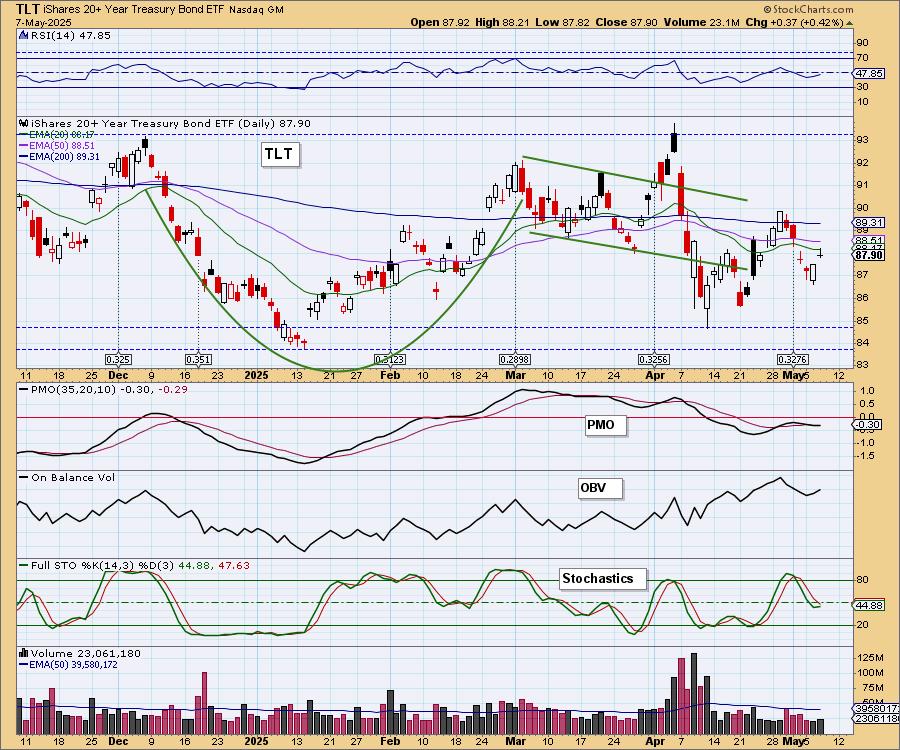
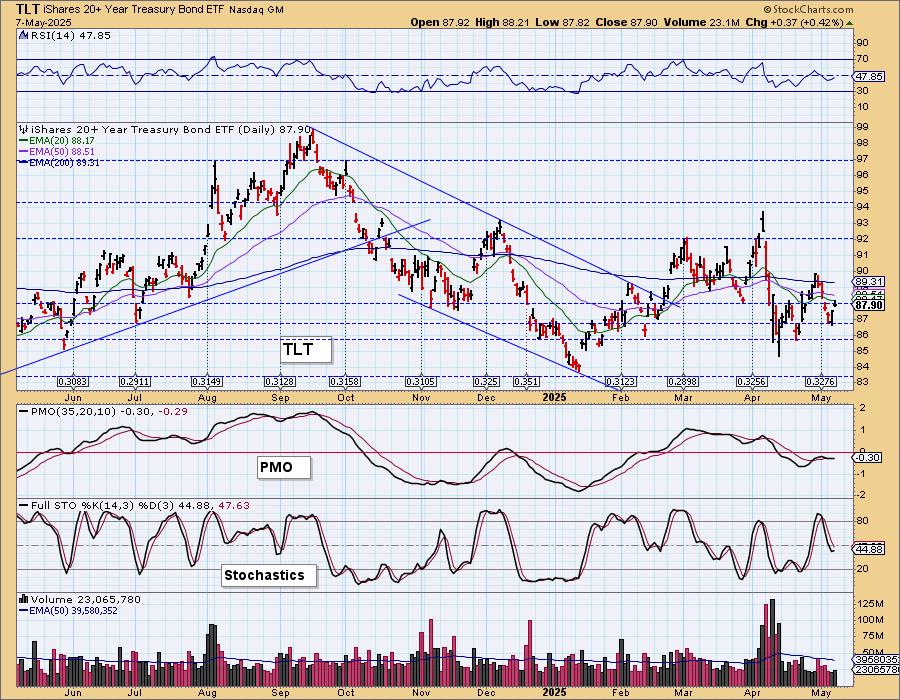
BONDS (TLT)
IT Trend Model: SELL as of 4/14/2025
LT Trend Model: SELL as of 12/13/2024
TLT Daily Chart: As noted earlier, Erin's scans turned up quite a few Bond funds as most saw PMOs turn back up above the signal line. We don't have that condition here, but the PMO does appear ready to rise again as it held the same reading today as yesterday. Stochastics have also tipped upward. It appears time for Bonds to get moving again.
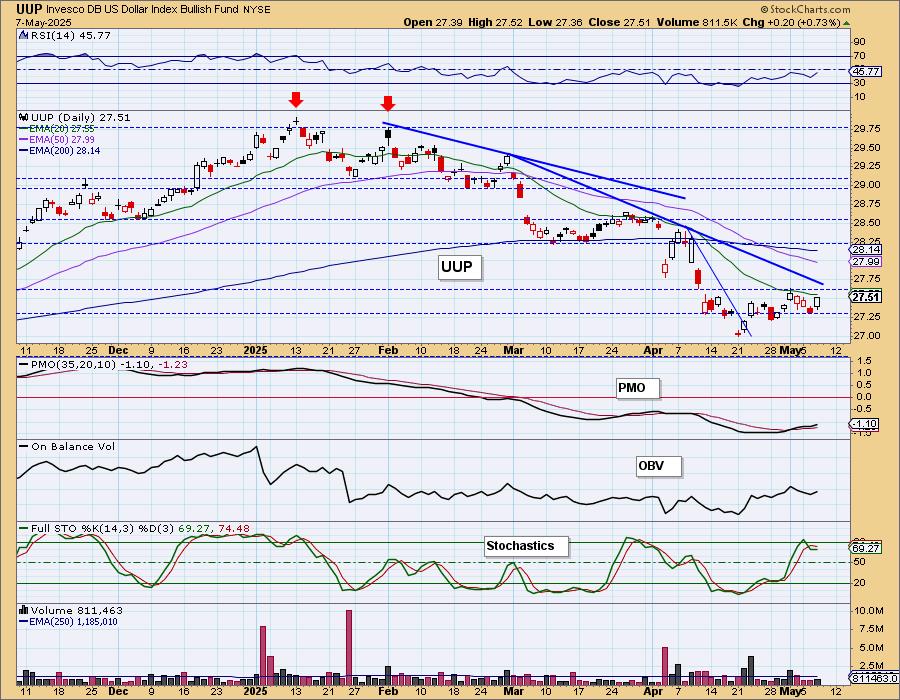
DOLLAR (UUP)
IT Trend Model: NEUTRAL as of 3/5/2025
LT Trend Model: SELL as of 4/25/2025
UUP Daily Chart: The Dollar surprised today with a nice rally to keep the rising trend intact. It doesn't look inspiring and we do see resistance nearing at the declining tops trendline. The PMO is on the rise even though it is below the zero line. Stochastics want to turn up in positive territory. We think we could see a little more rally, but we think it will get hung up at overhead resistance and the declining tops trendline. That doesn't leave it much more room to move higher.
GOLD
IT Trend Model: BUY as of 1/10/2025
LT Trend Model: BUY as of 10/20/2023
GLD Daily Chart: Gold pulled back in a big way today as it was down almost twice as much as the Dollar was up. This tells us there were quite a few sellers that brought price down. Now we have to watch out for a bearish double top. The breakout from the falling wedge looked good, but price has already gotten ahead of itself. We do see the Gold Volatility Index ($GVZ) is back above its moving average on the inverted scale and that could be bullish for Gold.
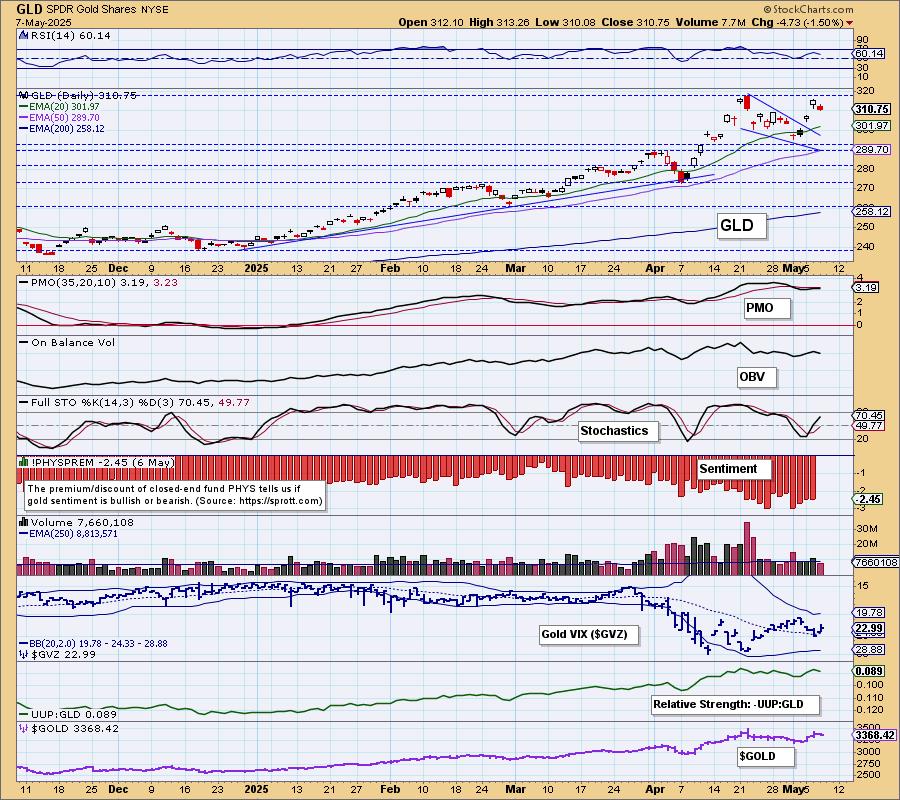
The PMO hasn't topped yet, so we wouldn't be entirely surprised if Gold popped again. We definitely like it in the intermediate term. Sentiment is still very bearish based on high discounts and that could work in its favor as well. For now, we need to see the Dollar lose ground otherwise we will get a bearish double top.
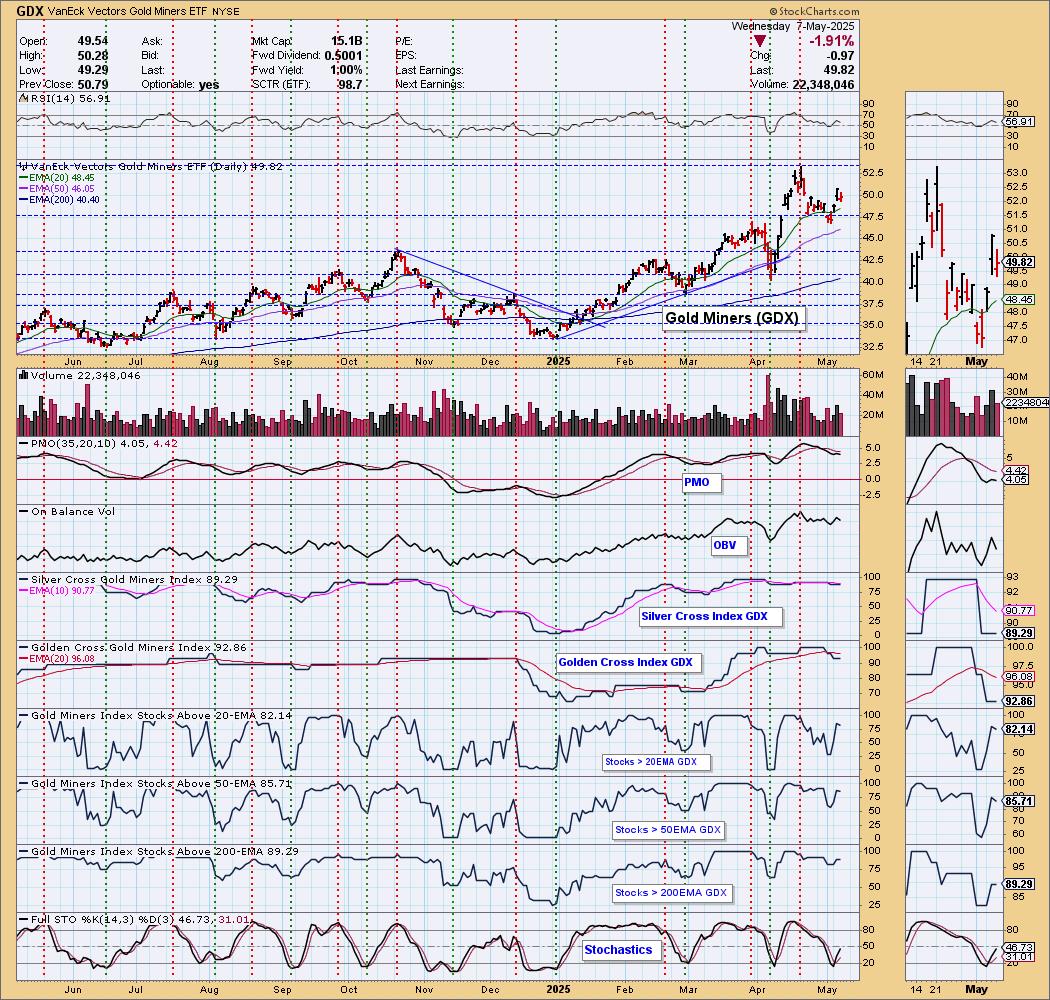
GOLD MINERS (GDX) Daily Chart: Gold Miners pulled back with Gold but not as far as we would have expected. They were lower, but not much lower than Gold. We do not like that the PMO has topped beneath its signal line as that is a sign of diminishing strength. Participation remains very healthy though. Our thought is that Gold will pull back a bit farther and that will bring GDX back down to support with a good chance of an upside reversal from there.
CRUDE OIL (USO)
IT Trend Model: NEUTRAL as of 2/27/2025
LT Trend Model: SELL as of 3/18/2025
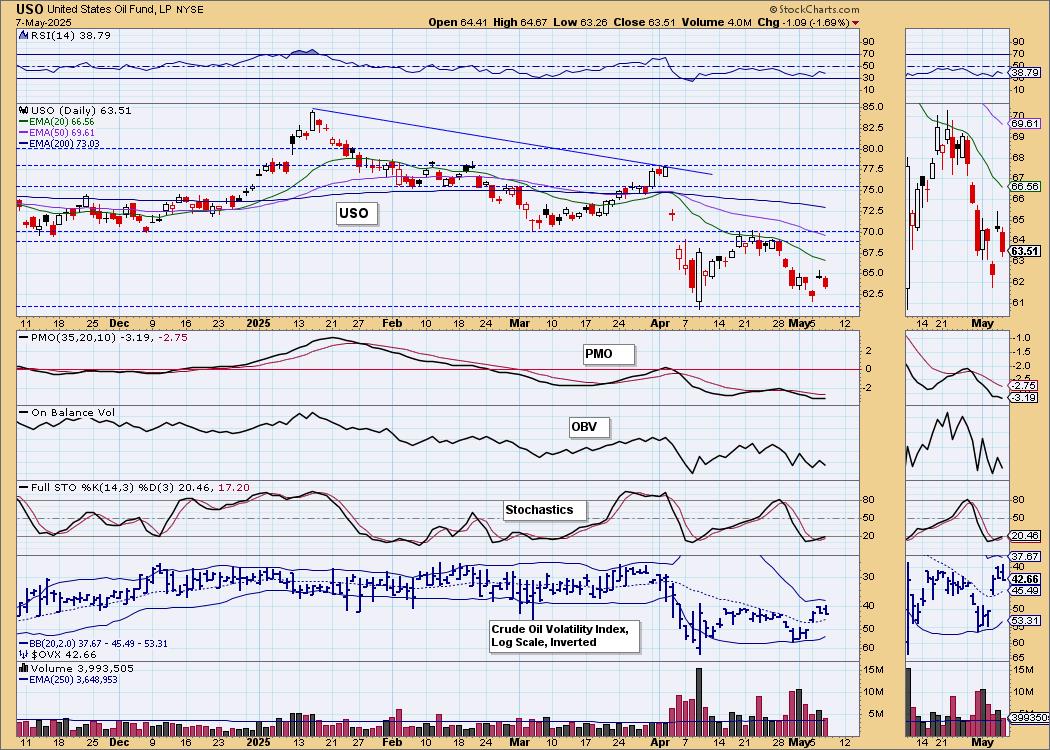
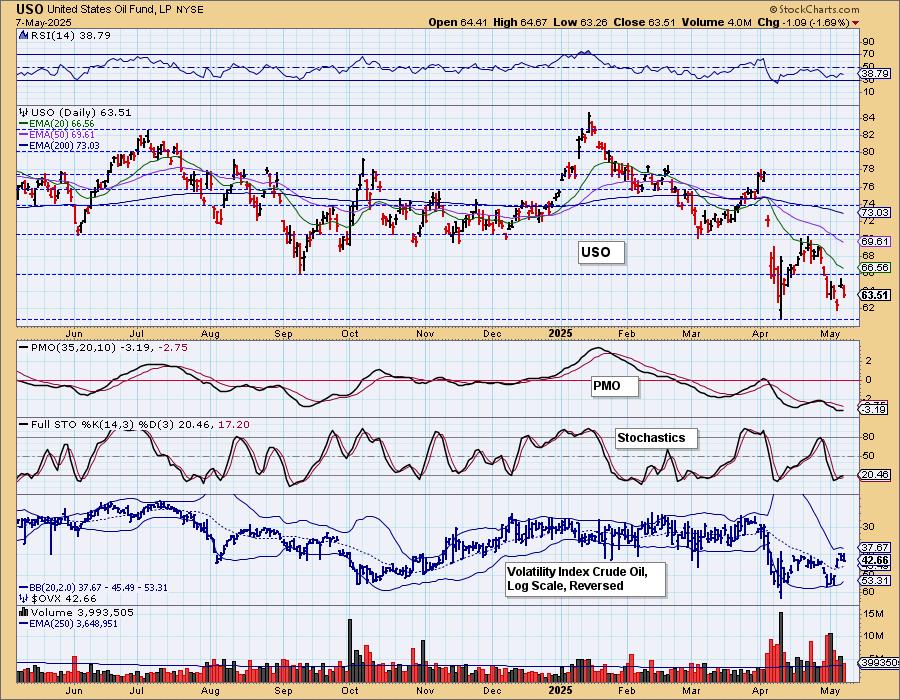
USO Daily Chart: A bullish double bottom may be forming on Crude Oil. We aren't bullish here, but it needed to be pointed out. The PMO has topped beneath the signal line well below the zero line and that means serious weakness. Stochastics are still making their way higher but are still very negative in location. We believe support is very vulnerable.
Good Luck & Good Trading!
Erin Swenlin and Carl Swenlin
Technical Analysis is a windsock, not a crystal ball. --Carl Swenlin
(c) Copyright 2025 DecisionPoint.com
Disclaimer: This blog is for educational purposes only and should not be construed as financial advice. The ideas and strategies should never be used without first assessing your own personal and financial situation, or without consulting a financial professional. Any opinions expressed herein are solely those of the author, and do not in any way represent the views or opinions of any other person or entity.
DecisionPoint is not a registered investment advisor. Investment and trading decisions are solely your responsibility. DecisionPoint newsletters, blogs or website materials should NOT be interpreted as a recommendation or solicitation to buy or sell any security or to take any specific action.
NOTE: The signal status reported herein is based upon mechanical trading model signals, specifically, the DecisionPoint Trend Model. They define the implied bias of the price index based upon moving average relationships, but they do not necessarily call for a specific action. They are information flags that should prompt chart review. Further, they do not call for continuous buying or selling during the life of the signal. For example, a BUY signal will probably (but not necessarily) return the best results if action is taken soon after the signal is generated. Additional opportunities for buying may be found as price zigzags higher, but the trader must look for optimum entry points. Conversely, exit points to preserve gains (or minimize losses) may be evident before the model mechanically closes the signal.
Helpful DecisionPoint Links:
DecisionPoint Alert Chart List
DecisionPoint Golden Cross/Silver Cross Index Chart List
DecisionPoint Sector Chart List
Price Momentum Oscillator (PMO)