
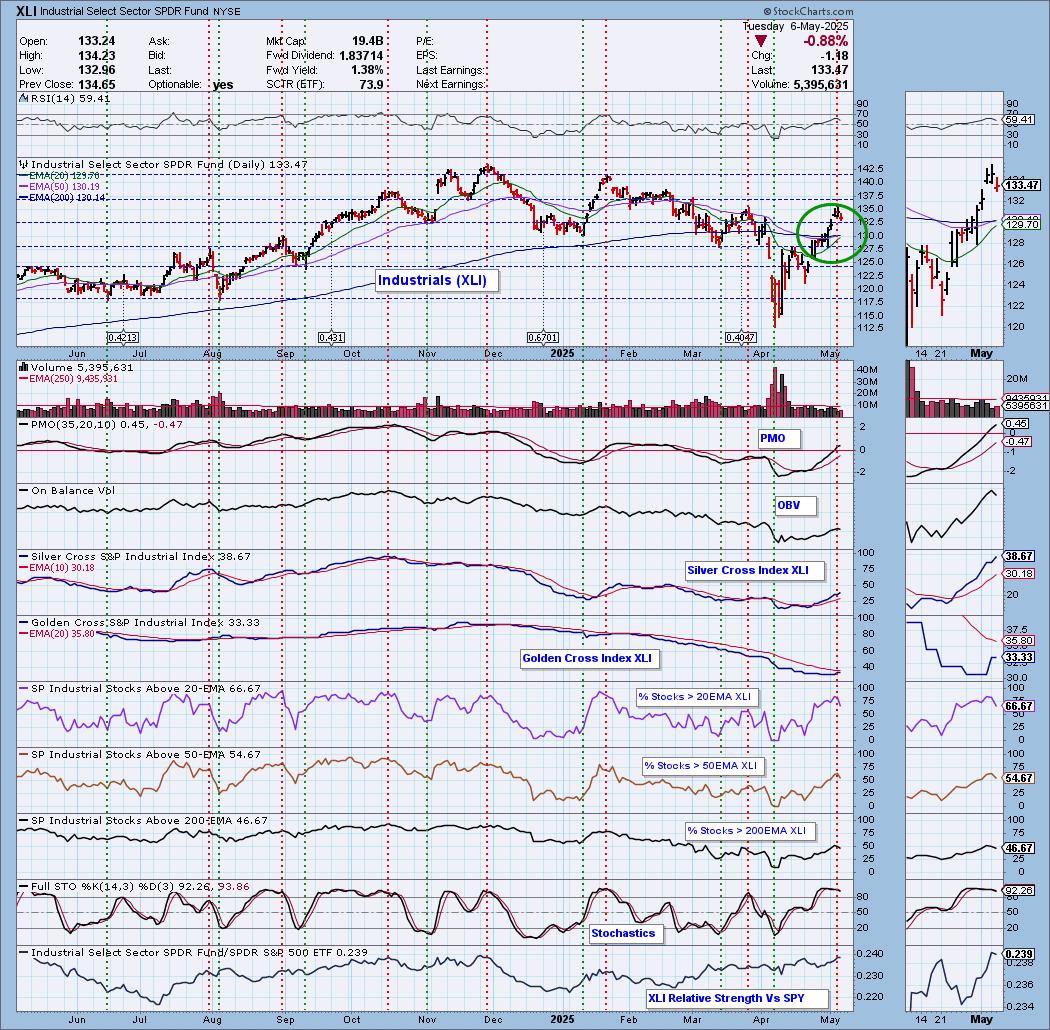
Today theIndustrial Sector ETF (XLI) 50-day EMA crossed up through the 200-day EMA (Golden Cross), generating an IT Trend Model BUY Signal. It wasn't long ago that we were writing about a Death Cross of the 50/200-day EMAs. The current rally did bring price well above the 200-day EMA. The PMO is now above the zero line, but notice that participation is already beginning to deteriorate. Stochastics are above 80, but are falling now. This area has been outperforming the SPY, but we wonder if it can hold up with a market decline.
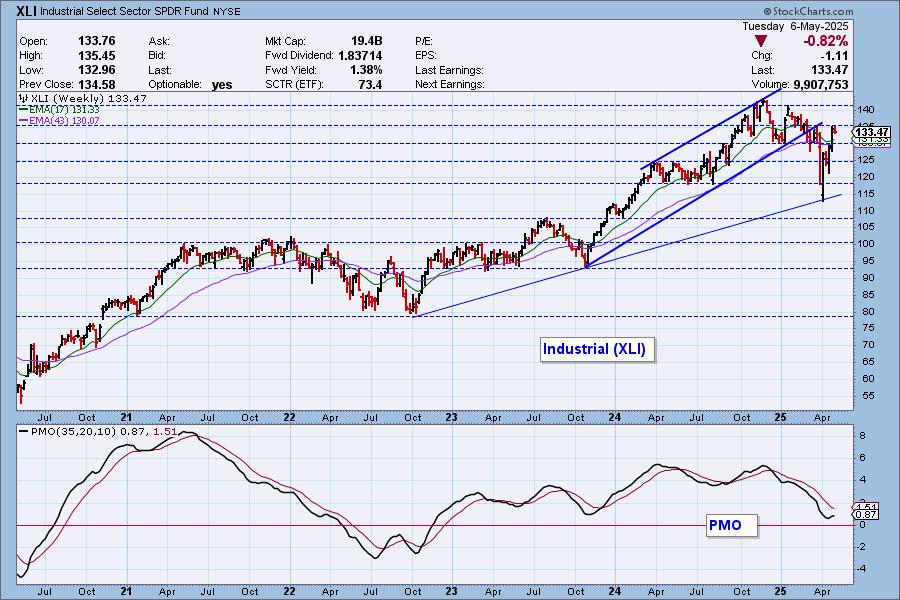
We did see a nice bounce off the rising bottoms trendline, but we do note that we are still in a declining trend out of the all-time high. The weekly PMO has turned up so we could get more upside in the intermediate term.
The DecisionPoint Alert Weekly Wrap presents an end-of-week assessment of the trend and condition of the Stock Market, the U.S. Dollar, Gold, Crude Oil, and Bonds. The DecisionPoint Alert daily report (Monday through Thursday) is abbreviated and gives updates on the Weekly Wrap assessments.
MARKET/INDUSTRY GROUP/SECTOR INDEXES
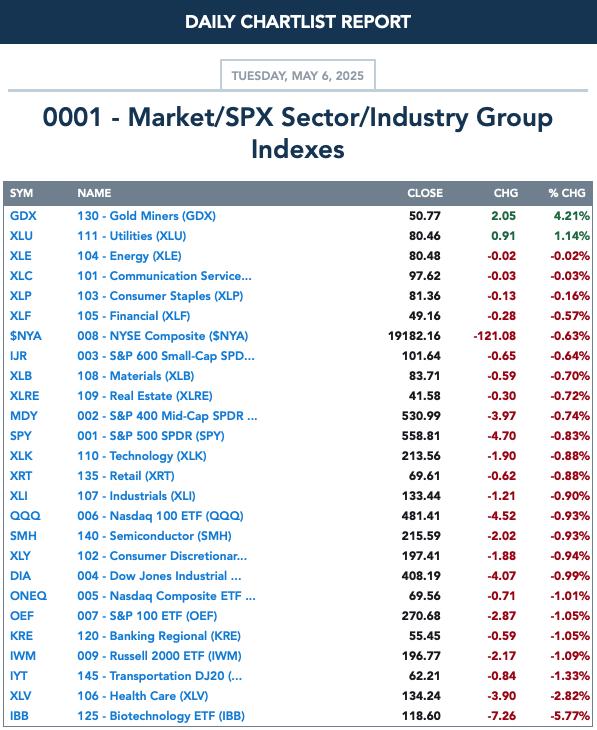
CLICK HERE for Carl's annotated Market Index, Sector, and Industry Group charts.
THE MARKET (S&P 500)
IT Trend Model: NEUTRAL as of 3/4/2025
LT Trend Model: SELL as of 4/16/2025
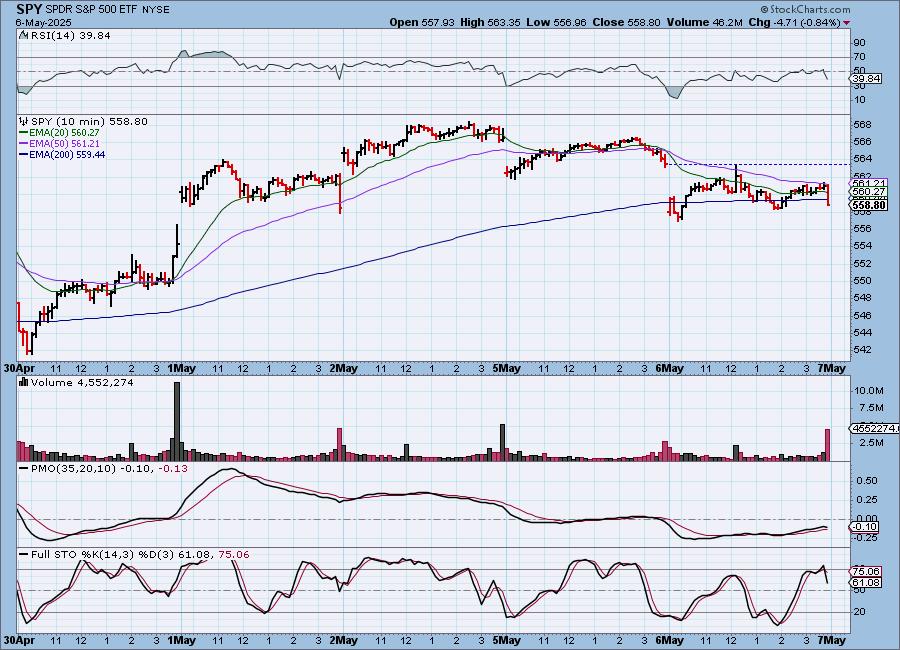
SPY 10-Minute Chart: Price gapped lower but didn't make up much ground from there. The closing bar was quite bearish, causing the 10-minute PMO to top. Stochastics also look very negative so more decline to open the day tomorrow is likely.
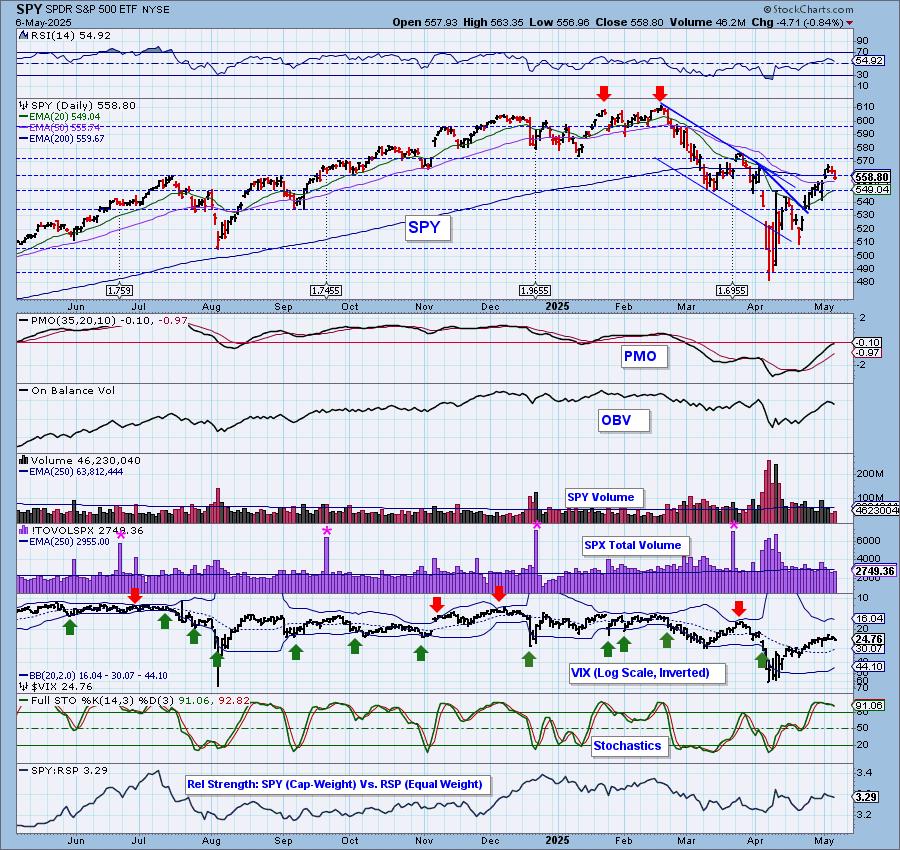
SPY Daily Chart: We have another bullish hollow red candlestick as price did close above the open today. Yesterday's bullish candlestick did help today so we shouldn't count on it tomorrow. The PMO is still rising strongly and could get over the zero line soon which would confirm the new strength we have been seeing.
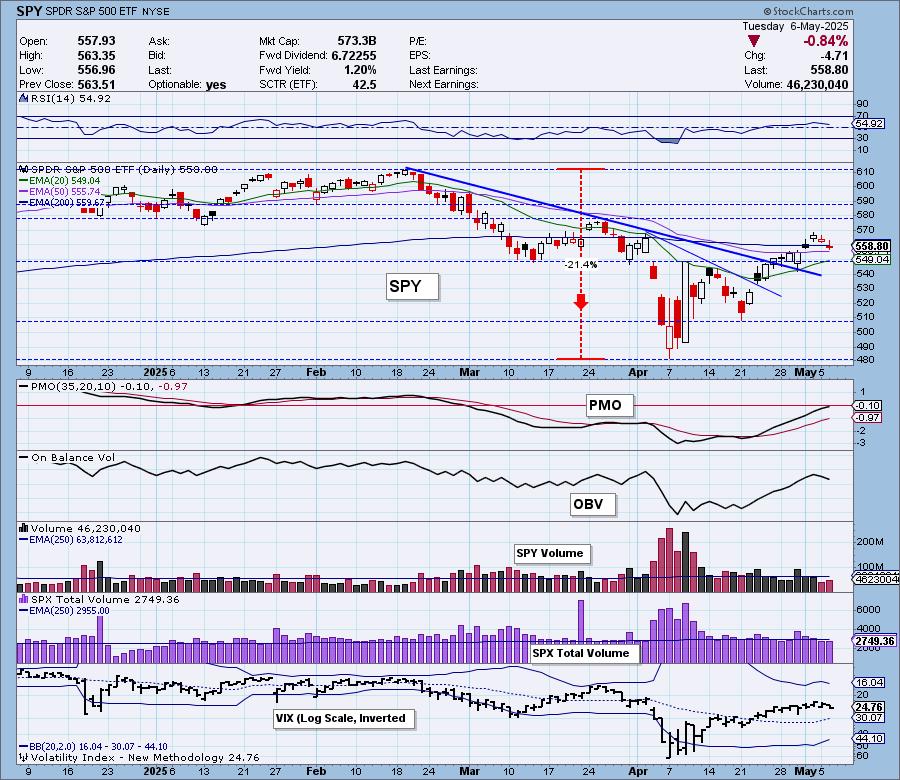
The VIX is topping on our inverted scale and Stochastics are drifting lower so we do see some weakness entering the market in the very short term.
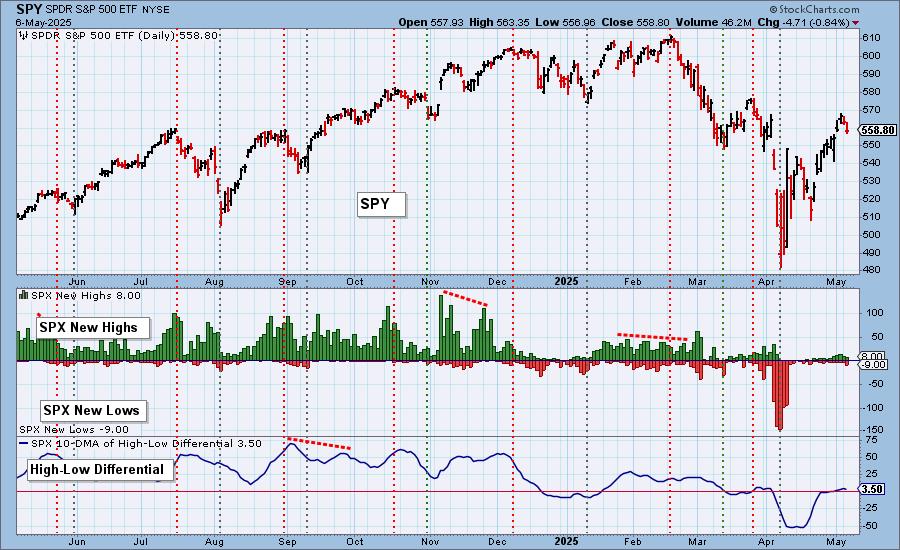
S&P 500 New 52-Week Highs/Lows: New Highs were lower on the decline. New Lows popped a bit suggesting new weakness entering the market in the very short term. It's hard to see, but the High-Low Differential topped today which is also bearish in the very short term.
Climax* Analysis: There was only one climax reading on the four relevant indicators, so today is not a climax day. Total Volume was very light.
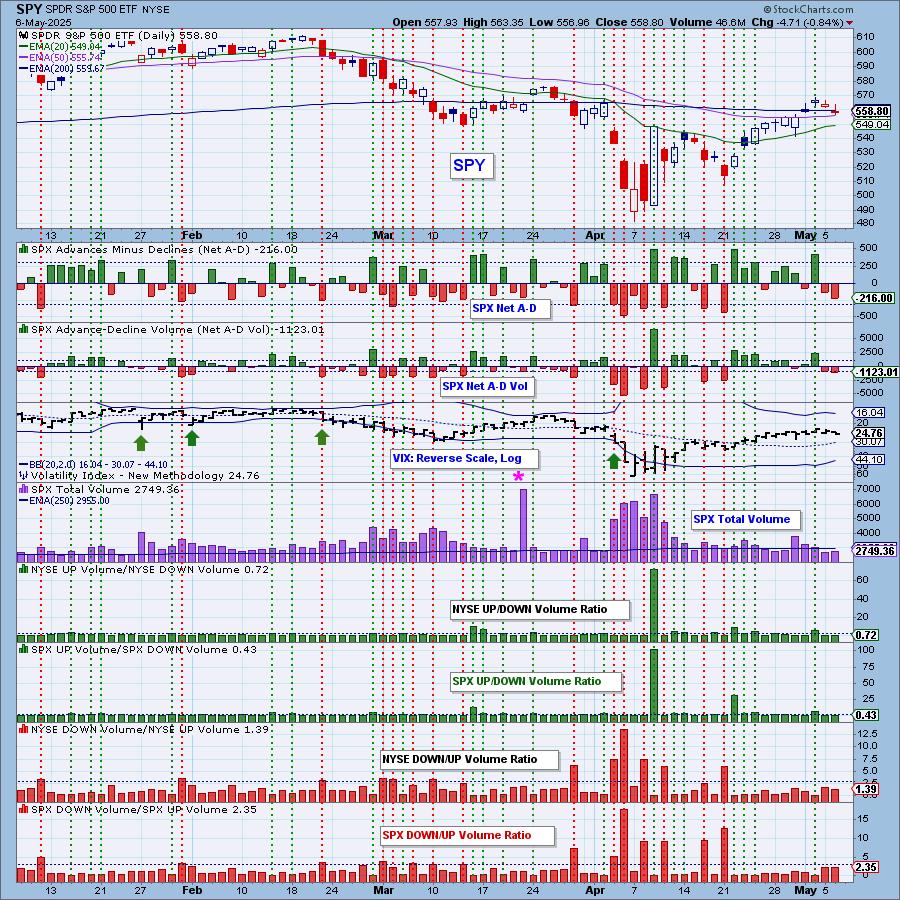
*A climax is a one-day event when market action generates very high readings in, primarily, breadth and volume indicators. We also include the VIX, watching for it to penetrate outside the Bollinger Band envelope. The vertical dotted lines mark climax days -- red for downside climaxes, and green for upside. Climaxes are at their core exhaustion events; however, at price pivots they may be initiating a change of trend.
Short-Term Market Indicators: The short-term market trend is UP and the condition is OVERBOUGHT.
Swenlin Trading Oscillators (STOs) topped in overbought territory and are still headed down which does imply short-term weakness. Participation didn't see terrible losses on the decline and remain at a healthy 66%. We've lost some rising PMOs, but a 74% reading for rising PMOs is very good.
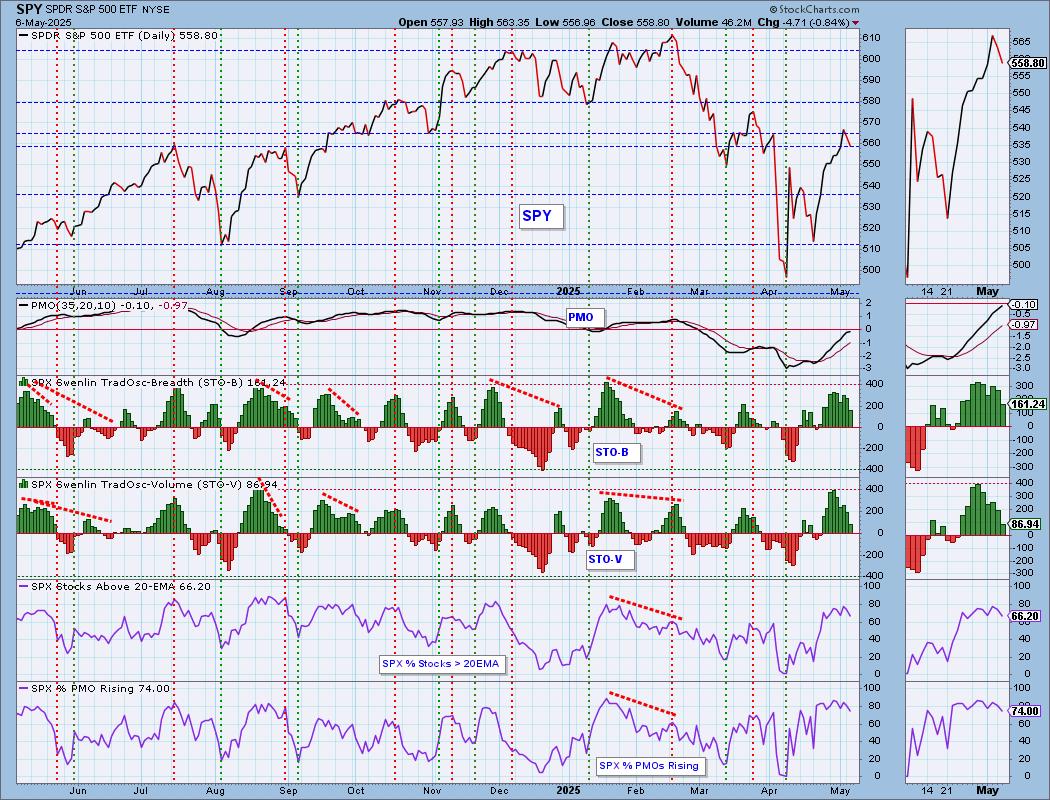
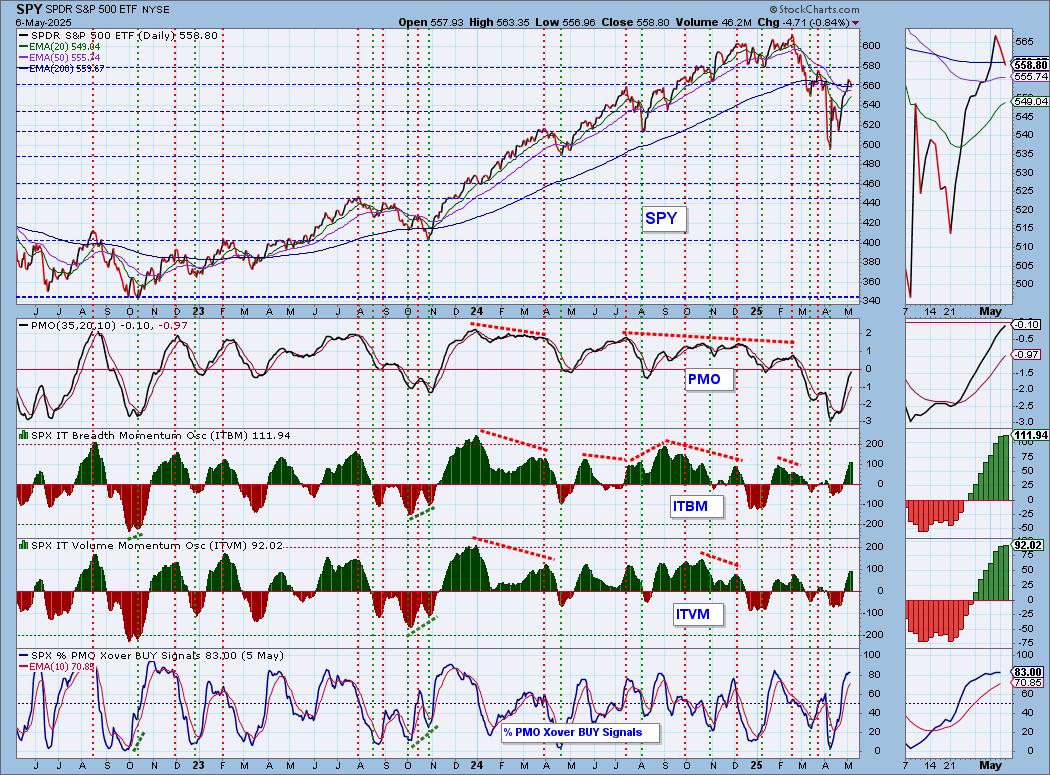
Intermediate-Term Market Indicators: The intermediate-term market trend is DOWN and the condition is SOMEWHAT OVERBOUGHT.
We did see a rise in both the ITBM and ITVM but it was a barely there move. These indicators are overbought and vulnerable to decline right now. We do see 83% have PMO Crossover BUY Signals and that could keep the market elevated in the intermediate term, but note, that indicator is in overbought territory and today held the same value as yesterday. It could be ready to top. It could certainly move higher, but typically this around the time we get a turnover.
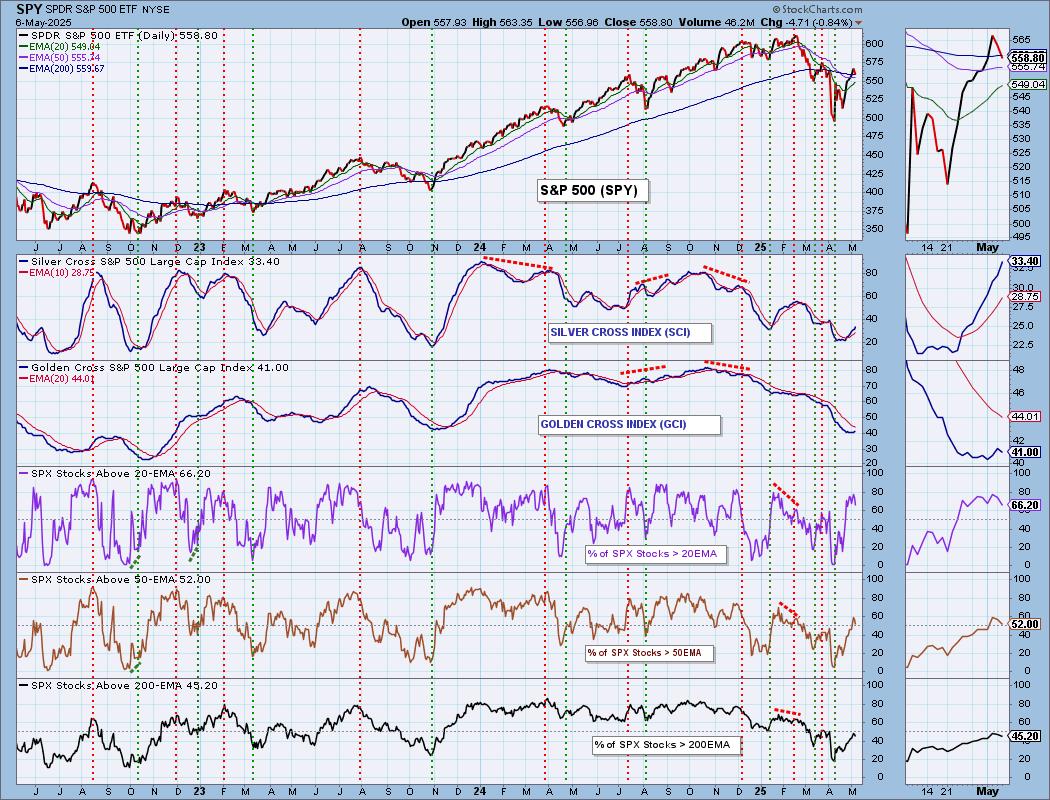
PARTICIPATION CHART (S&P 500): The following chart objectively shows the depth and trend of participation for the SPX in two time frames.
- Intermediate-Term - the Silver Cross Index (SCI) shows the percentage of SPX stocks on IT Trend Model BUY signals (20-EMA > 50-EMA). The opposite of the Silver Cross is a "Dark Cross" -- those stocks are, at the very least, in a correction.
- Long-Term - the Golden Cross Index (GCI) shows the percentage of SPX stocks on LT Trend Model BUY signals (50-EMA > 200-EMA). The opposite of a Golden Cross is the "Death Cross" -- those stocks are in a bear market.
The market bias is BULLISH in the intermediate term.
The market bias is BEARISH in the long term.
Participation contracted which is to be expected given the market's decline. %Stocks > 20/50/200EMAs are losing declining trends but are at reasonably bullish levels. We do need to see more expansion though. The Silver Cross Index looks very bullish as it rises out of oversold territory. It is above its signal line so the IT Bias is BULLISH. Today the Golden Cross Index topped but it shouldn't be moving much lower as there are more stocks above their 200-day EMAs versus those with Golden Crosses. It is below its signal line so the LT Bias is BEARISH.
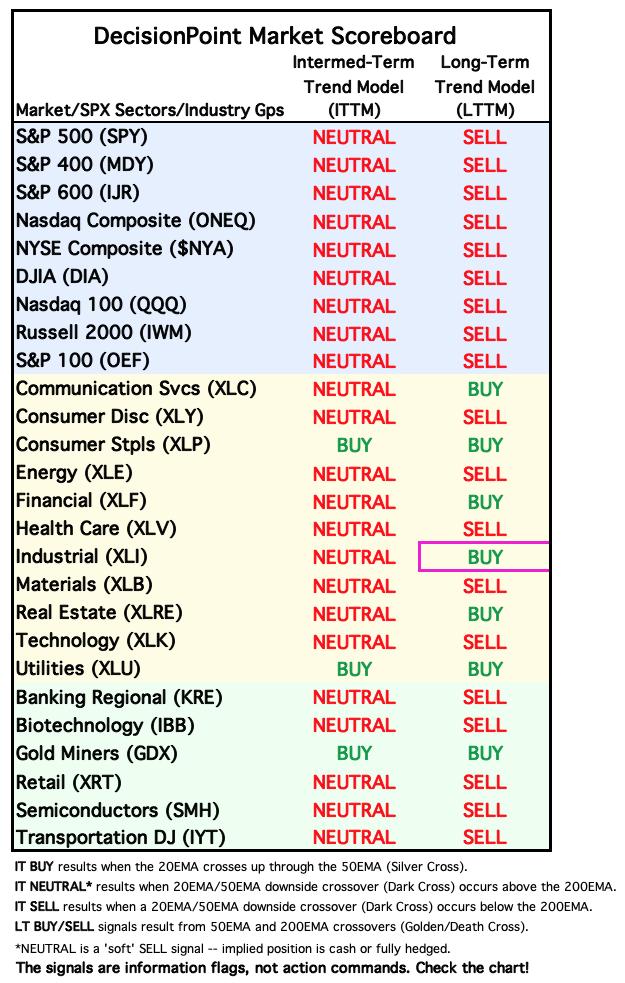
BIAS Assessment: The following table expresses the current BIAS of various price indexes based upon the relationship of the Silver Cross Index to its 10-day EMA (intermediate-term), and of the Golden Cross Index to its 20-day EMA (long-term). When the Index is above the EMA it is bullish, and it is bearish when the Index is below the EMA. The BIAS does not imply that any particular action should be taken. It is information to be used in the decision process.
The items with highlighted borders indicate that the BIAS changed today.

*****************************************************************************************************
CONCLUSION: Investors are still waiting on the Fed announcement tomorrow. We saw some sideline sitting with lower than normal Total Volume. We do see the short term in jeopardy of more decline primarily because the STOs are dropping. However, we could also point to topping Stochastics as well as participation sliding again. We believe we have a rocky road ahead this week, although Powell could get a rally going if he discusses rate cuts for this year. The technicals are still bullish in the intermediate term so the rally isn't necessarily over. More than likely we will have to absorb some more downside in the short term.
Erin is 10% long, 0% short. (This is intended as information, not a recommendation.)
*****************************************************************************************************
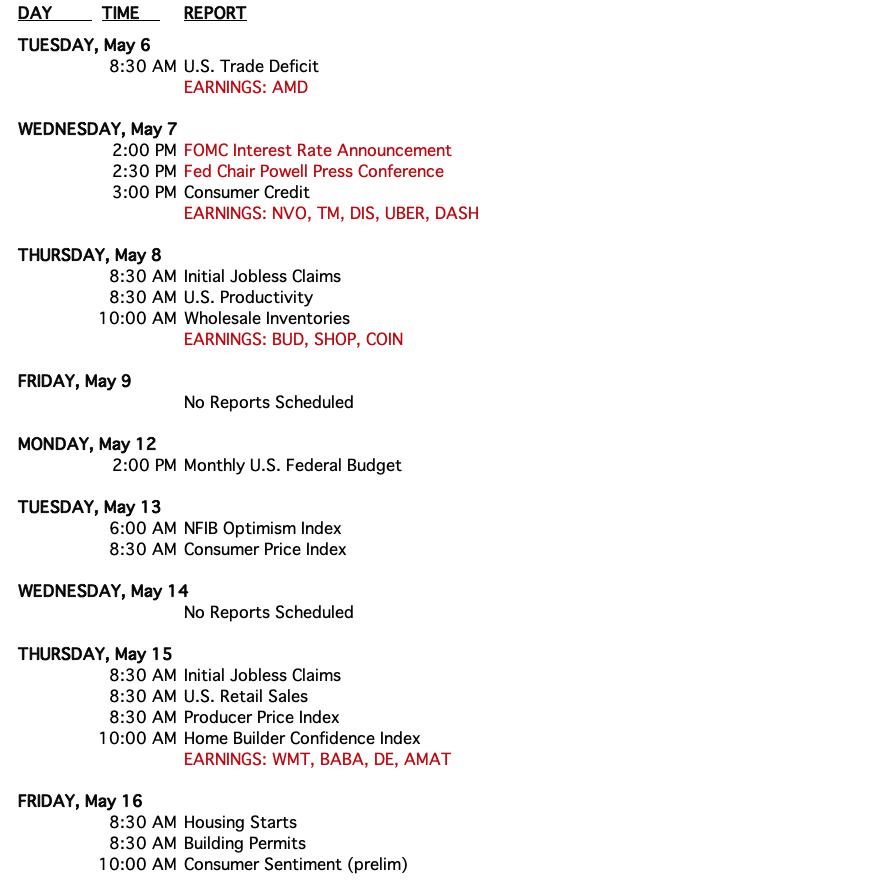
CALENDAR
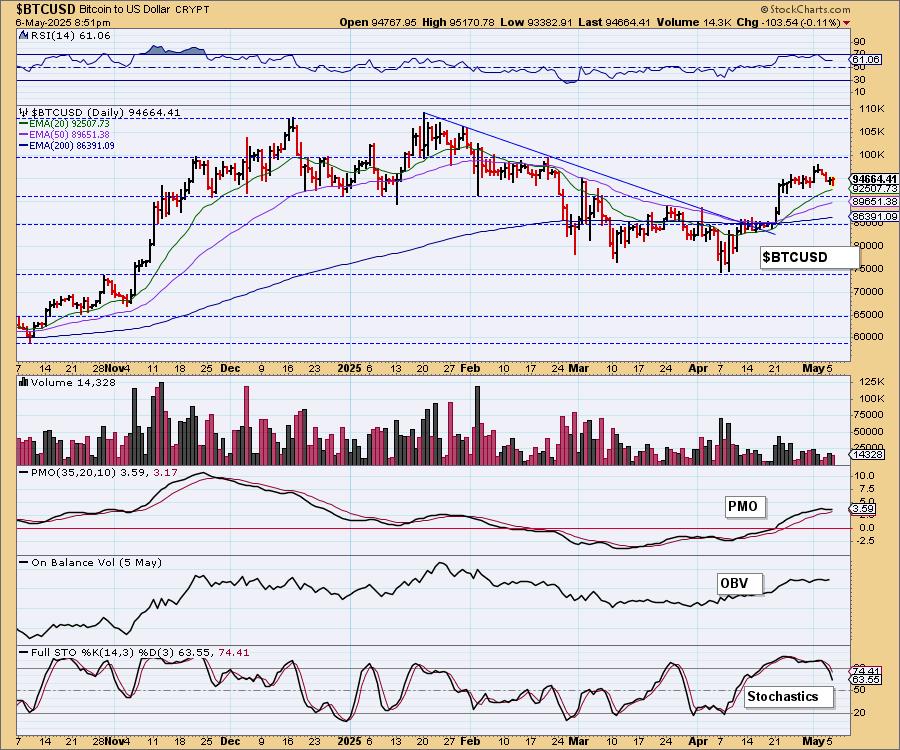
BITCOIN
Yesterday's comments still apply:
"Bitcoin's rally is floundering already. The PMO has topped. We were looking toward all-time highs, but it appears we are going to see a test of support beforehand. Stochastics dropped below 80 and are falling so we expect more bumpy trading."
BITCOIN ETFs

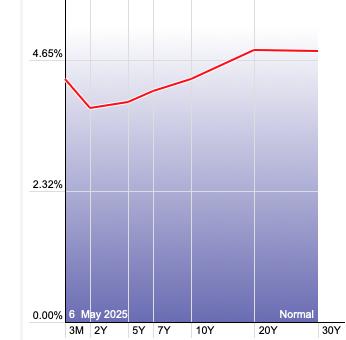
INTEREST RATES
Yields tipped over today but ultimately we are looking for them to continue making their way higher.

The Yield Curve Chart from StockCharts.com shows us the inversions taking place. The red line should move higher from left to right. Inversions are occurring where it moves downward.
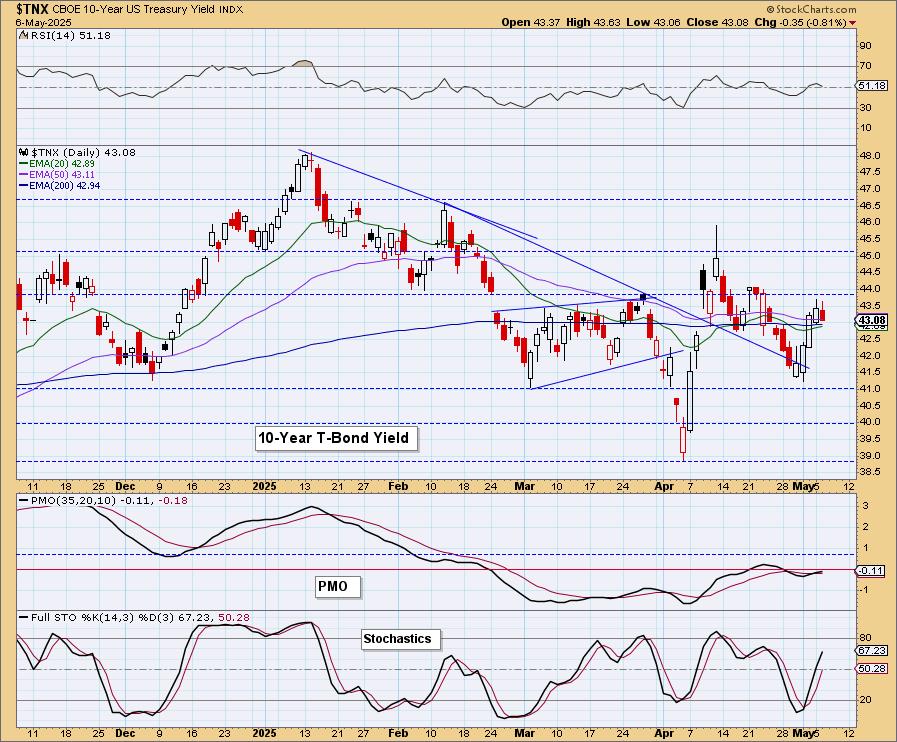
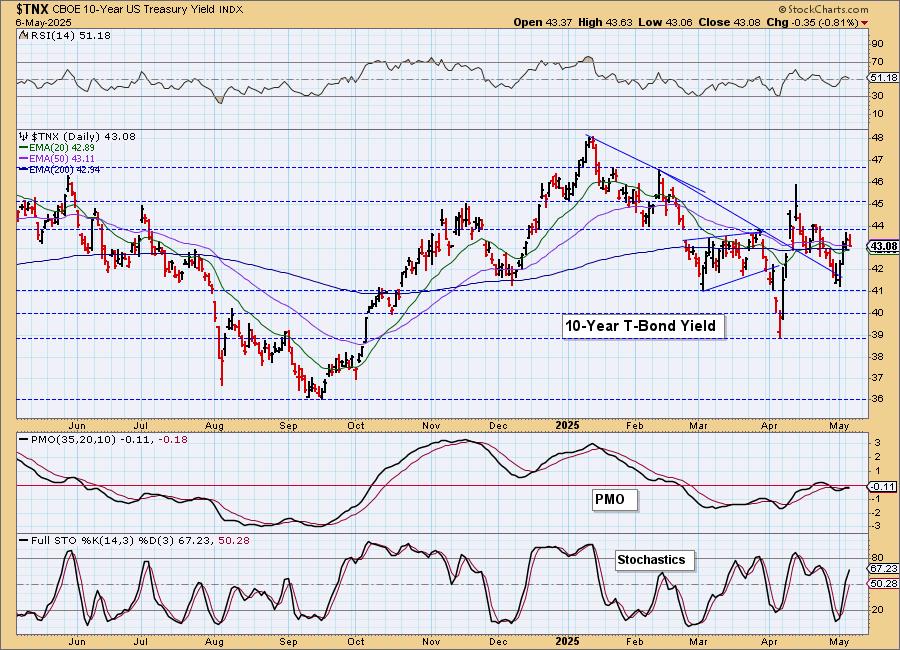
10-YEAR T-BOND YIELD
$TNX paused today, but the indicators still look very bullish so we would expect the 10-year yield will rise again soon. This looks like a bull flag formation that is playing out with a possible new flagpole developing. The PMO looks bullish on its Crossover BUY Signal. The RSI is staying in positive territory and Stochastics look very bullish.
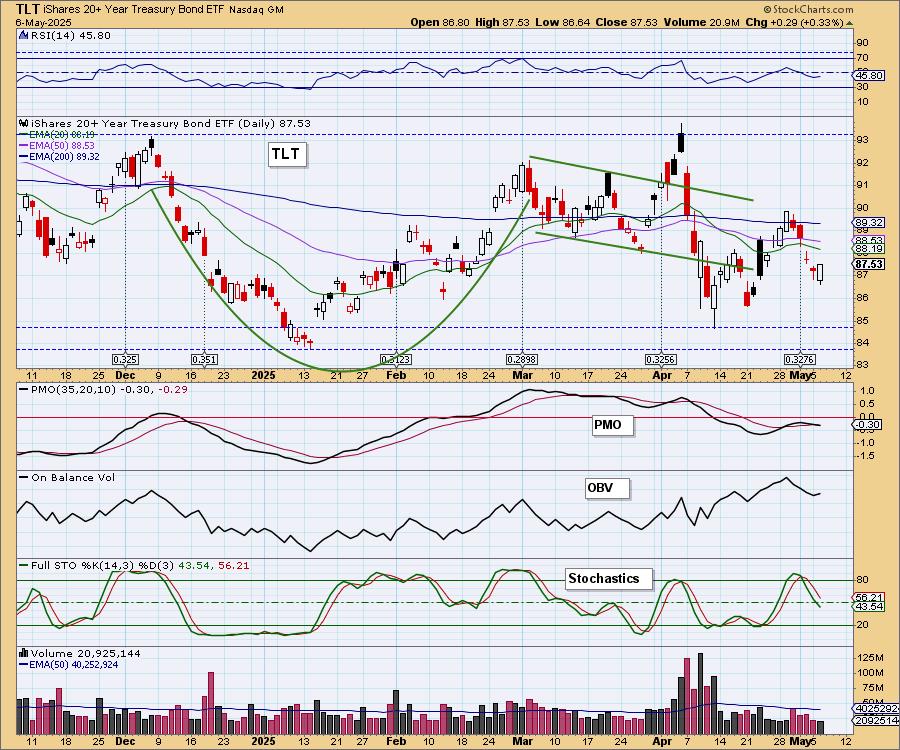
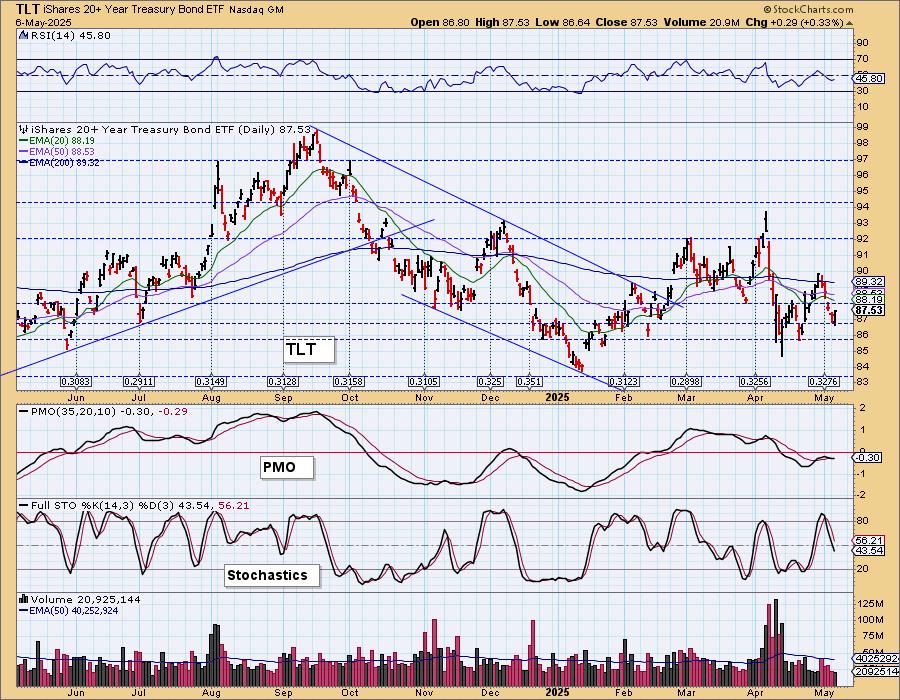
BONDS (TLT)
IT Trend Model: SELL as of 4/14/2025
LT Trend Model: SELL as of 12/13/2024
TLT Daily Chart: With yields dropping today, Bond funds rallied. We do see a bullish engulfing candlestick that could portend more upside, but ultimately we expect the decline to continue given the new PMO Crossover SELL Signal below the zero line. Stochastics dropped into negative territory also.
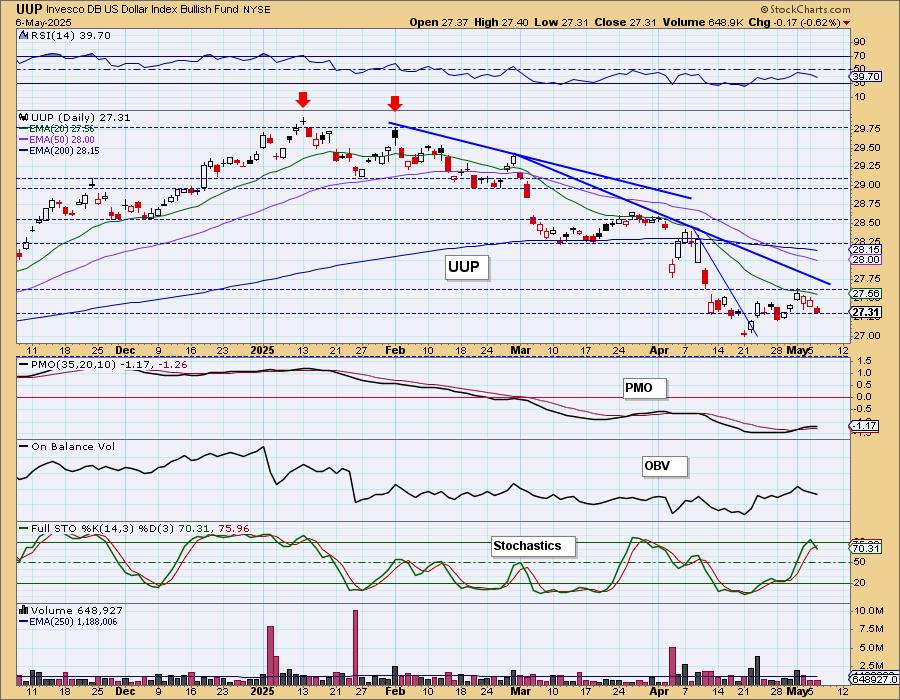
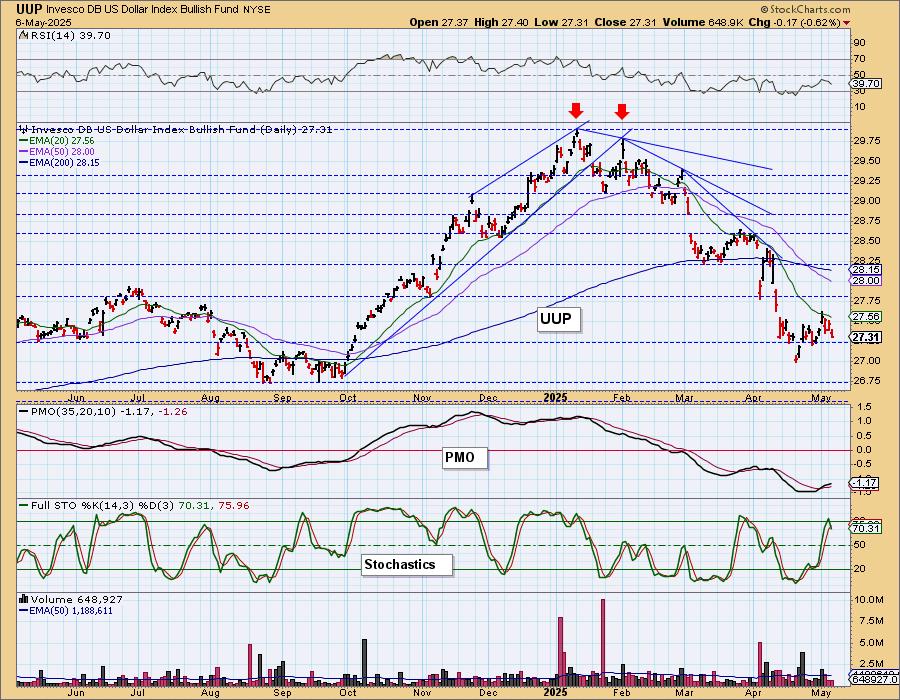
DOLLAR (UUP)
IT Trend Model: NEUTRAL as of 3/5/2025
LT Trend Model: SELL as of 4/25/2025
UUP Daily Chart: The Dollar is about to lose its rising trend already. Price topped before reaching the declining tops trendline and that is quite bearish. The PMO is already topping and the RSI is negative. We also see that Stochastics are now falling vertically. We expect more downside from the Dollar.
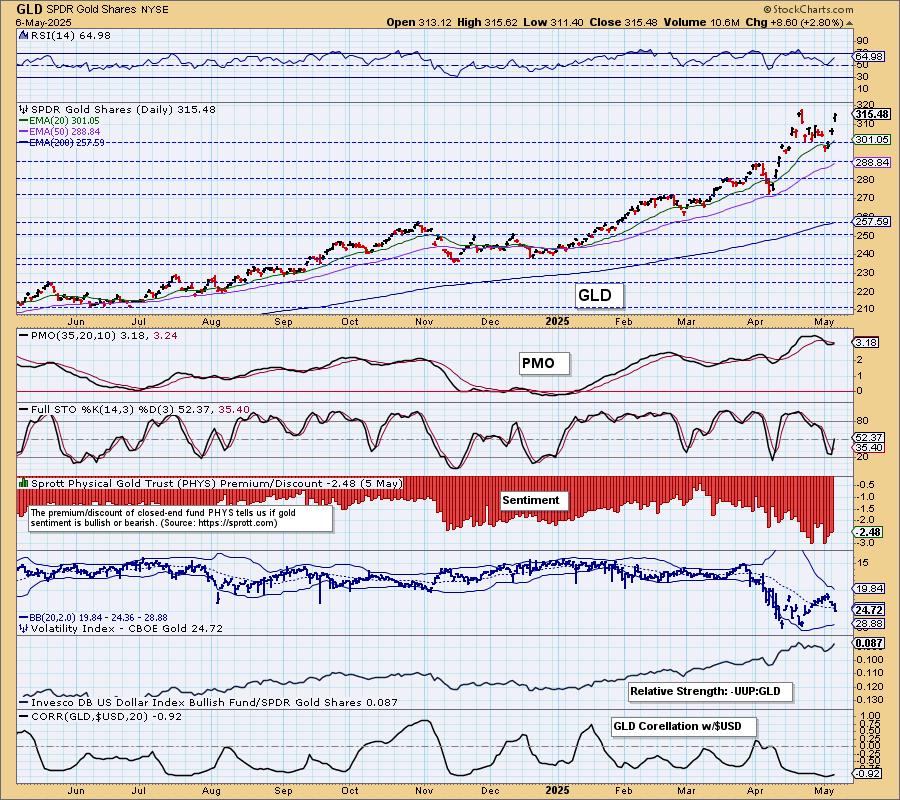
GOLD
IT Trend Model: BUY as of 1/10/2025
LT Trend Model: BUY as of 10/20/2023
GLD Daily Chart: Gold is at it again and given the weak look of the Dollar, this rally could see a move to all-time highs. The decline helped bring the RSI out of overbought territory. This rally has gotten the PMO to turn up well above the zero line. Look for more upside on Gold.
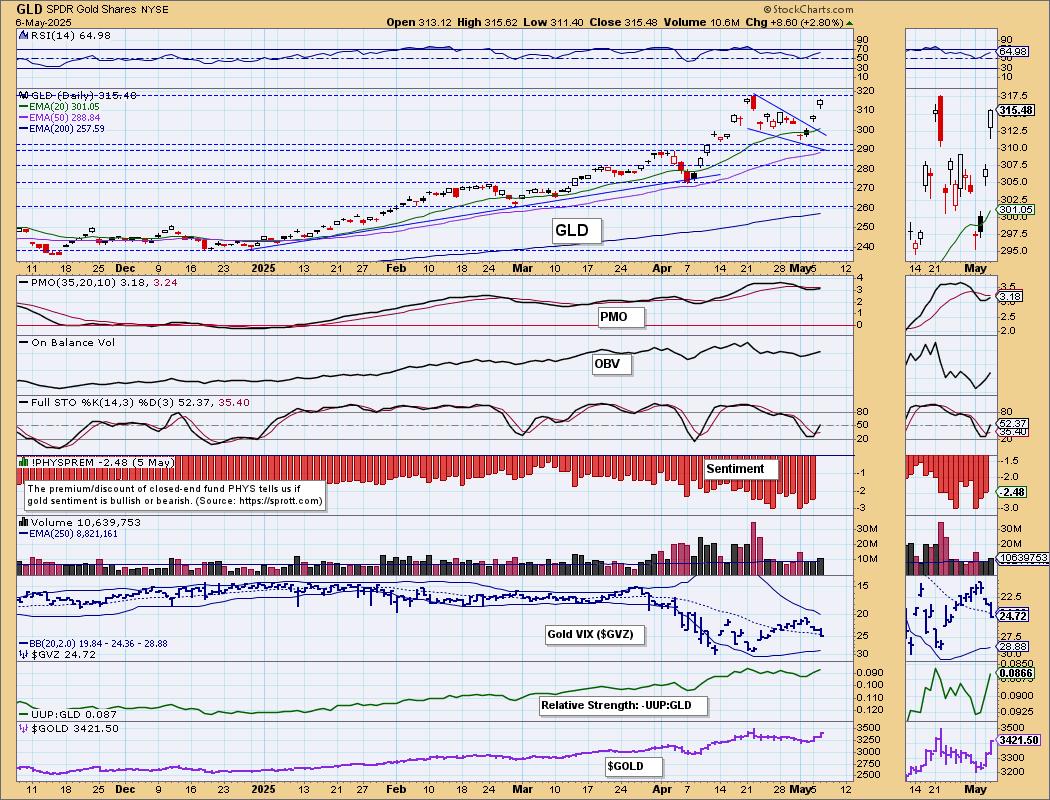
Relative strength is rising again against the Dollar. The inverse correlation is strong right now. With the Dollar showing weakness, this will definitely work in Gold's favor.
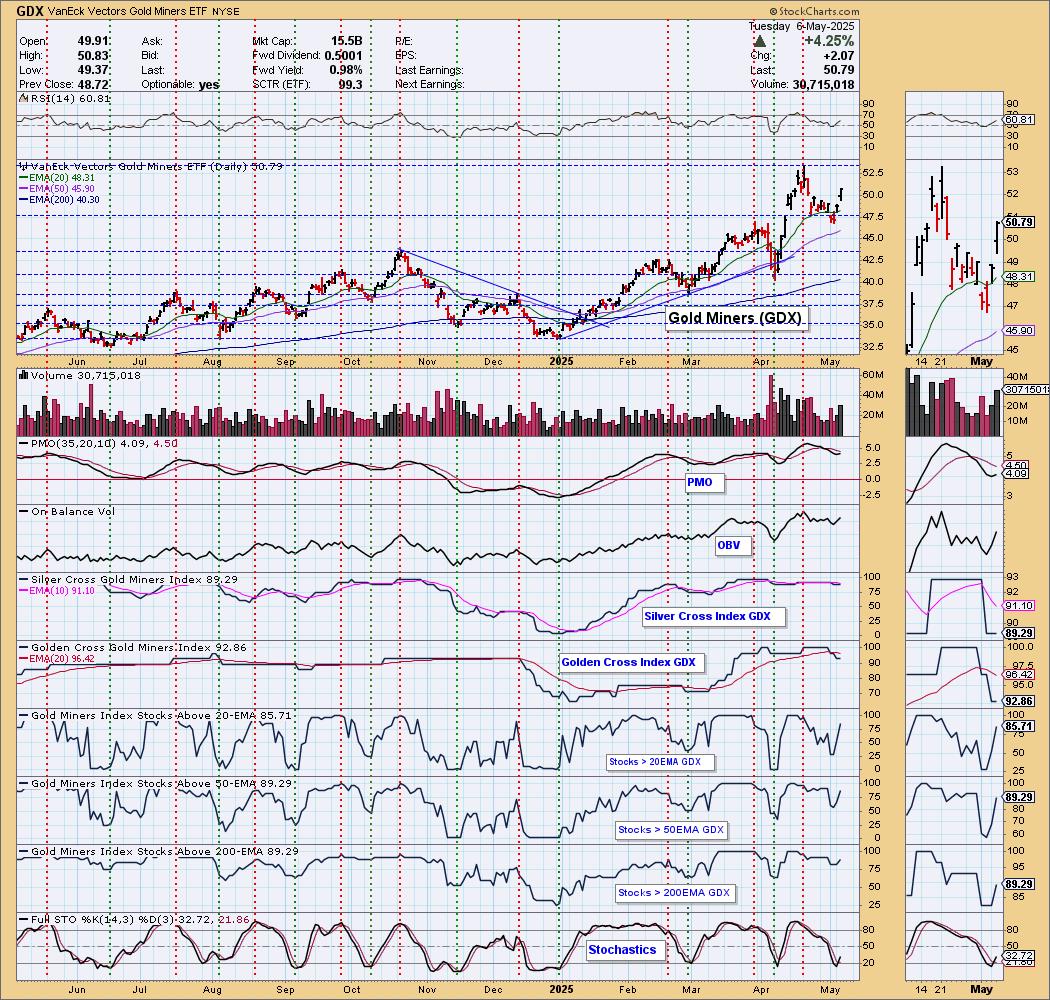
GOLD MINERS (GDX) Daily Chart: Gold Miners are off to the races once again having rebounded off support. The PMO has turned back up well above the zero line and participation has already healed itself. Stochastics just turned up and Gold looks very bullish right now so we do expect a breakout move ahead.
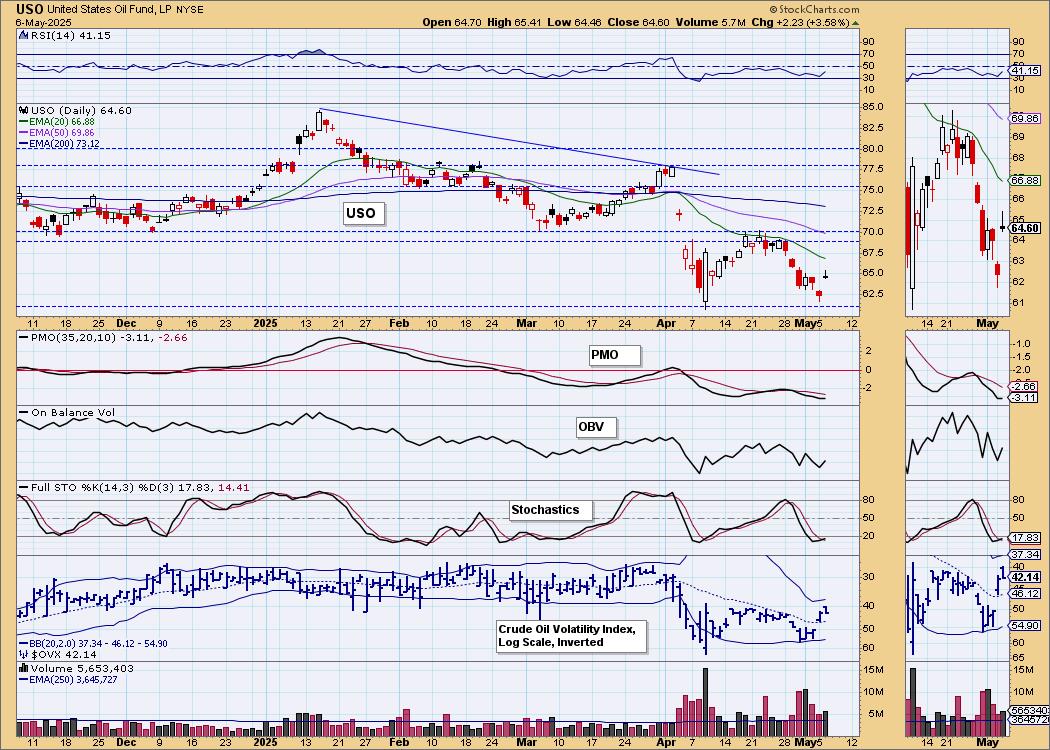
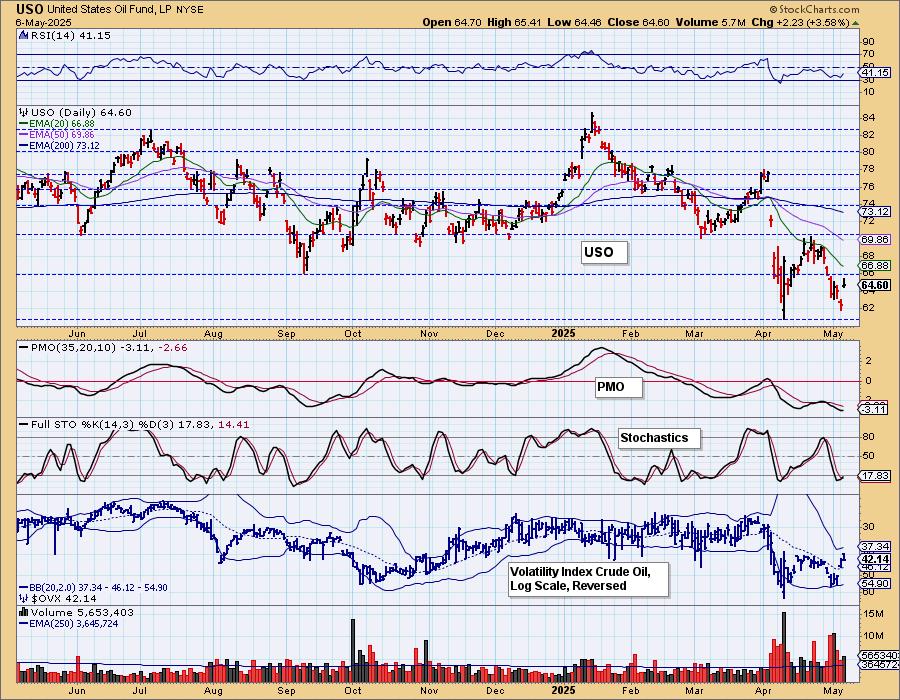
CRUDE OIL (USO)
IT Trend Model: NEUTRAL as of 2/27/2025
LT Trend Model: SELL as of 3/18/2025
USO Daily Chart: Despite higher production, Crude Oil did rally strongly today. This comes off strong support. The PMO is already turning back up along with Stochastics. The technicals tell us to expect more rally, but fundamentals regarding production tell us to expect a decline. We will go with the technicals at this point and look for a bit more upside.
Good Luck & Good Trading!
Erin Swenlin and Carl Swenlin
Technical Analysis is a windsock, not a crystal ball. --Carl Swenlin
(c) Copyright 2025 DecisionPoint.com
Disclaimer: This blog is for educational purposes only and should not be construed as financial advice. The ideas and strategies should never be used without first assessing your own personal and financial situation, or without consulting a financial professional. Any opinions expressed herein are solely those of the author, and do not in any way represent the views or opinions of any other person or entity.
DecisionPoint is not a registered investment advisor. Investment and trading decisions are solely your responsibility. DecisionPoint newsletters, blogs or website materials should NOT be interpreted as a recommendation or solicitation to buy or sell any security or to take any specific action.
NOTE: The signal status reported herein is based upon mechanical trading model signals, specifically, the DecisionPoint Trend Model. They define the implied bias of the price index based upon moving average relationships, but they do not necessarily call for a specific action. They are information flags that should prompt chart review. Further, they do not call for continuous buying or selling during the life of the signal. For example, a BUY signal will probably (but not necessarily) return the best results if action is taken soon after the signal is generated. Additional opportunities for buying may be found as price zigzags higher, but the trader must look for optimum entry points. Conversely, exit points to preserve gains (or minimize losses) may be evident before the model mechanically closes the signal.
Helpful DecisionPoint Links:
DecisionPoint Alert Chart List
DecisionPoint Golden Cross/Silver Cross Index Chart List
DecisionPoint Sector Chart List
Price Momentum Oscillator (PMO)