
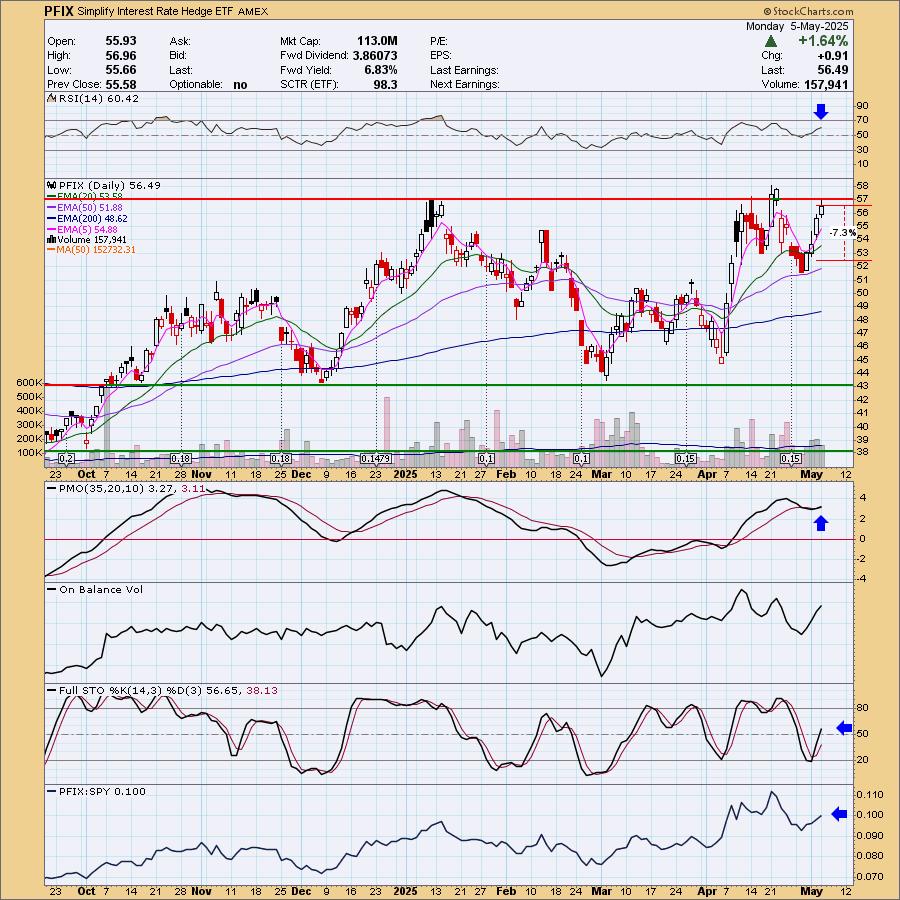
Interest rates are back on the rise and that has made the Interest Rate Hedge ETF (PFIX) very interesting. This ETF typically travels in line with the 10-year Treasury Yield, but not exclusively. That's why the chart isn't quite the same as $TNX's. Right now the RSI is positive and not overbought. The PMO has reversed above the zero line into a Crossover BUY Signal which is a sign of strength. Stochastics are rising almost vertically and we can see that the ETF is currently outperforming the SPY. Price hasn't overcome resistance just yet, but given the configuration of the indicators, it should see a breakout soon.
The DecisionPoint Alert Weekly Wrap presents an end-of-week assessment of the trend and condition of the Stock Market, the U.S. Dollar, Gold, Crude Oil, and Bonds. The DecisionPoint Alert daily report (Monday through Thursday) is abbreviated and gives updates on the Weekly Wrap assessments.
MARKET/INDUSTRY GROUP/SECTOR INDEXES
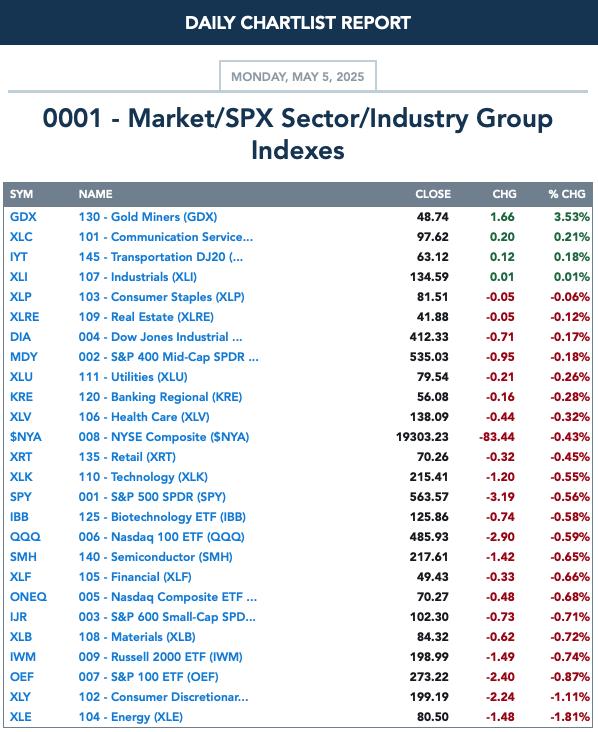
CLICK HERE for Carl's annotated Market Index, Sector, and Industry Group charts.
THE MARKET (S&P 500)
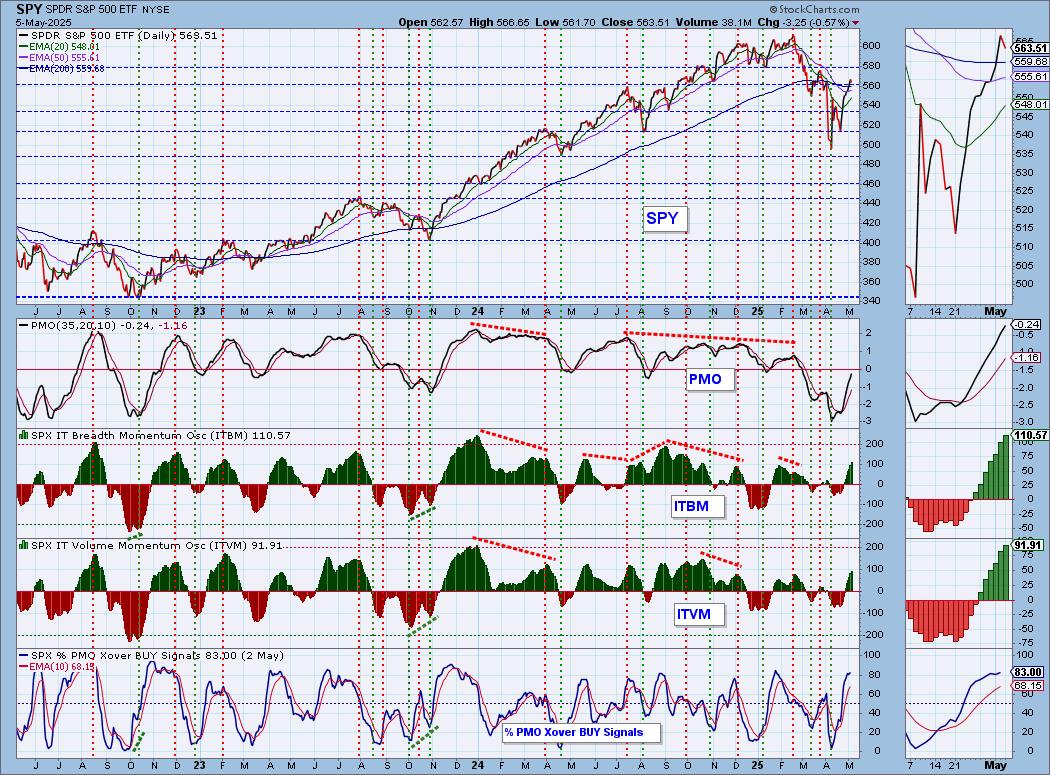
IT Trend Model: NEUTRAL as of 3/4/2025
LT Trend Model: SELL as of 4/16/2025
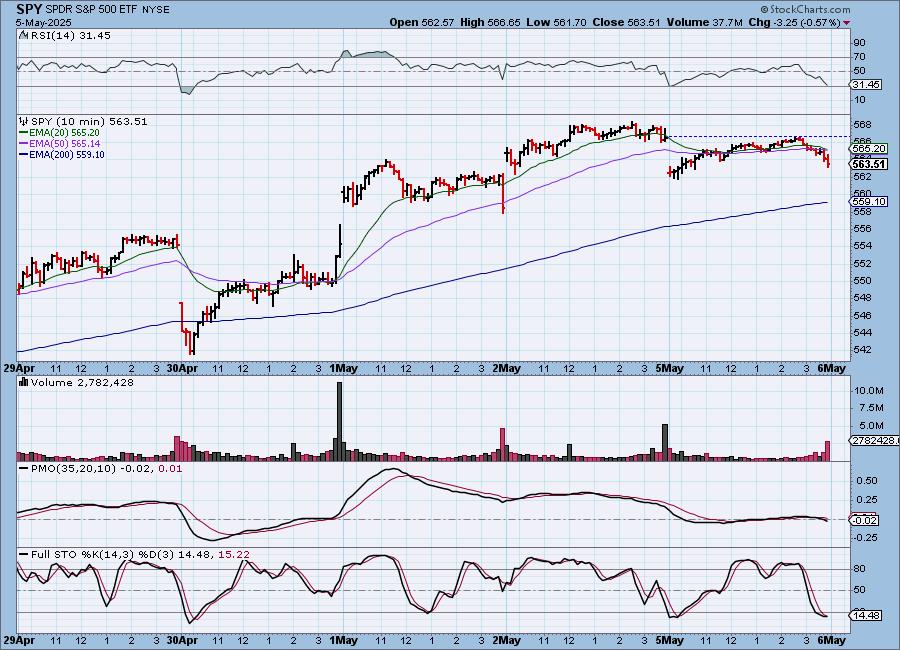
SPY 10-Minute Chart: The market gapped down on the open and pared losses most of the day before sinking at the end of the day. The 10-minute PMO is headed lower beneath the zero line which does imply we could see the market struggle tomorrow.
SPY Daily Chart: The rally needed to cool off and today's pause helped that condition. It formed a hollow red candlestick which is a bullish one-day pattern. The RSI is positive and not overbought. The PMO looks very bullish as it rises toward the zero line.
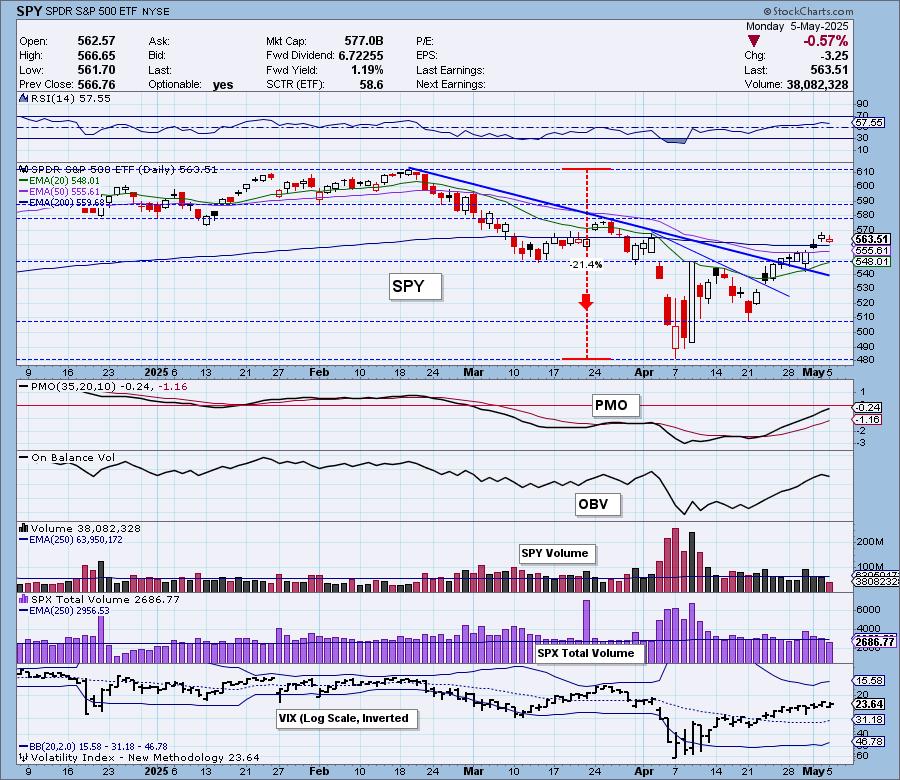
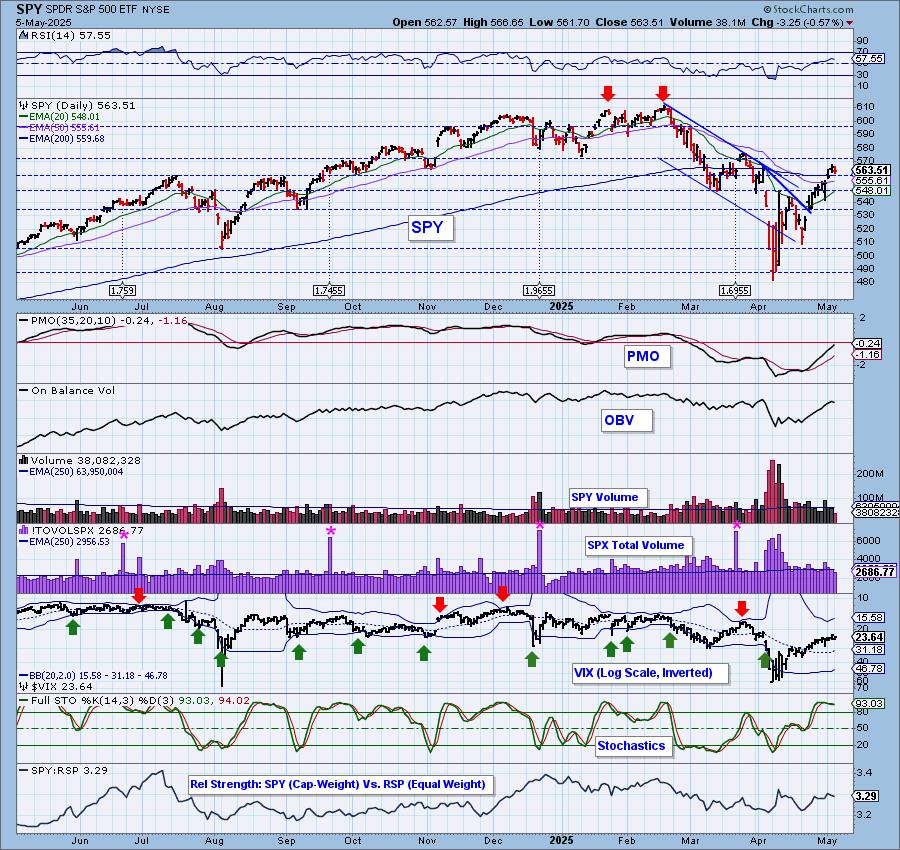
Internal strength is clearly visible. The VIX is holding above its moving average on the inverted scale and Stochastics are sitting well above 80.
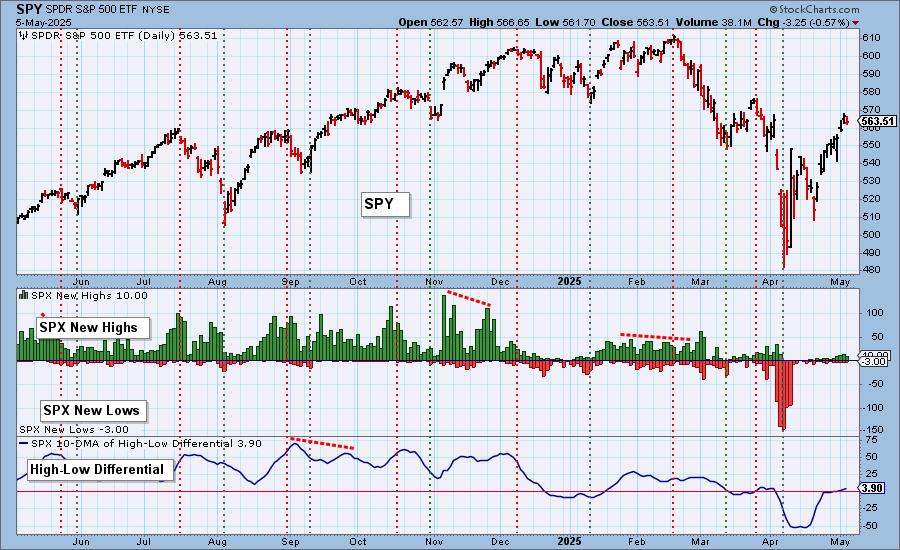
S&P 500 New 52-Week Highs/Lows: New Highs pared back as we would expect on a decline. New Lows held steady. The High-Low Differential is slowly rising and has now made it back above the zero line.
Climax* Analysis: There was only one climax reading on the four relevant indicators, so today is not a climax day. Total Volume was very light.
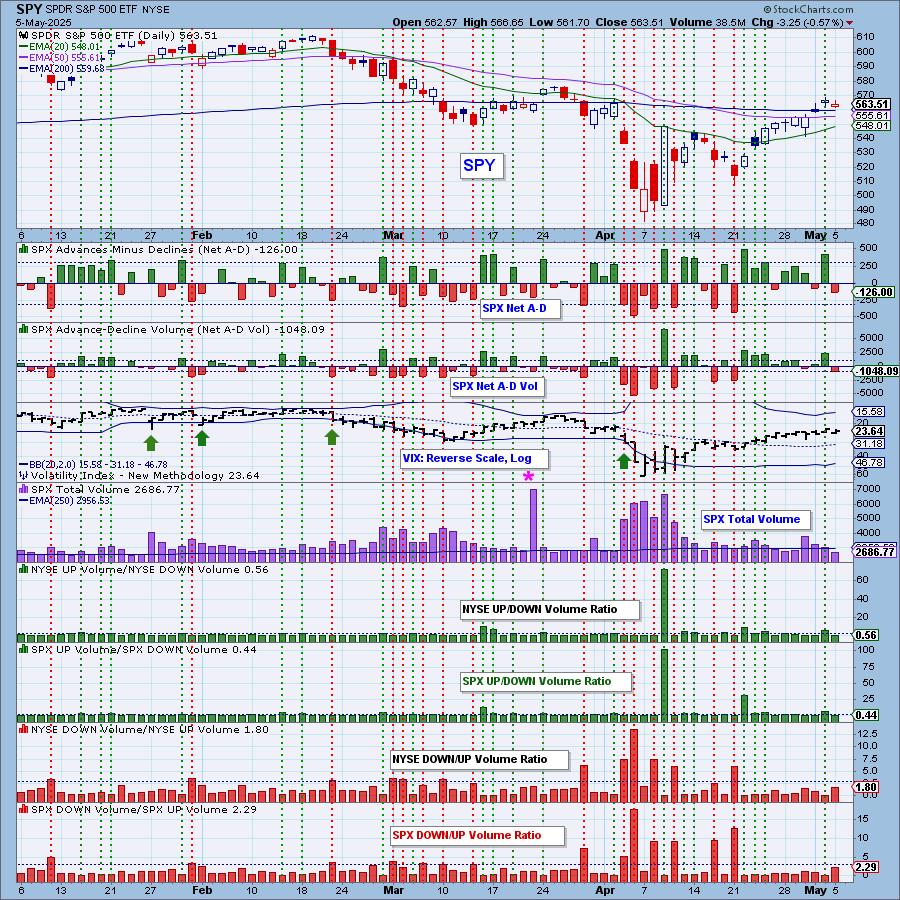
*A climax is a one-day event when market action generates very high readings in, primarily, breadth and volume indicators. We also include the VIX, watching for it to penetrate outside the Bollinger Band envelope. The vertical dotted lines mark climax days -- red for downside climaxes, and green for upside. Climaxes are at their core exhaustion events; however, at price pivots they may be initiating a change of trend.
Short-Term Market Indicators: The short-term market trend is UP and the condition is OVERBOUGHT.
Swenlin Trading Oscillators (STOs) topped on today's decline which doesn't bode well. Participation is still healthy enough despite a small drop today. We have plenty of rising PMOs to keep the market elevated.
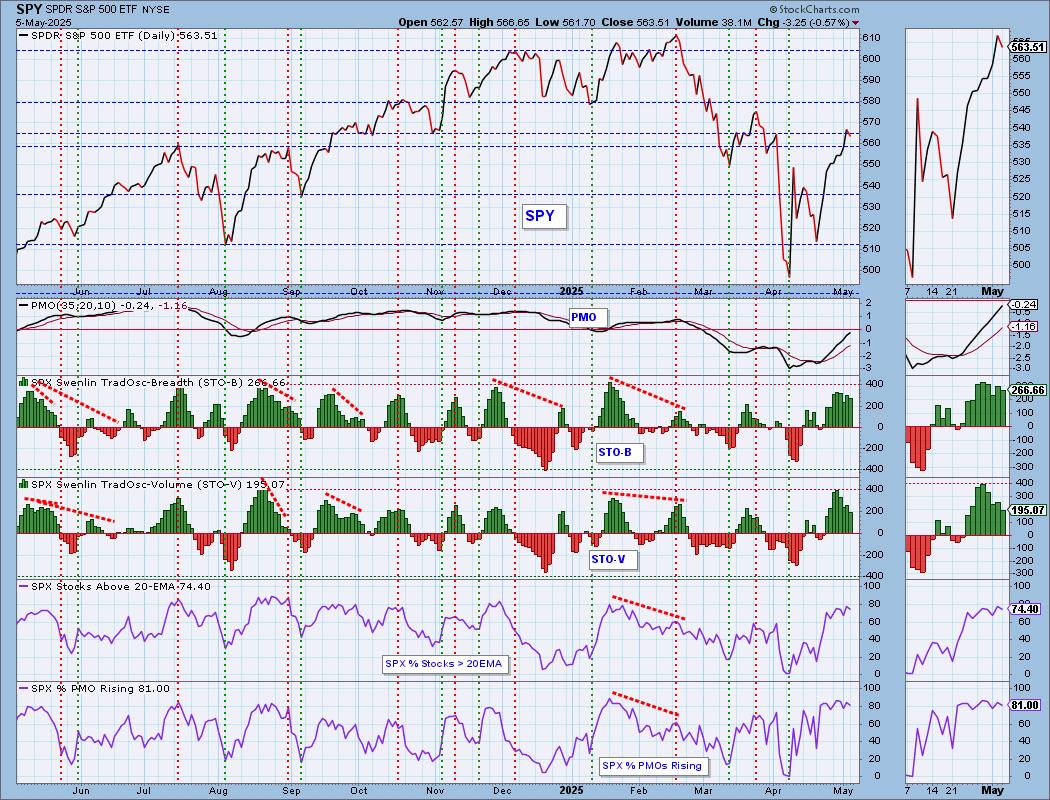
Intermediate-Term Market Indicators: The intermediate-term market trend is DOWN and the condition is SOMEWHAT OVERBOUGHT.
STOs above are overbought and we would say that both the ITBM and ITVM are overbought now. They can certainly move higher from here, but it does keep us somewhat cautious. We have a large number of PMO BUY Signals which could also keep the rally going.
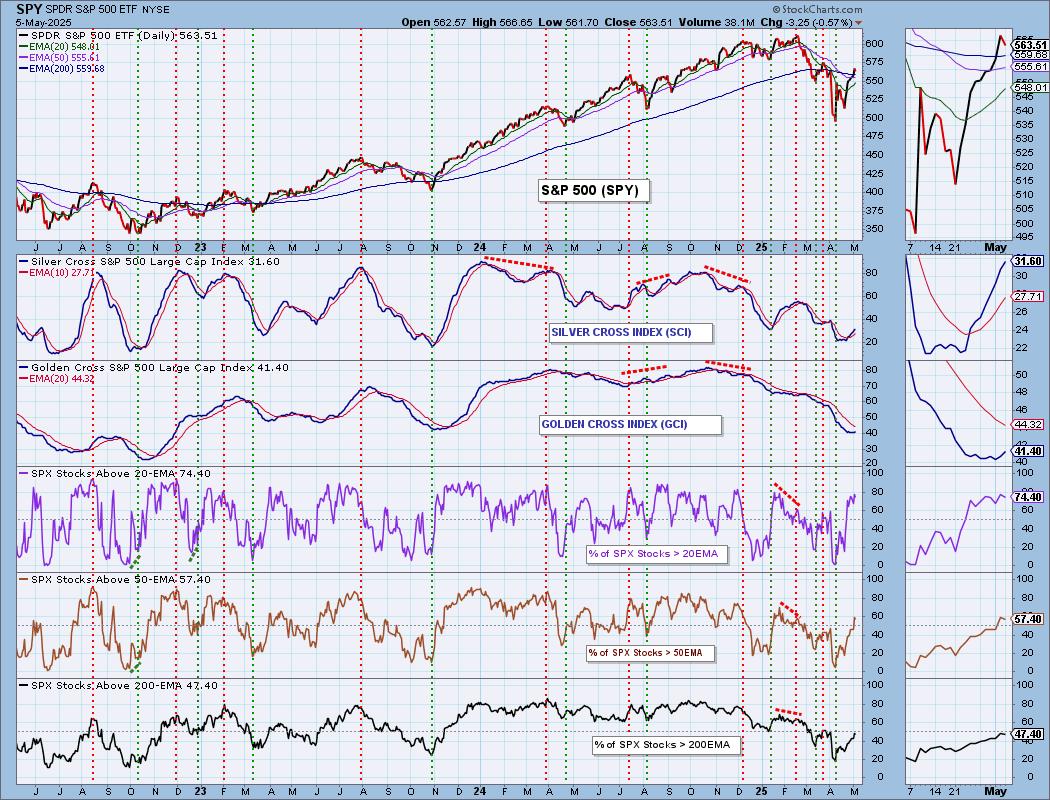
PARTICIPATION CHART (S&P 500): The following chart objectively shows the depth and trend of participation for the SPX in two time frames.
- Intermediate-Term - the Silver Cross Index (SCI) shows the percentage of SPX stocks on IT Trend Model BUY signals (20-EMA > 50-EMA). The opposite of the Silver Cross is a "Dark Cross" -- those stocks are, at the very least, in a correction.
- Long-Term - the Golden Cross Index (GCI) shows the percentage of SPX stocks on LT Trend Model BUY signals (50-EMA > 200-EMA). The opposite of a Golden Cross is the "Death Cross" -- those stocks are in a bear market.
The market bias is BULLISH in the intermediate term.
The market bias is BEARISH in the long term.
Participation levels are fairly healthy right now, although we would like to see more stocks get above their 200-day EMAs to push that reading above our bullish 50% threshold. The Silver Cross Index is rising strongly and with participation of stocks above their 20/50-day EMAs being much higher, we should see it continue to advance. The Golden Cross Index has now bottomed and should continue higher from here as there are more stocks above their 50/200-day EMAs than those with Golden Crosses.
The Silver Cross Index is above its signal line so the IT Bias is BULLISH. The Golden Cross Index is below its signal line so the LT Bias is BEARISH.
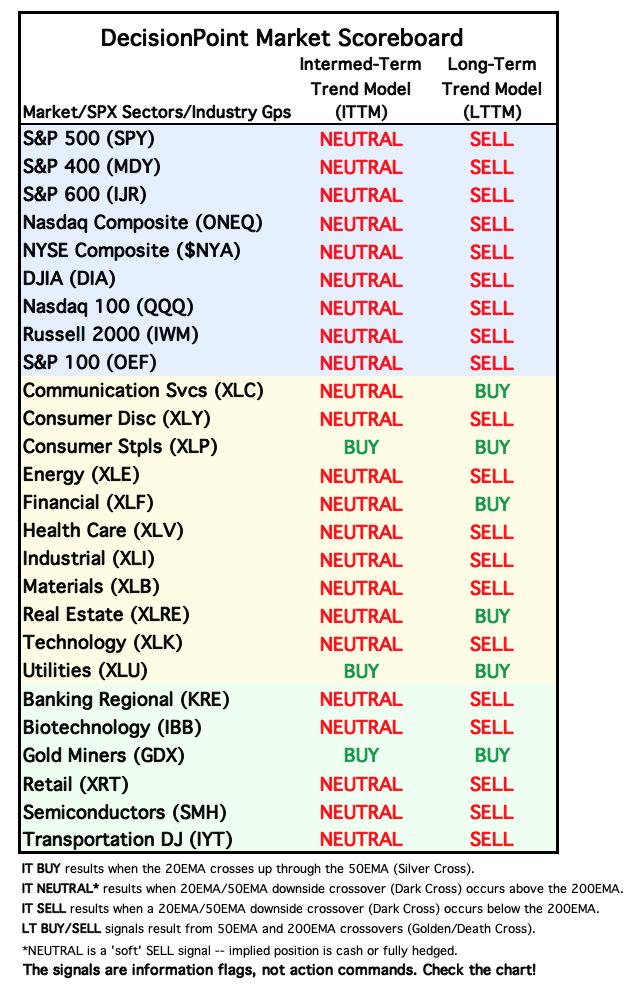
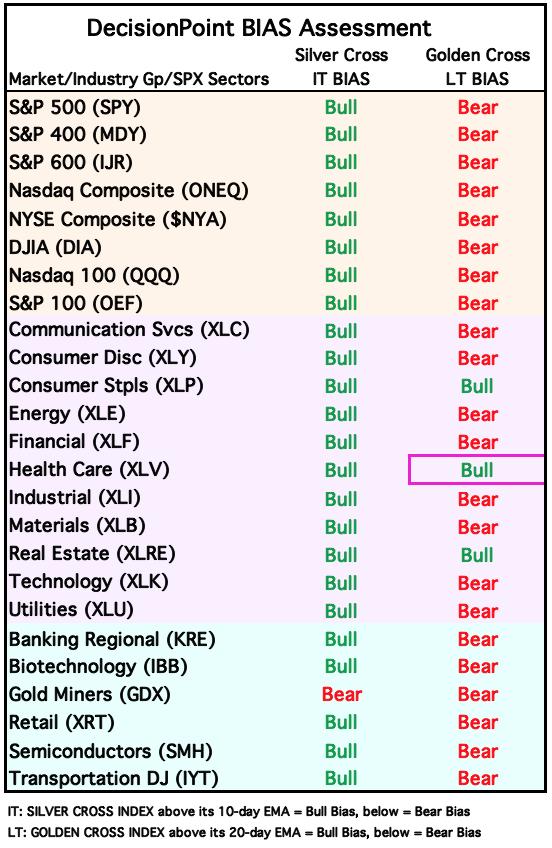
BIAS Assessment: The following table expresses the current BIAS of various price indexes based upon the relationship of the Silver Cross Index to its 10-day EMA (intermediate-term), and of the Golden Cross Index to its 20-day EMA (long-term). When the Index is above the EMA it is bullish, and it is bearish when the Index is below the EMA. The BIAS does not imply that any particular action should be taken. It is information to be used in the decision process.
The items with highlighted borders indicate that the BIAS changed today.
*****************************************************************************************************
CONCLUSION: The market stalled as investors wait to find out what the Fed announcement will be this week. Wording will be as important as ever with their outlook suggesting rate cuts this year. Overall the rally had gotten overheated. It was time for at least a pause and that is what we got. The internals are still very strong with plenty of rising PMOs and PMO BUY Signals. The Bias Table looks bullish. We do have the problem of topping STOs and this wasn't much of decline given the relentless rally that brought us here. We still think the market needs to contract. We expect trading to be muted on the eve of the Fed announcement and press conference.
Erin is 10% long, 0% short. (This is intended as information, not a recommendation.)
*****************************************************************************************************
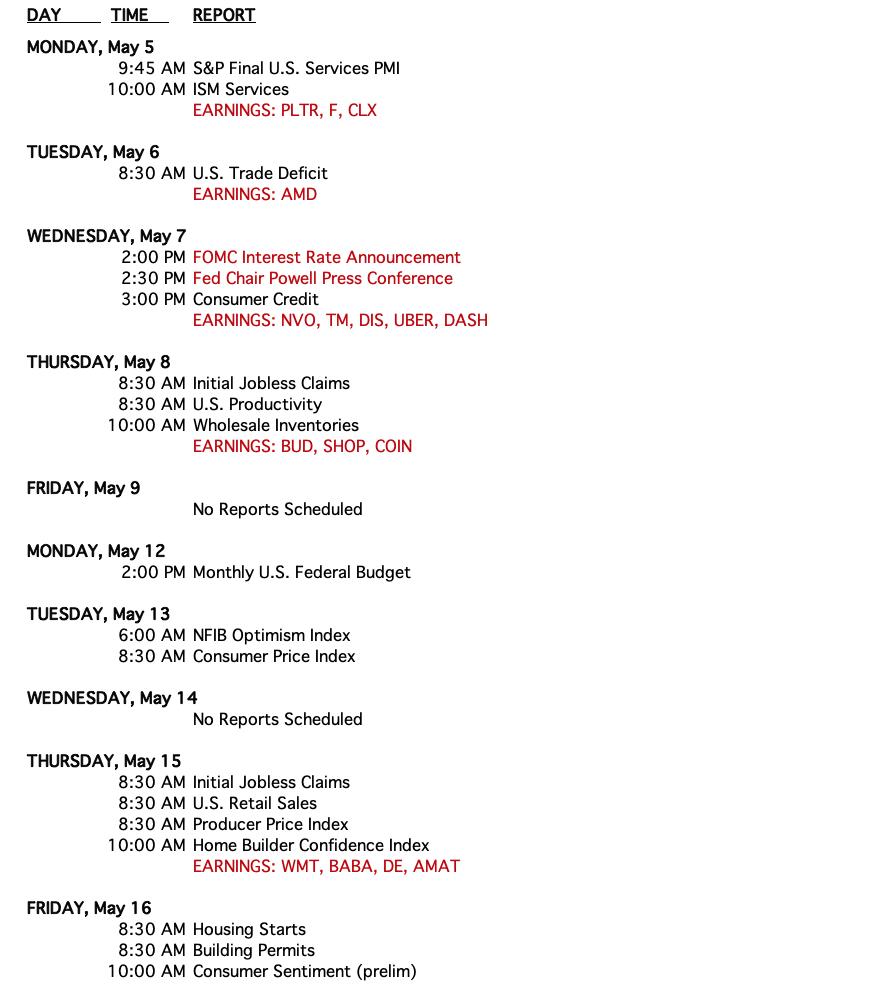
CALENDAR
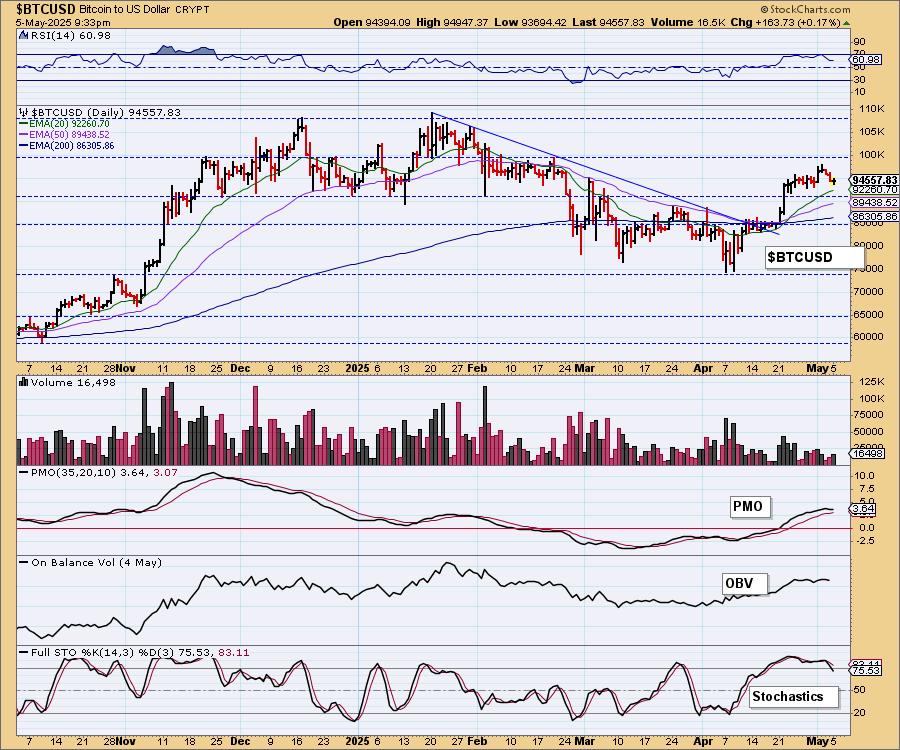
BITCOIN
Bitcoin's rally is floundering already. The PMO has topped. We were looking toward all-time highs, but it appears we are going to see a test of support beforehand. Stochastics dropped below 80 and are falling so we expect more bumpy trading.
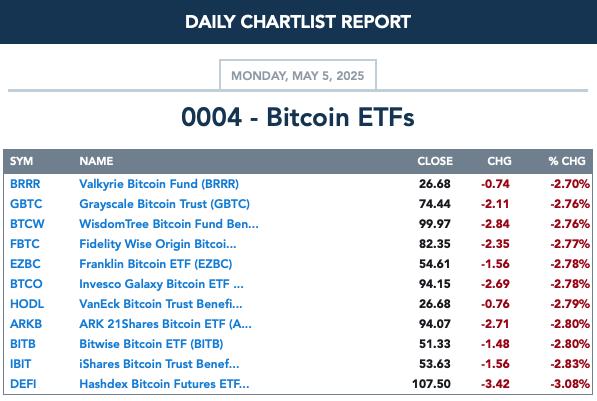
BITCOIN ETFs
INTEREST RATES
Yields are back on the rise after testing support. We expect them to rise further from here.
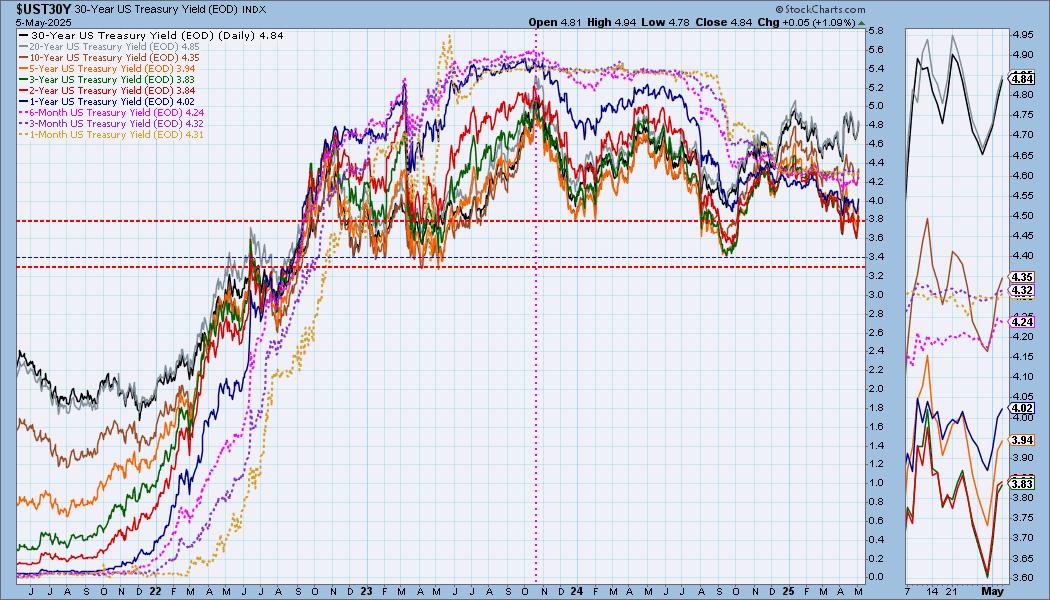
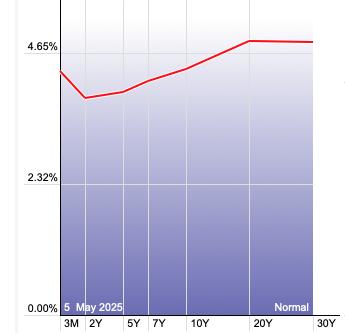
The Yield Curve Chart from StockCharts.com shows us the inversions taking place. The red line should move higher from left to right. Inversions are occurring where it moves downward.
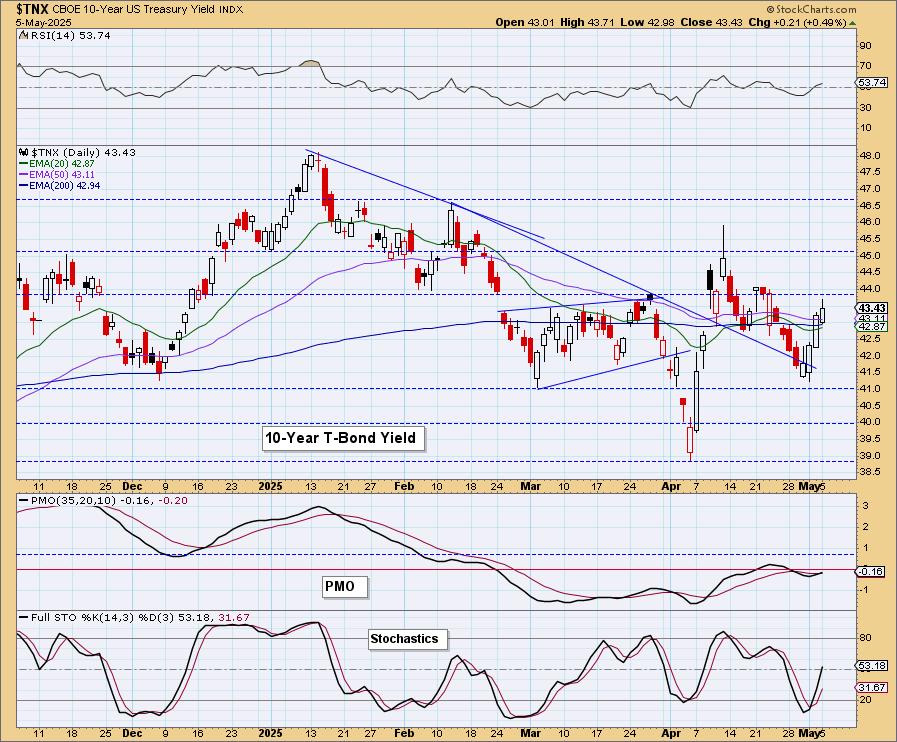
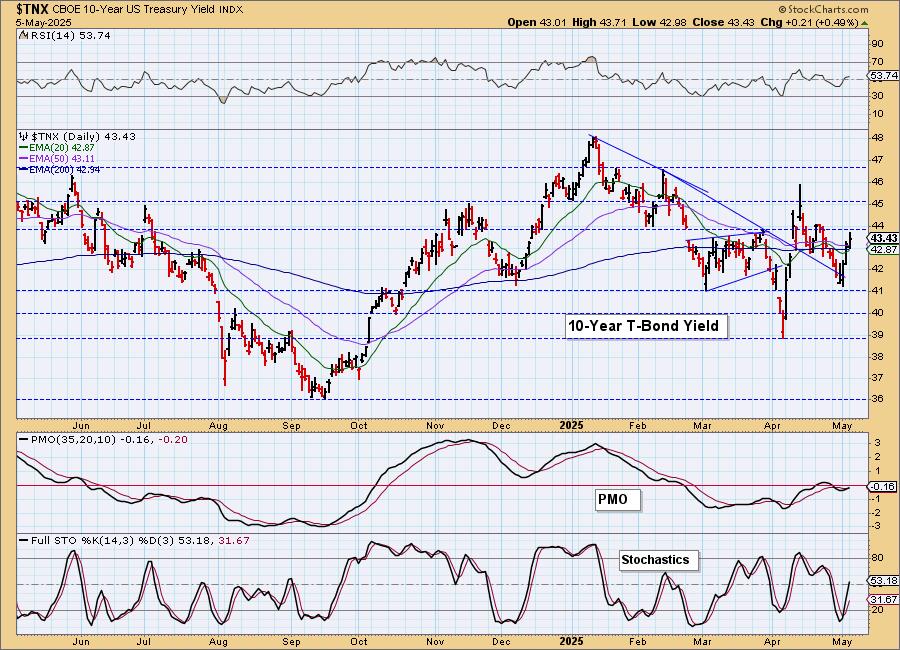
10-YEAR T-BOND YIELD
$TNX is headed back up and based on the PMO's new Crossover BUY Signal, we should expect it to move higher from here. Stochastics look very bullish alongside a positive RSI.
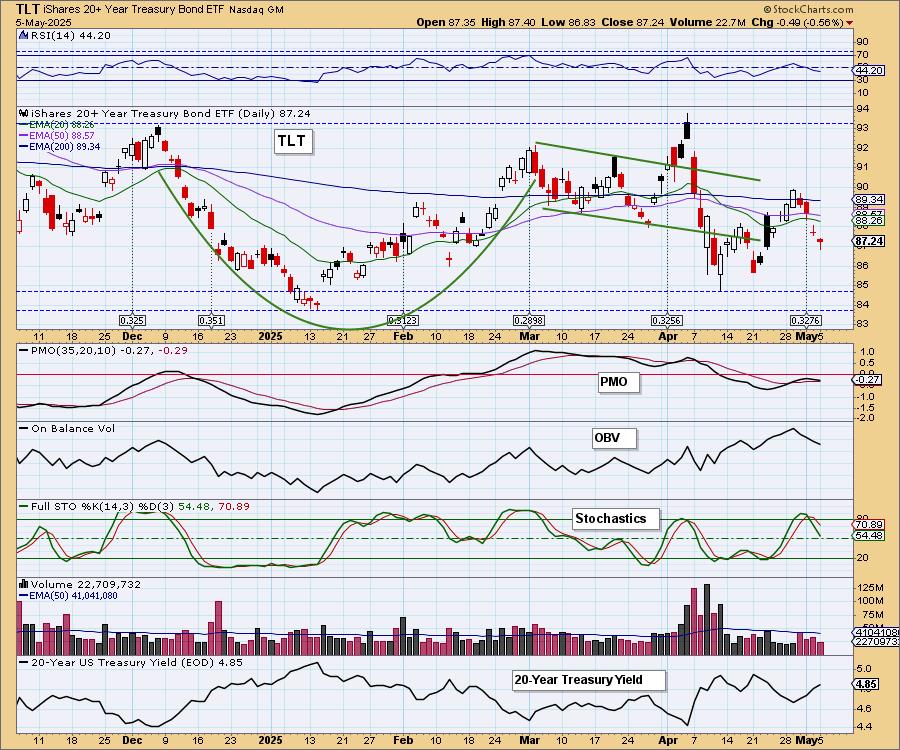
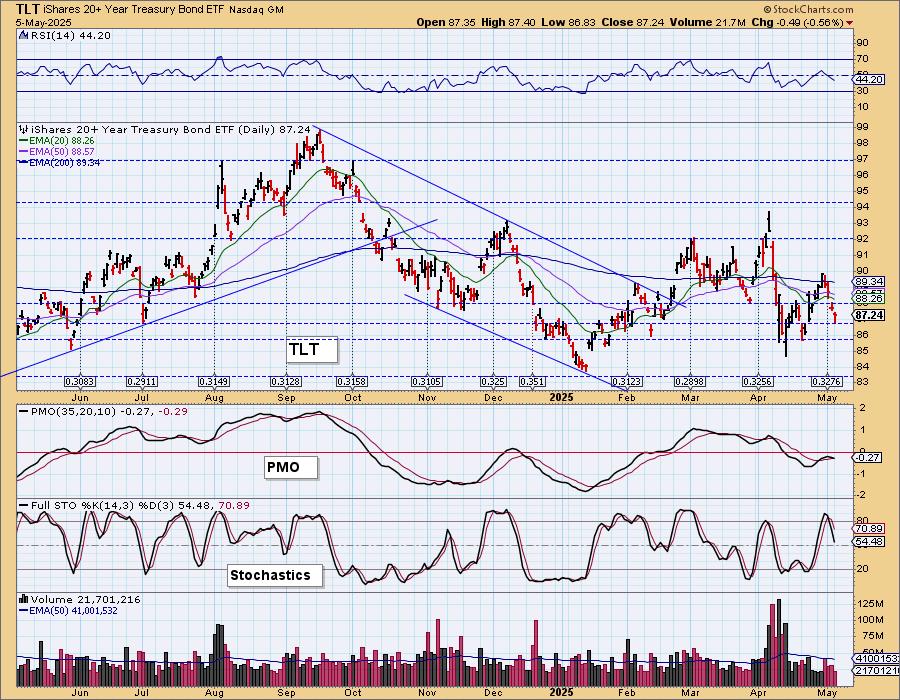
BONDS (TLT)
IT Trend Model: SELL as of 4/14/2025
LT Trend Model: SELL as of 12/13/2024
TLT Daily Chart: With yields back on the rise, we are not going to see higher prices on Bond funds. The PMO topped beneath the signal line and Stochastics are dropping quickly. We would look for a test of support at the January low.
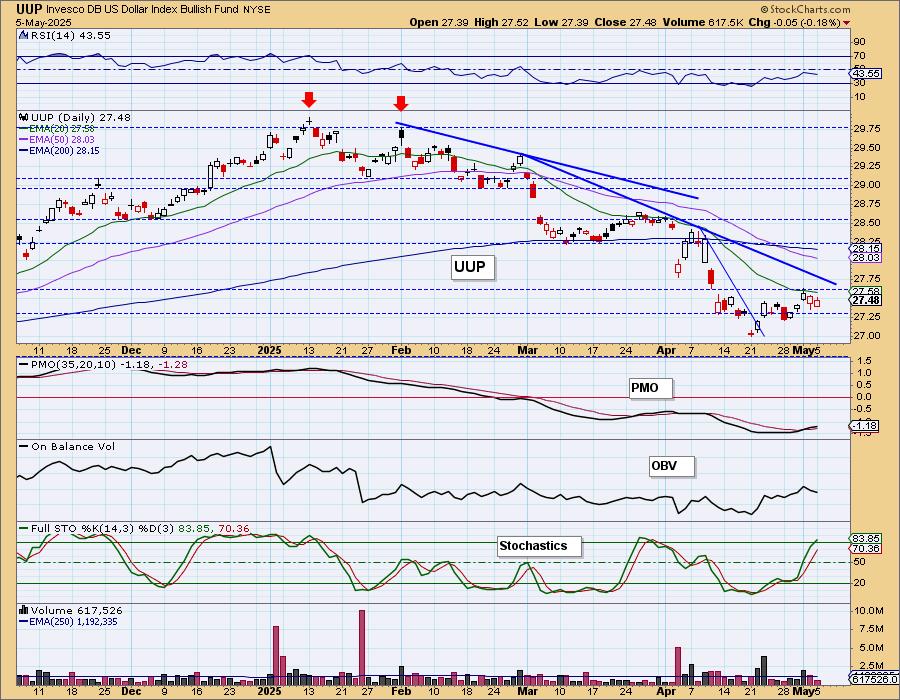
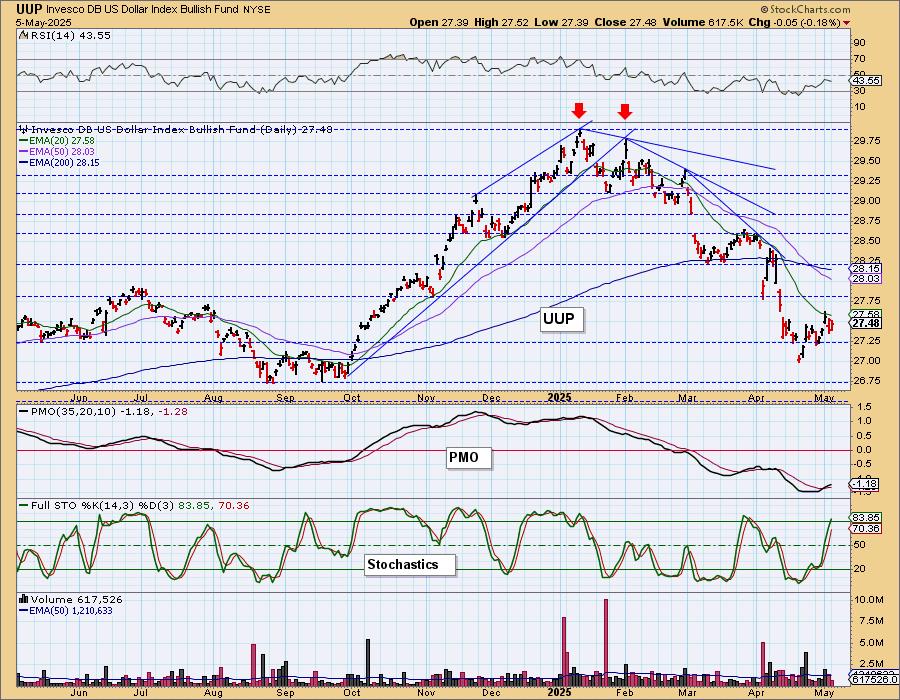
DOLLAR (UUP)
IT Trend Model: NEUTRAL as of 3/5/2025
LT Trend Model: SELL as of 4/25/2025
UUP Daily Chart: It is slow going, but the Dollar is on a rally. We have a short-term rising trend as price makes its way toward the declining tops trendline. There is a PMO Crossover BUY Signal, but the PMO is barely moving higher. It tells us that this rising trend is vulnerable already. We'll count on Stochastics as they are back above 80. They do seem to suggest that the rally will continue.
GOLD
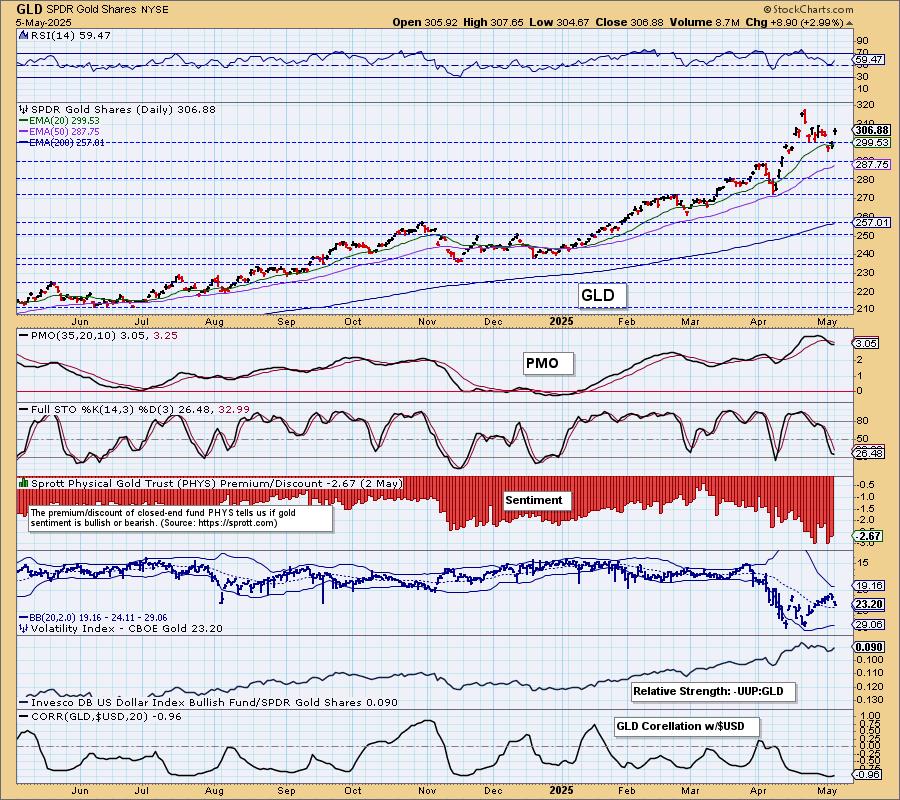
IT Trend Model: BUY as of 1/10/2025
LT Trend Model: BUY as of 10/20/2023
GLD Daily Chart: We noted a bullish falling wedge on a flagpole. We hadn't expected it to break out so soon, but here we are. The PMO was yanked upward on today's spectacular rally. Stochastics aren't particularly bullish yet so we aren't so sure we'll see fantastic follow-through. If the market struggles, we would expect Gold to see more upside. For now, we will look for some sideways movement.
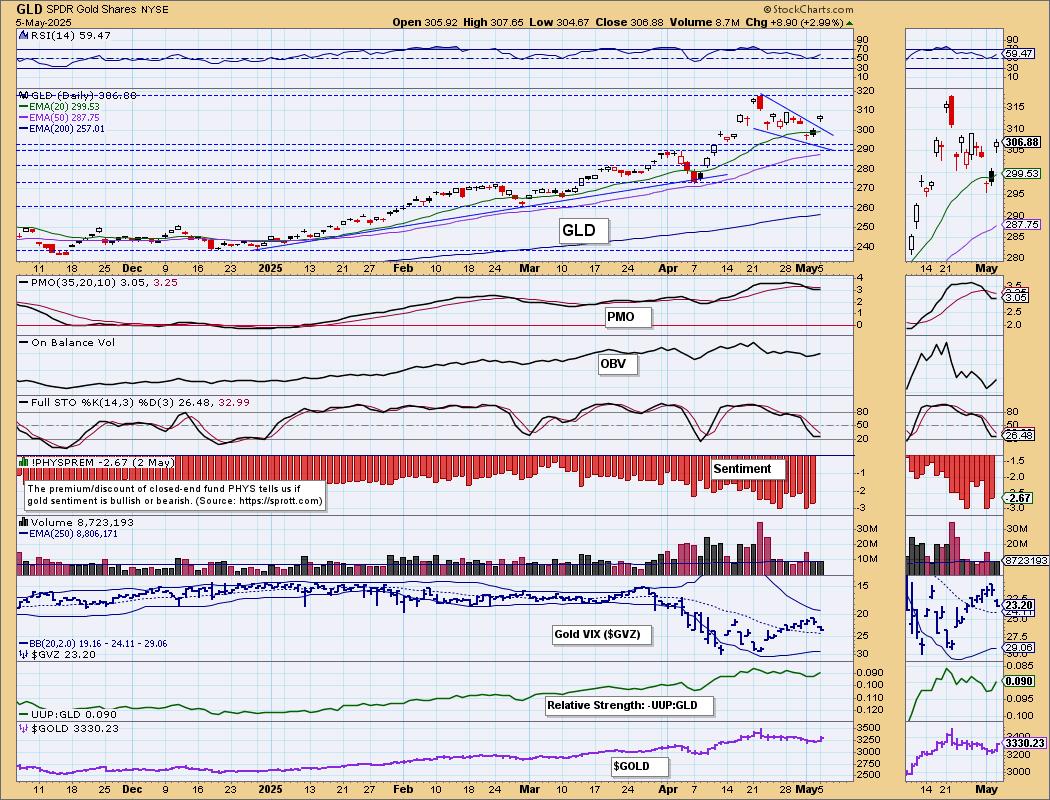
Discounts remain very high suggesting investors are still quite bearish on Gold. This could work in its favor as excessive bearish sentiment is bullish. If the Dollar does rally, Gold is likely to struggle given the correlation is almost a perfect inverse with the Dollar. However, the Dollar doesn't look that bullish so it may not be a problem yet.
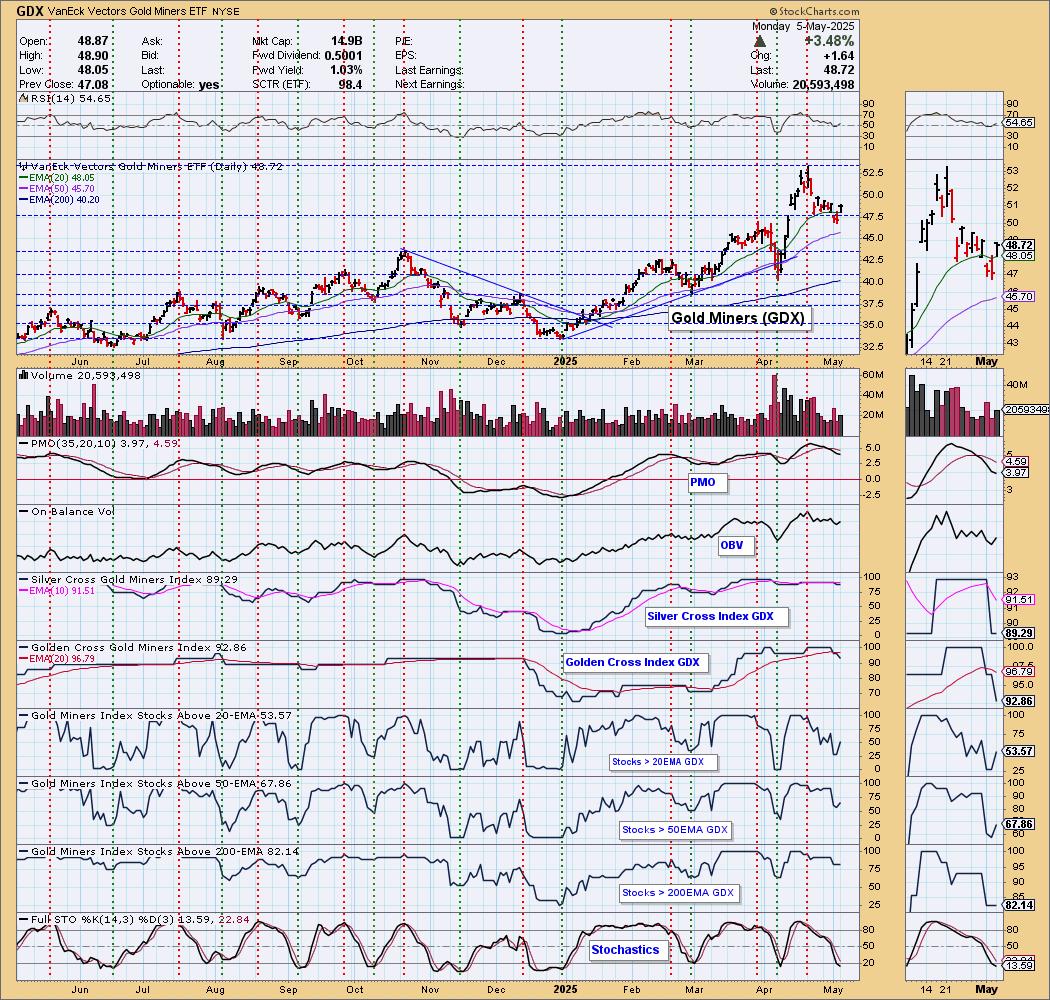
GOLD MINERS (GDX) Daily Chart: Gold Miners followed suit with Gold and rallied strongly. This is a good area of support to look for more upside, but the PMO is still declining. We do note that participation readings are good enough to support more rally. If Gold flounders though, this group will struggle. It seems a bit early to get in here.
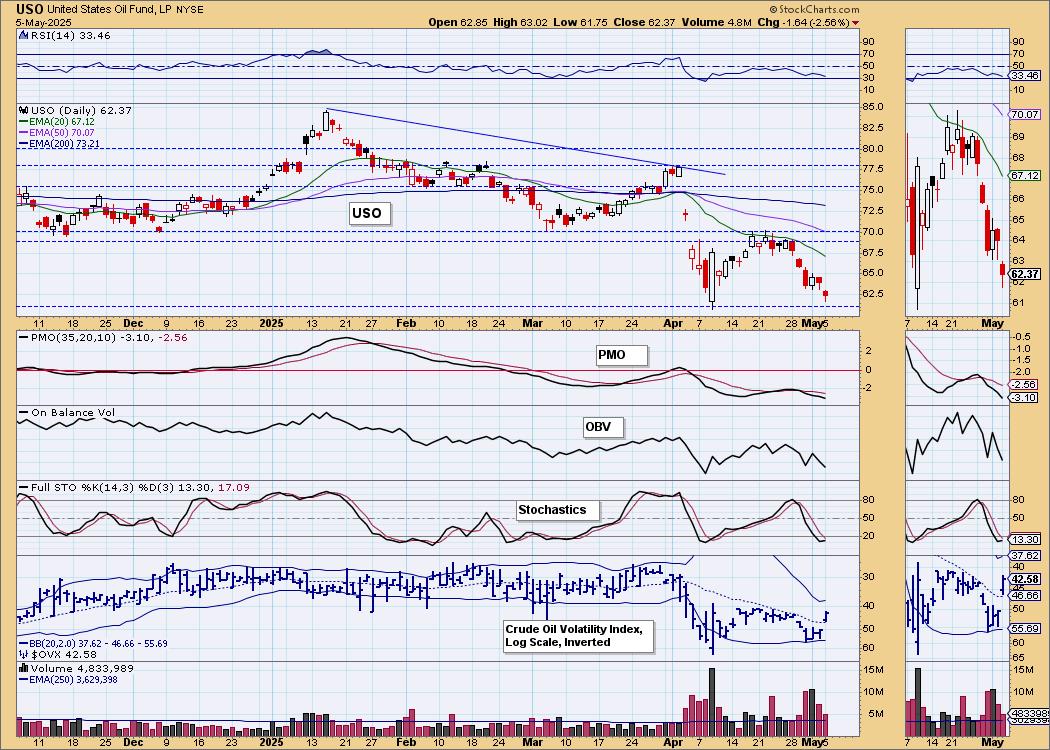
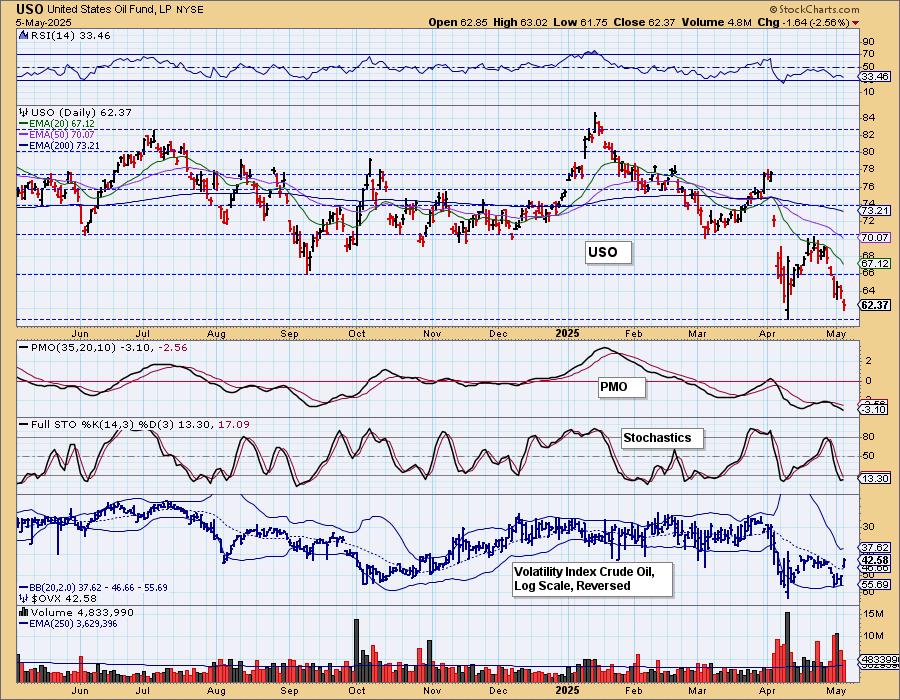
CRUDE OIL (USO)
IT Trend Model: NEUTRAL as of 2/27/2025
LT Trend Model: SELL as of 3/18/2025
USO Daily Chart: OPEC+ is increasing production and that will continue to put downside pressure on Crude Oil prices. Support has been reached but we think it is very vulnerable given the PMO is declining well below the zero line. Stochastics did tip upward but ultimately production increases will continue to put a damper on USO.
Good Luck & Good Trading!
Erin Swenlin and Carl Swenlin
Technical Analysis is a windsock, not a crystal ball. --Carl Swenlin
(c) Copyright 2025 DecisionPoint.com
Disclaimer: This blog is for educational purposes only and should not be construed as financial advice. The ideas and strategies should never be used without first assessing your own personal and financial situation, or without consulting a financial professional. Any opinions expressed herein are solely those of the author, and do not in any way represent the views or opinions of any other person or entity.
DecisionPoint is not a registered investment advisor. Investment and trading decisions are solely your responsibility. DecisionPoint newsletters, blogs or website materials should NOT be interpreted as a recommendation or solicitation to buy or sell any security or to take any specific action.
NOTE: The signal status reported herein is based upon mechanical trading model signals, specifically, the DecisionPoint Trend Model. They define the implied bias of the price index based upon moving average relationships, but they do not necessarily call for a specific action. They are information flags that should prompt chart review. Further, they do not call for continuous buying or selling during the life of the signal. For example, a BUY signal will probably (but not necessarily) return the best results if action is taken soon after the signal is generated. Additional opportunities for buying may be found as price zigzags higher, but the trader must look for optimum entry points. Conversely, exit points to preserve gains (or minimize losses) may be evident before the model mechanically closes the signal.
Helpful DecisionPoint Links:
DecisionPoint Alert Chart List
DecisionPoint Golden Cross/Silver Cross Index Chart List
DecisionPoint Sector Chart List
Price Momentum Oscillator (PMO)