
* * * * * * * * * * * * * *
Carl has decided to retire, and Erin will be joining him in retirement. We will continue publication until June 27th, and we will be contacting you soon via email as to how this will affect your subscriptions.
* * * * * * * * * * * * * *
Today the Real Estate Sector ETF (XLRE) 50-day EMA crossed up through the 200-day EMA (Golden Cross), generating an IT Trend Model BUY Signal. We just wrote about a recent Death Cross and now we have a Golden Cross. This signal is vulnerable as long as price is near the 200-day EMA. A drop below will likely change the signal back. Participation does look good for XLRE as %Stocks > 20/50/200EMAs are above our bullish 50% threshold. We're waiting on the Silver Cross Index to cross above its signal line for a Bullish Shift so there is still plenty of work to do. The Golden Cross Index did cross above its signal line so the LT Bias is Bullish for XLRE.
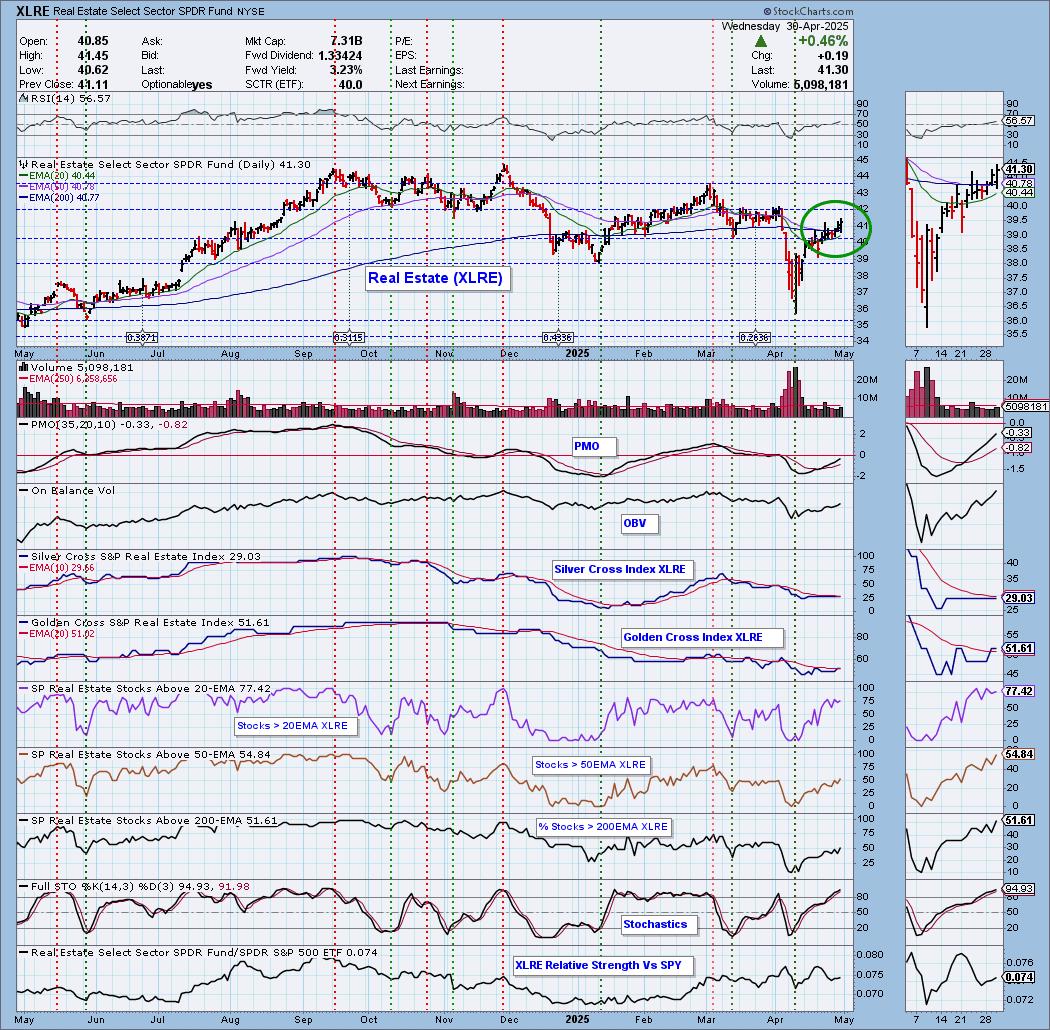
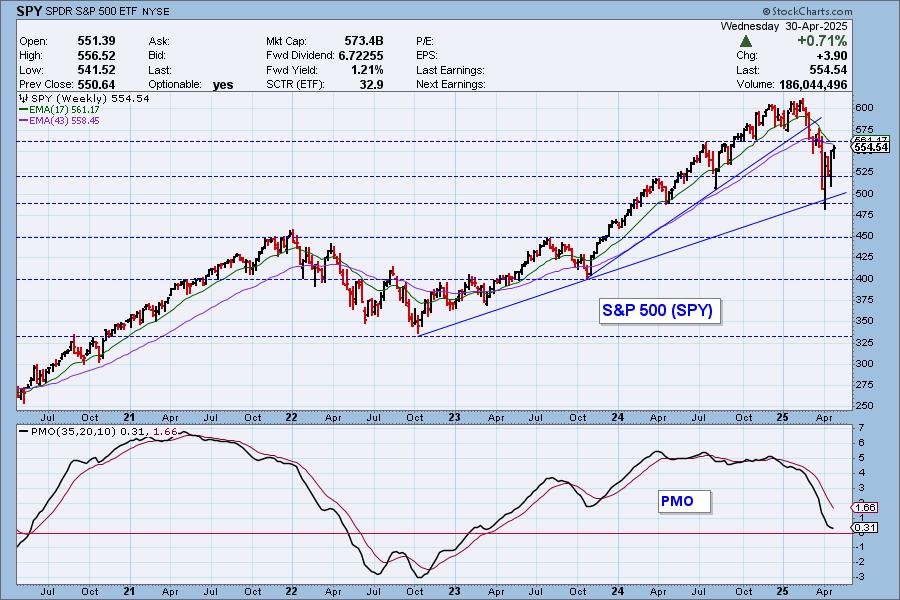
This looks like a good reversal off the longer-term rising bottoms trendline, but the weekly PMO is still in decline so we don't want to get too bullish on this upside reversal. We need to see the declining trend broken soon.
The DecisionPoint Alert Weekly Wrap presents an end-of-week assessment of the trend and condition of the Stock Market, the U.S. Dollar, Gold, Crude Oil, and Bonds. The DecisionPoint Alert daily report (Monday through Thursday) is abbreviated and gives updates on the Weekly Wrap assessments.
MARKET/INDUSTRY GROUP/SECTOR INDEXES
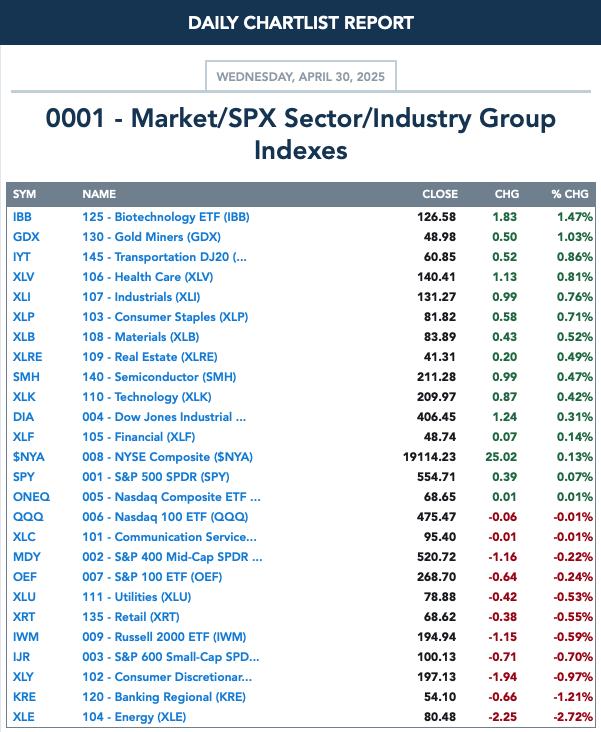
CLICK HERE for Carl's annotated Market Index, Sector, and Industry Group charts.
THE MARKET (S&P 500)
IT Trend Model: NEUTRAL as of 3/4/2025
LT Trend Model: SELL as of 4/16/2025
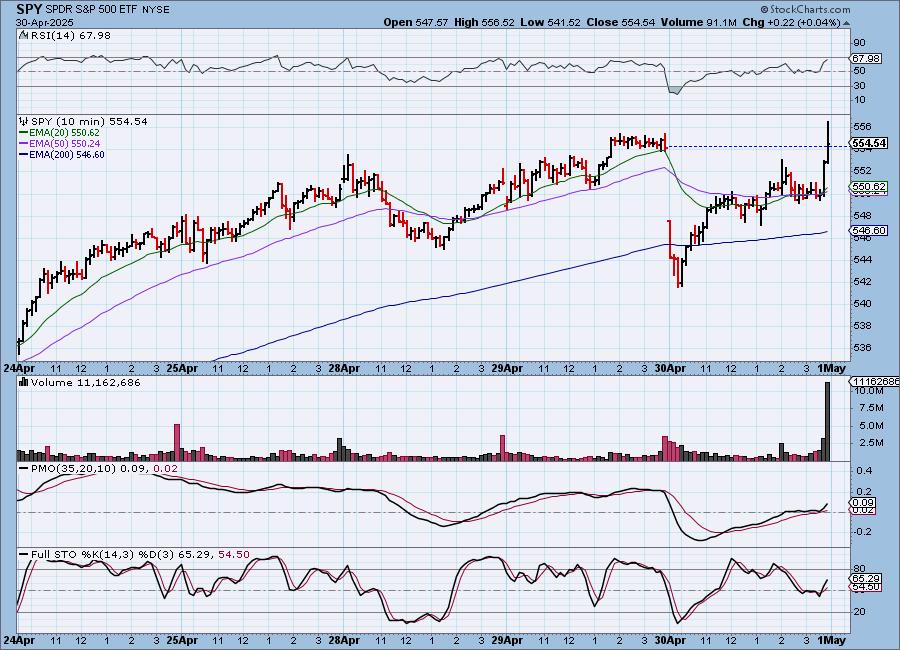
SPY 10-Minute Chart: Price dropped steeply on the open and was blamed on tariff and earnings uncertainty. That didn't last long however as the market spent the rest of the day erasing earlier losses. The thrust at the end of the day moved the 10-minute PMO up in a hurry and does suggest we'll see some upside follow-through tomorrow.
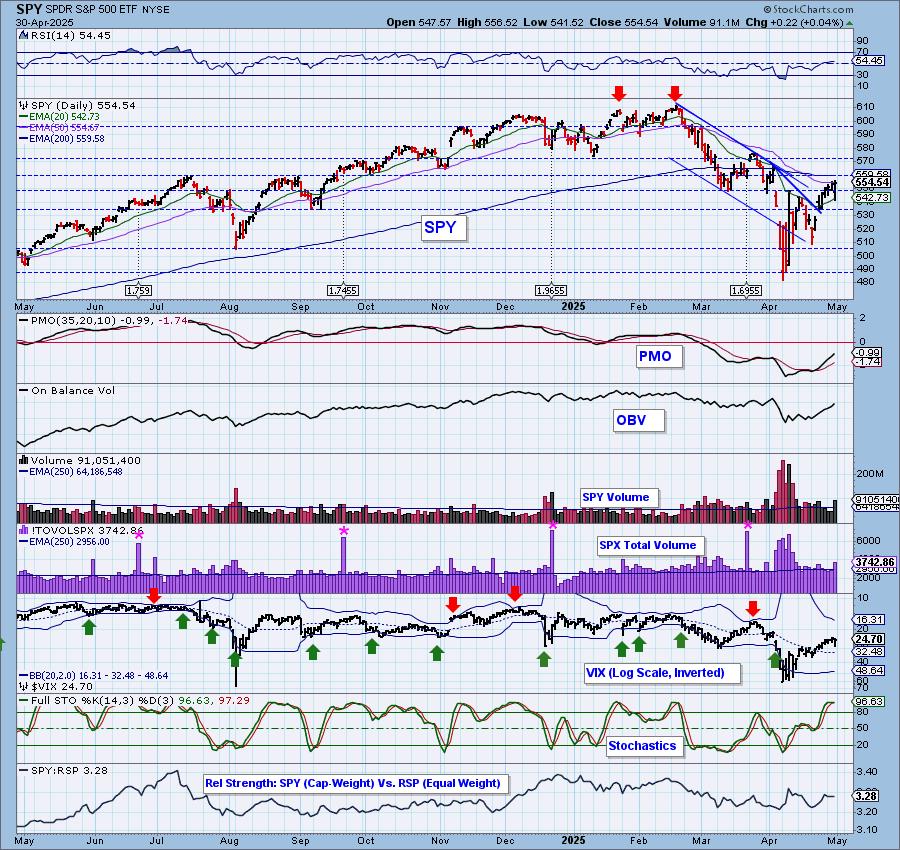
SPY Daily Chart: The market barely closed in positive territory. Price does look more tentative and could be ready to roll over. The RSI is positive though and the PMO is rising strongly presenting new strength as it puts more margin between it and its signal line. The OBV looks very bullish.
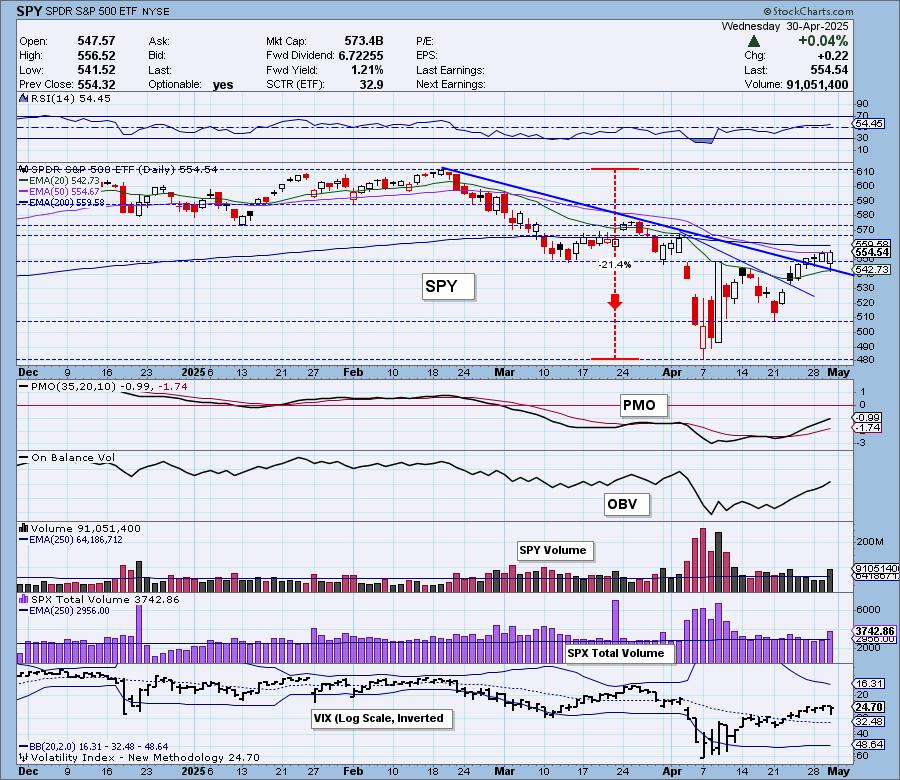
The VIX is above its moving average on the inverted scale and Stochastics are holding above 80 so we do have internal strength.
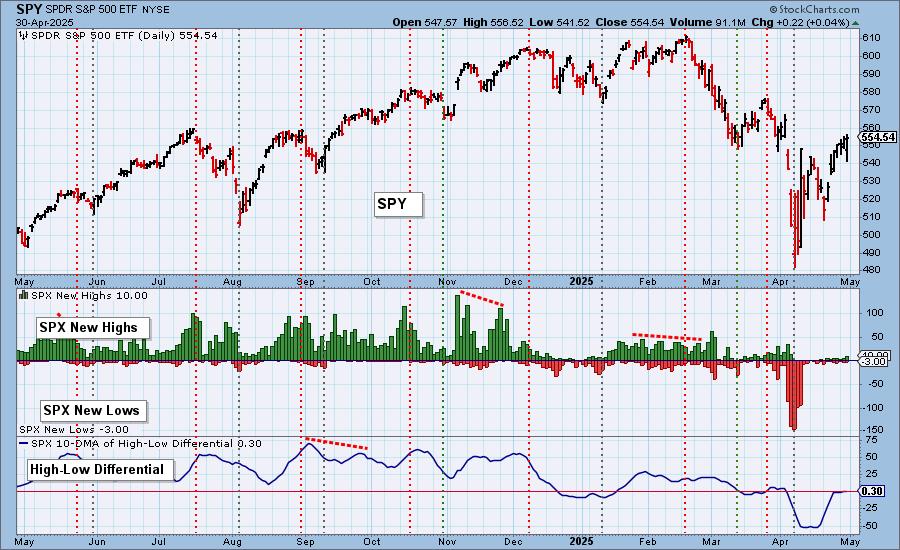
S&P 500 New 52-Week Highs/Lows: New Highs are starting to appear again which is bullish, but we do still have New Lows. The High-Low Differential is not telling us anything as it is flat along the zero line.
Climax* Analysis: There were no climax readings today.
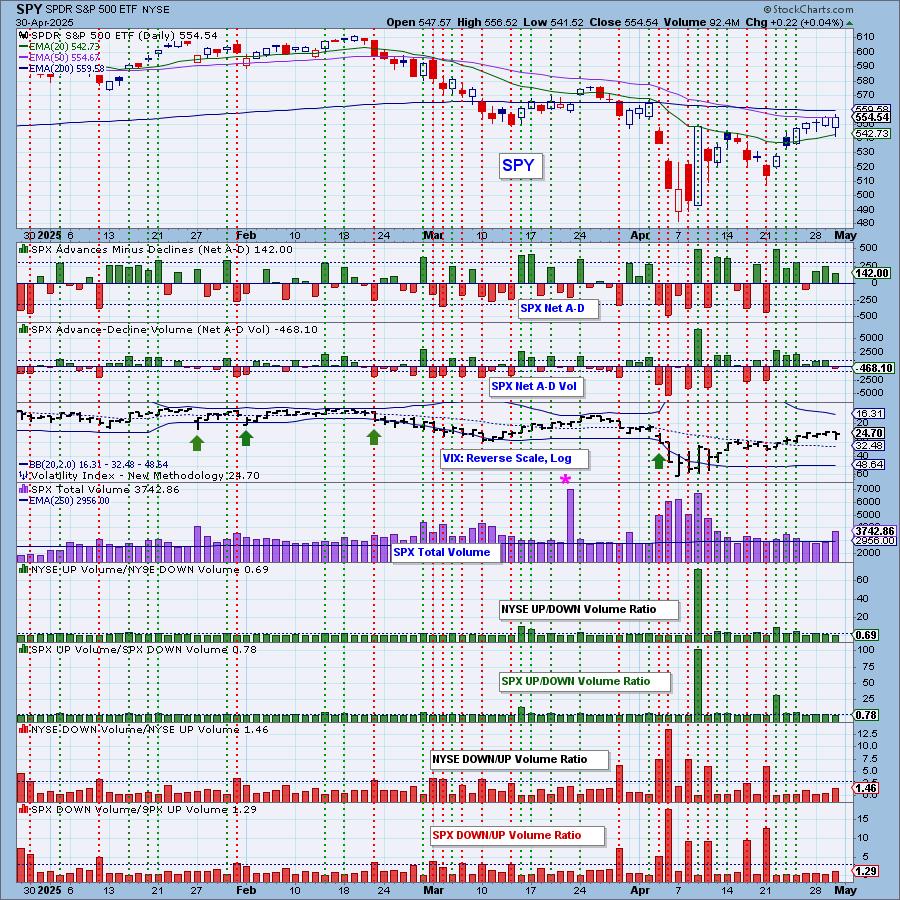
*A climax is a one-day event when market action generates very high readings in, primarily, breadth and volume indicators. We also include the VIX, watching for it to penetrate outside the Bollinger Band envelope. The vertical dotted lines mark climax days -- red for downside climaxes, and green for upside. Climaxes are at their core exhaustion events; however, at price pivots they may be initiating a change of trend.
Short-Term Market Indicators: The short-term market trend is UP and the condition is OVERBOUGHT.
Bad news today as both the Swenlin Trading Oscillators (STOs) topped. We saw some shrinkage in participation and in the number of rising PMOs. This isn't surprising given the market was down all day until the close.
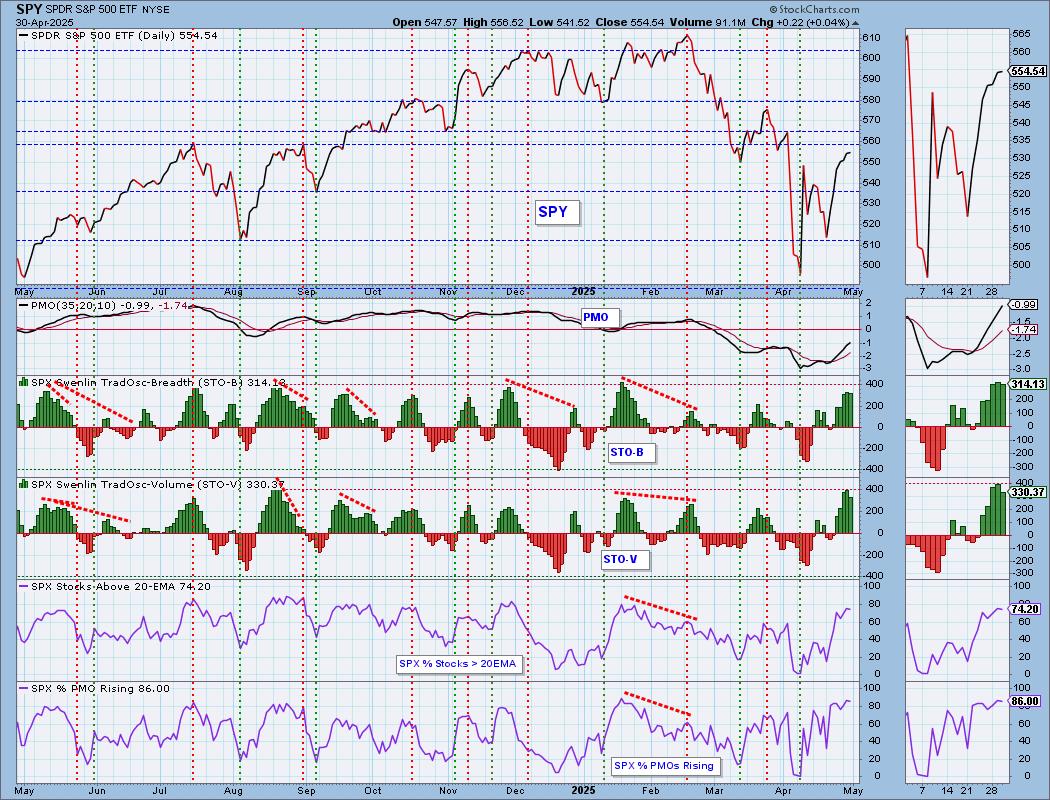
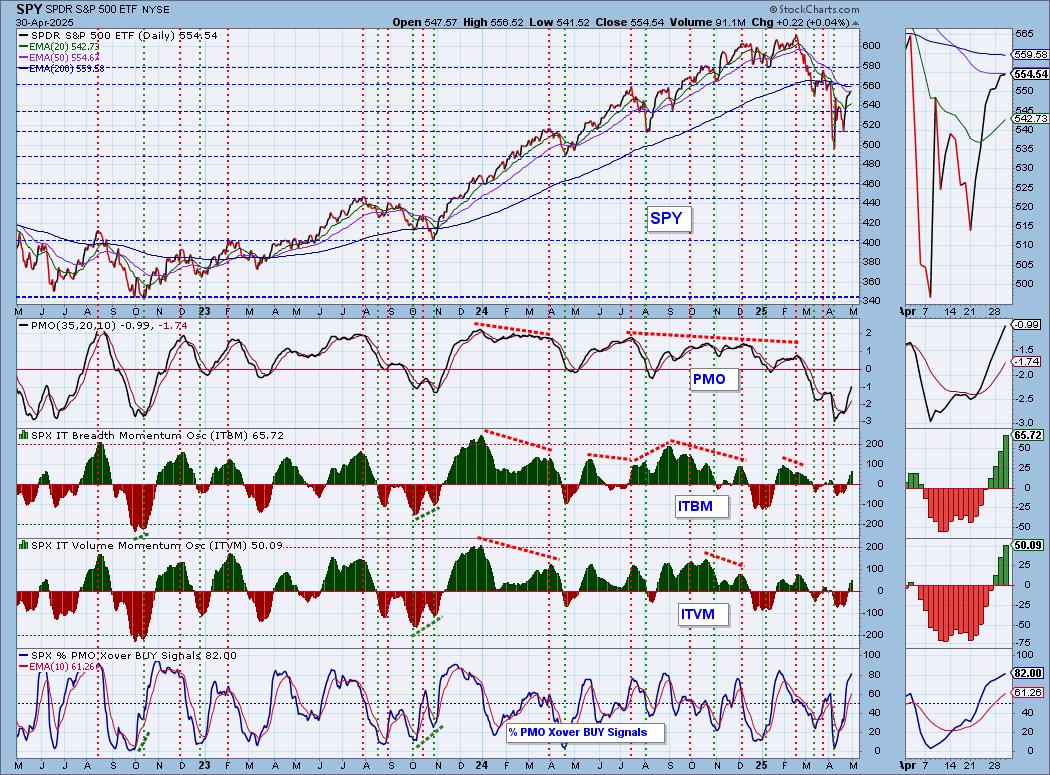
Intermediate-Term Market Indicators: The intermediate-term market trend is DOWN and the condition is NEUTRAL.
STOs may've turned over but the ITBM and ITVM are still on the rise which is good as it takes some of the sting away from newly declining STOs. We continue to see an expansion in the number of PMO BUY Signals.
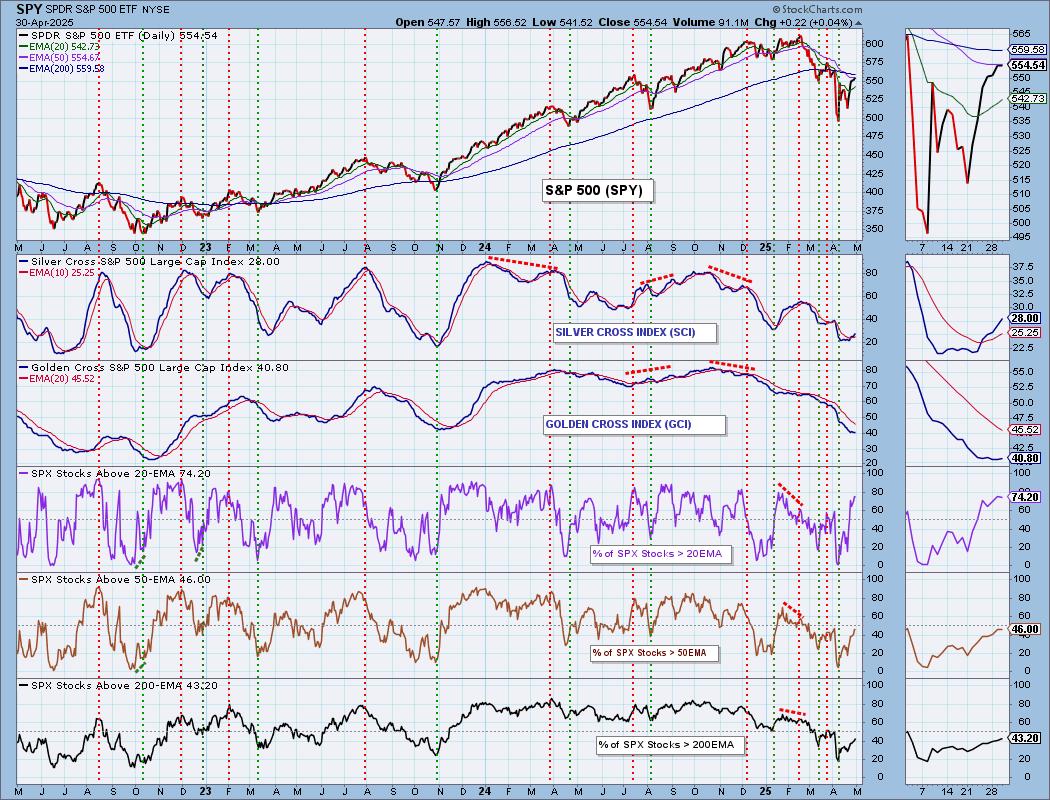
PARTICIPATION CHART (S&P 500): The following chart objectively shows the depth and trend of participation for the SPX in two time frames.
- Intermediate-Term - the Silver Cross Index (SCI) shows the percentage of SPX stocks on IT Trend Model BUY signals (20-EMA > 50-EMA). The opposite of the Silver Cross is a "Dark Cross" -- those stocks are, at the very least, in a correction.
- Long-Term - the Golden Cross Index (GCI) shows the percentage of SPX stocks on LT Trend Model BUY signals (50-EMA > 200-EMA). The opposite of a Golden Cross is the "Death Cross" -- those stocks are in a bear market.
The market bias is BULLISH in the intermediate term.
The market bias is BEARISH in the long term.
We have a healthy reading for stocks above their 20-day EMA, but we still need the other participation indicators to expand above our bullish 50% threshold. For now the Silver Cross Index is at a low 28%. It is above its signal line so the IT Bias is listed a bullish even though the reading is low. The Golden Cross Index is beginning to decelerate and did turn up today. Now that more stocks are above their 50/200-day EMAs, we can look for the Golden Cross Index to continue to move higher. It is below its signal line presently so the LT Bias is BEARISH.
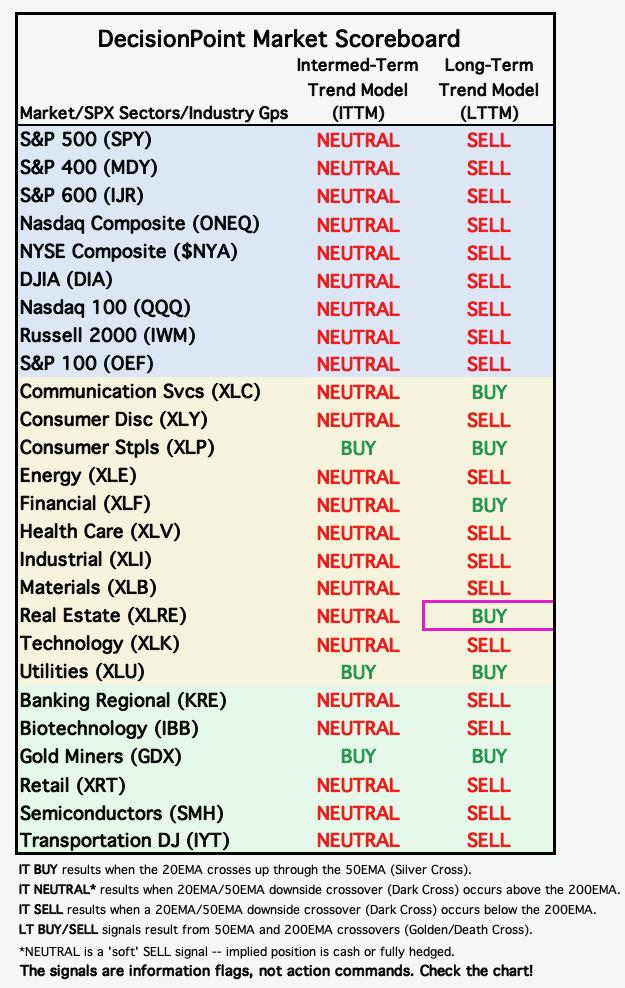
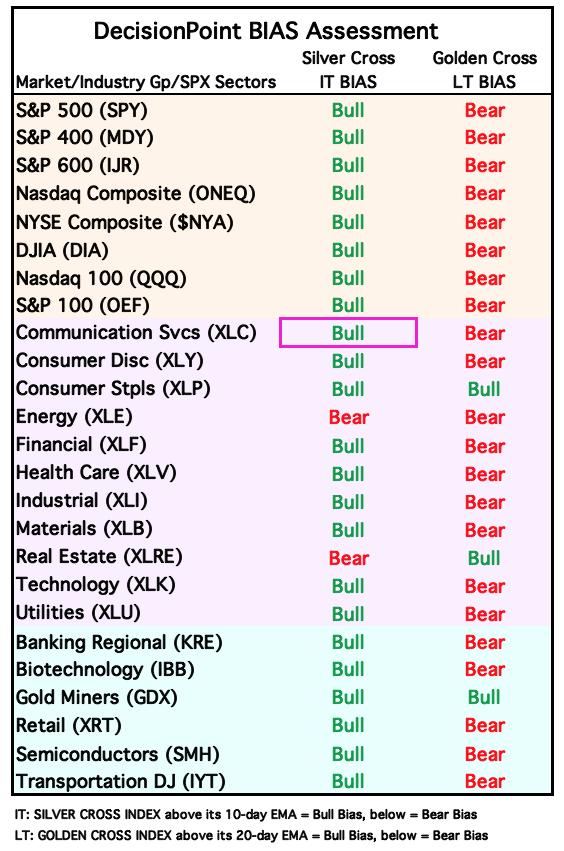
BIAS Assessment: The following table expresses the current BIAS of various price indexes based upon the relationship of the Silver Cross Index to its 10-day EMA (intermediate-term), and of the Golden Cross Index to its 20-day EMA (long-term). When the Index is above the EMA it is bullish, and it is bearish when the Index is below the EMA. The BIAS does not imply that any particular action should be taken. It is information to be used in the decision process.
The items with highlighted borders indicate that the BIAS changed today.
*****************************************************************************************************
CONCLUSION: The Bias Table above shows only two "Bear" designations on the Silver Cross Index. This is short-term bullish. Participation is healthy for stocks above their 20-day EMAs. We also have plenty of stocks holding rising PMOs and PMO BUY Signals. New Highs are beginning to appear. This all bodes well for the short term. Unfortunately we have one blemish and that is topping STOs. They are topping in overbought territory too. While we see the rally as somewhat secure in the short term, we do have to be cautious due to the STOs. Bulls were able to right the ship today. We'll see if they're strong enough to fuel the rally further. MSFT and META are up over 7.7% and 5.8% respectively in after hours trading so more rally is likely.
Erin is 10% long, 0% short. (This is intended as information, not a recommendation.)
*****************************************************************************************************
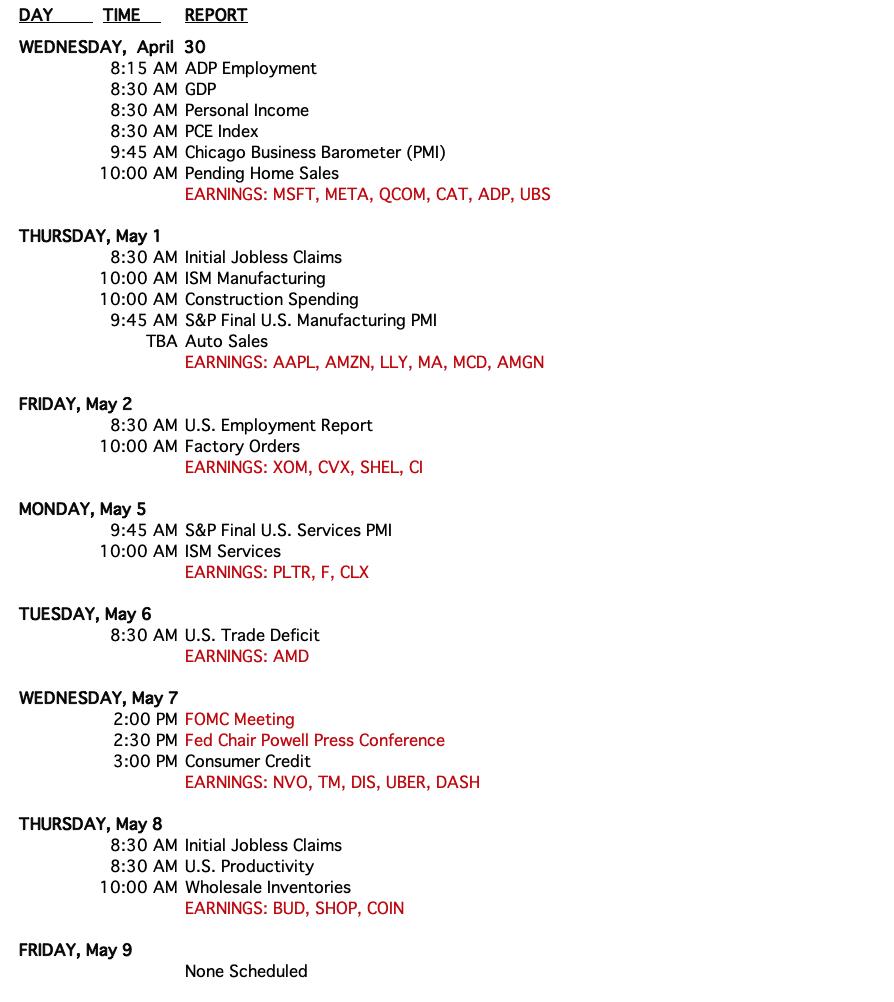
CALENDAR
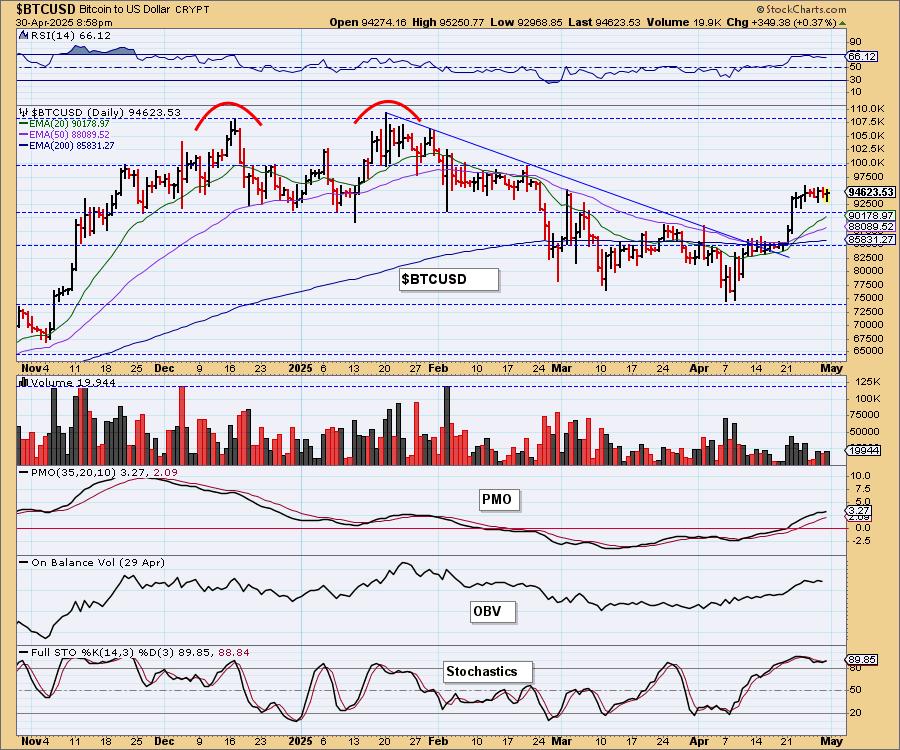
BITCOIN
Yesterday's comments still apply:
"Bitcoin had a great breakout from its declining trend. The rally got a bit heated and now it is consolidating the move. It appears we're getting a bull flag. The flag is trending up and those flags don't generally work out but we like the indicators. The RSI is positive and not overbought yet and the PMO is rising bullishly. Stochastics are also above 80. We are looking for more upside after this period of consolidation."
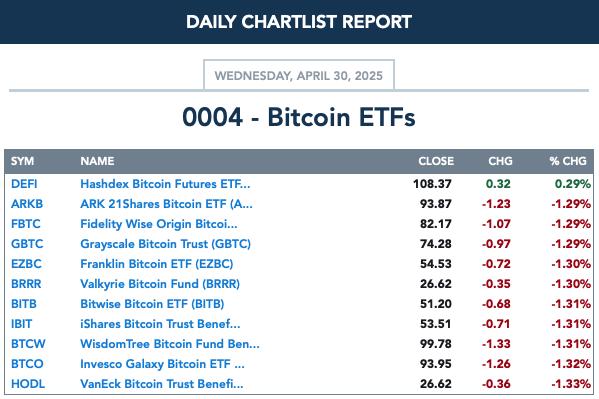
BITCOIN ETFs
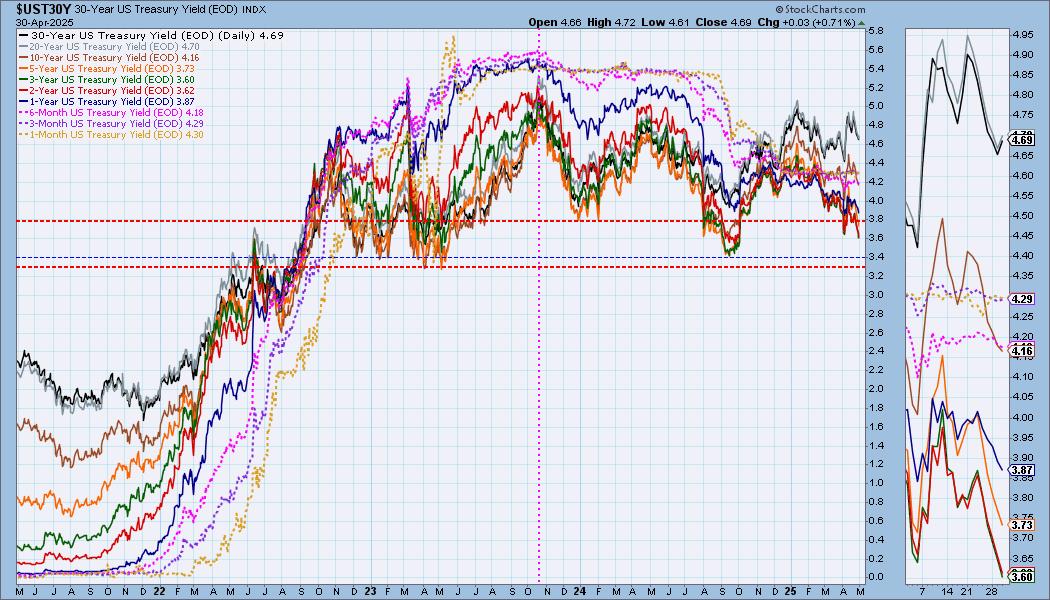
INTEREST RATES
The latest support level is now being compromised, but more support is coming. We believe yields will continue to come down from here.
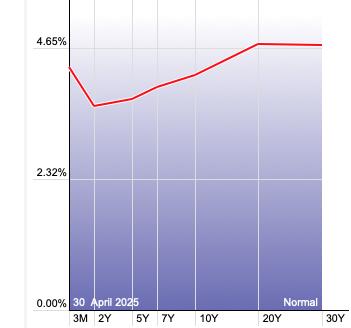
The Yield Curve Chart from StockCharts.com shows us the inversions taking place. The red line should move higher from left to right. Inversions are occurring where it moves downward.
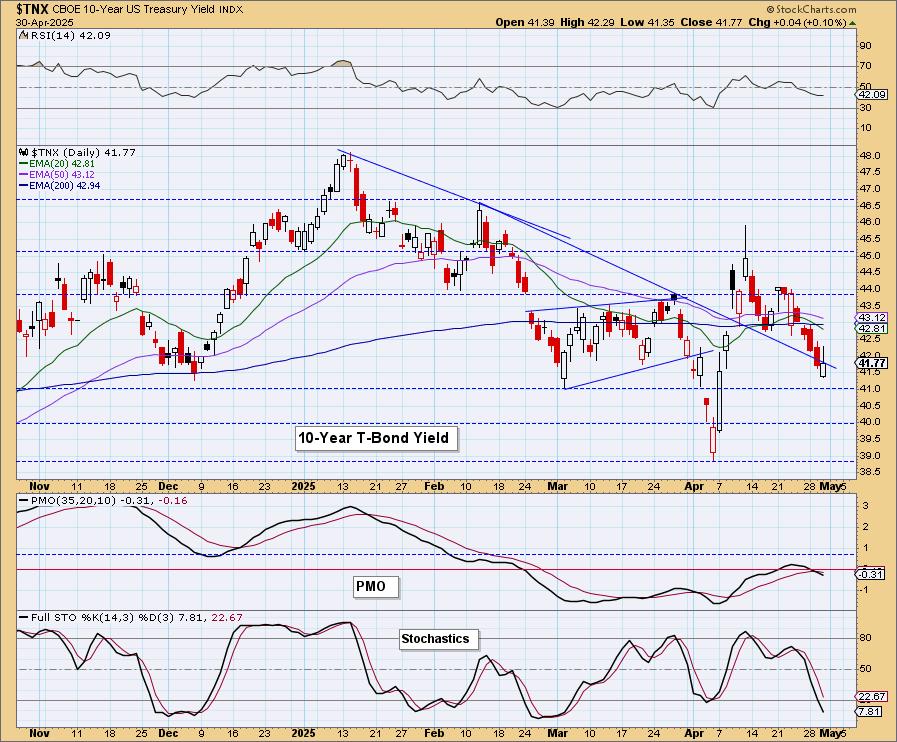
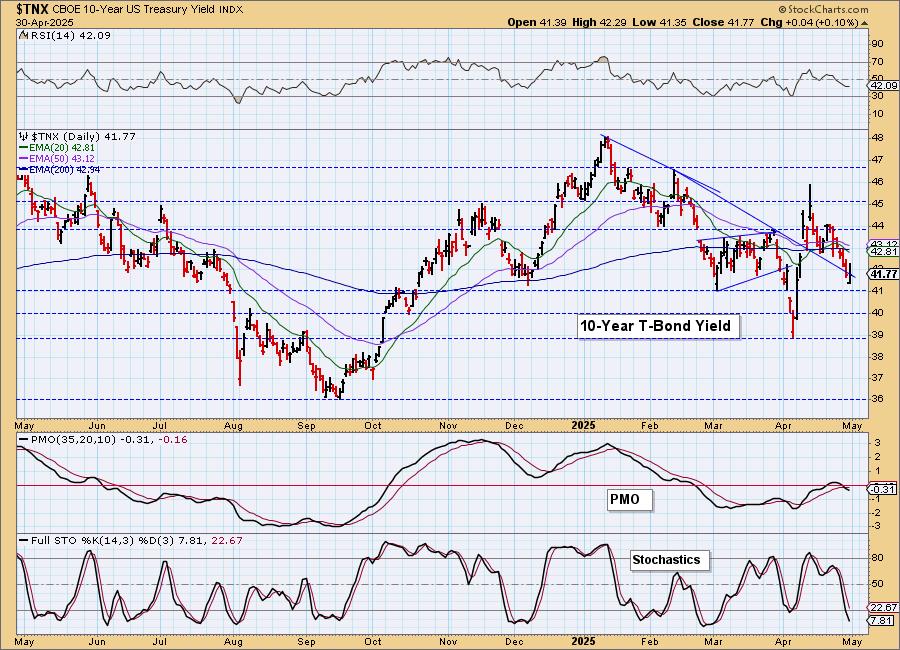
10-YEAR T-BOND YIELD
$TNX did finish higher, but it has reentered its prior declining trend. The PMO SELL Signal below the zero line is problematic as are Stochastics being below 20. We are likely to see a test of the next support level.
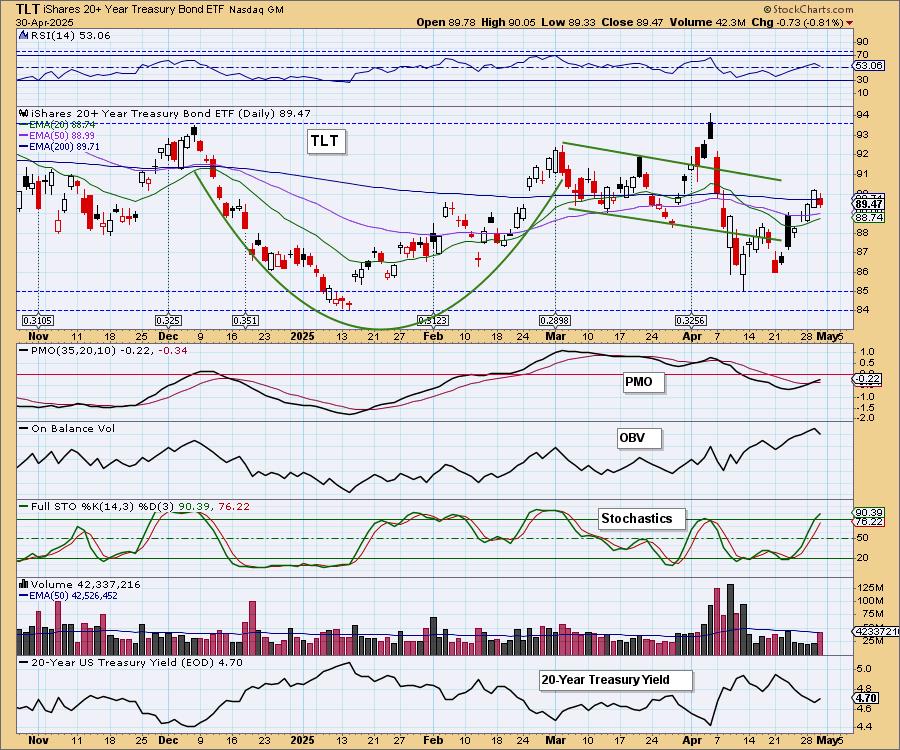
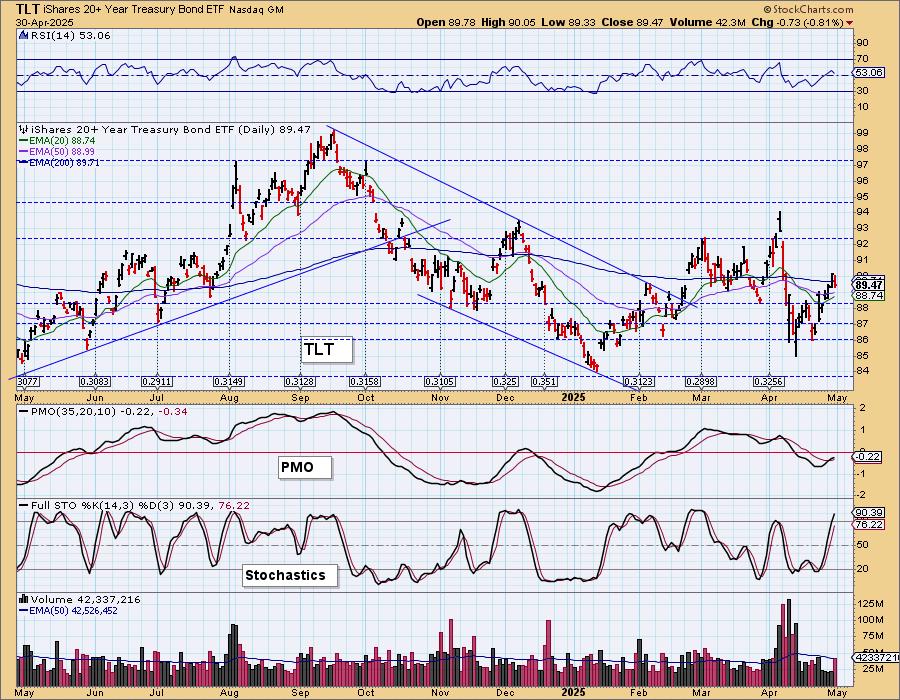
BONDS (TLT)
IT Trend Model: SELL as of 4/14/2025
LT Trend Model: SELL as of 12/13/2024
TLT Daily Chart: We like Bonds right now as yields still look very bearish. The technicals on the chart are favorable given the PMO Crossover BUY Signal and Stochastics above 80. We're looking for a move that would reach the upside target of the double bottom around 92.
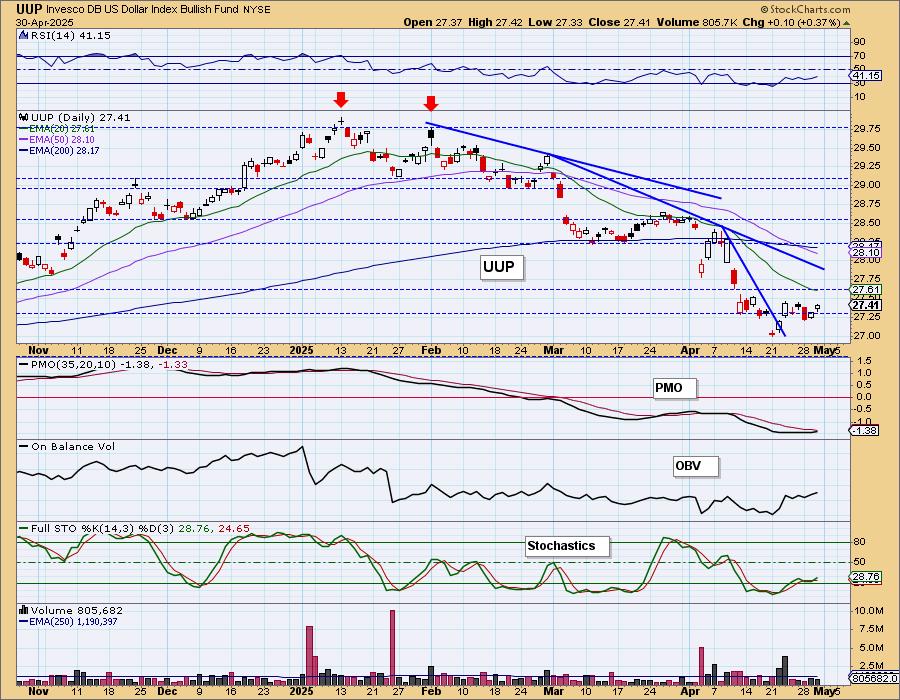
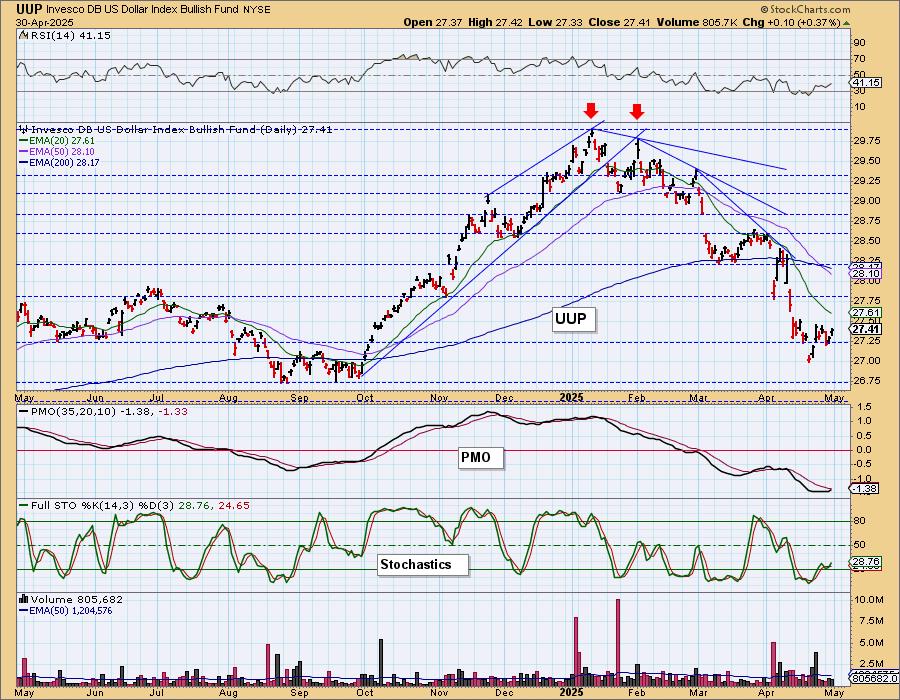
DOLLAR (UUP)
IT Trend Model: NEUTRAL as of 3/5/2025
LT Trend Model: SELL as of 4/25/2025
UUP Daily Chart: The Dollar does have a bottoming formation, but it doesn't seem primed for a good rally. The PMO is flat and unresponsive. Stochastics have turned up but are in deeply negative territory. We would look for more sideways movement with a possible melt up.
GOLD
IT Trend Model: BUY as of 1/10/2025
LT Trend Model: BUY as of 10/20/2023
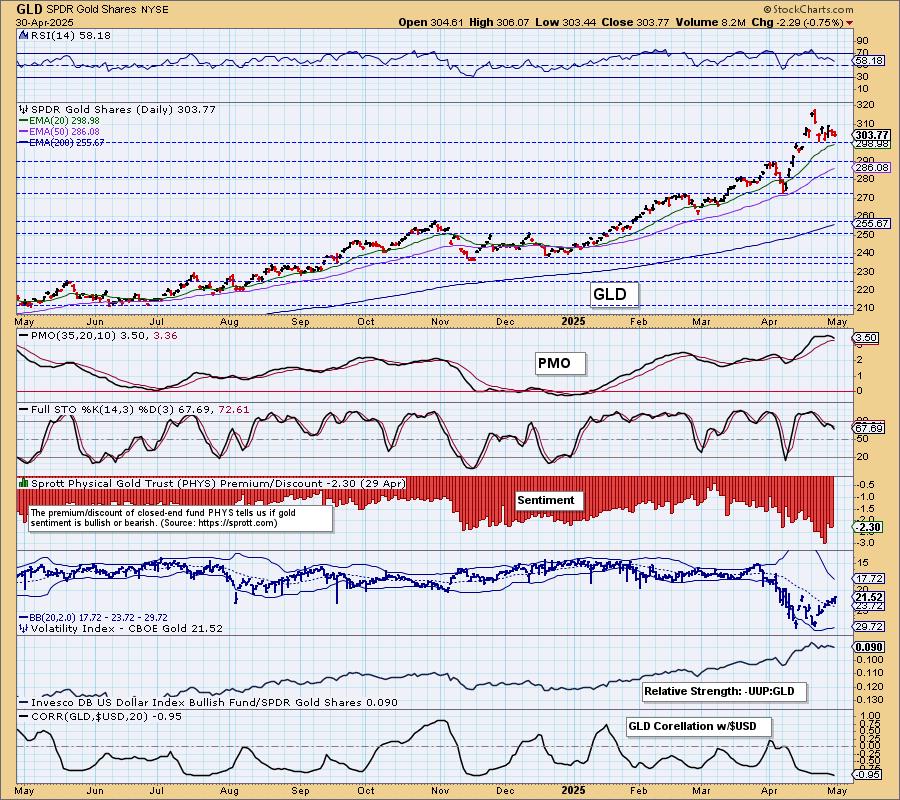
GLD Daily Chart: Gold is in pullback mode after its near vertical rally. It was due for this. The topping PMO suggests to us that there is probably more weakness ahead. Stochastics are also dropping. Gold isn't performing well against the Dollar so even if the Dollar consolidates, Gold is still likely to underperform.
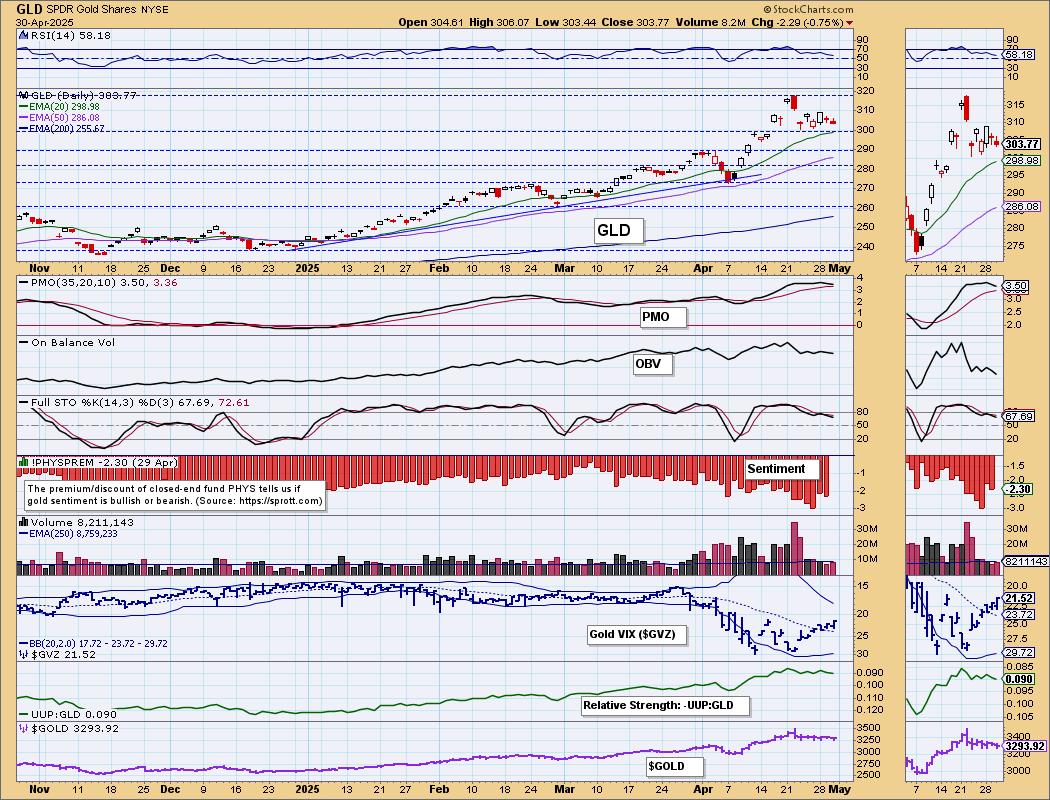
If the Dollar does rally here, it will be a big problem for Gold given the near perfect inverse correlation. The Dollar looks mushy so it may escape a big decline. We are looking for Gold to pull back further.
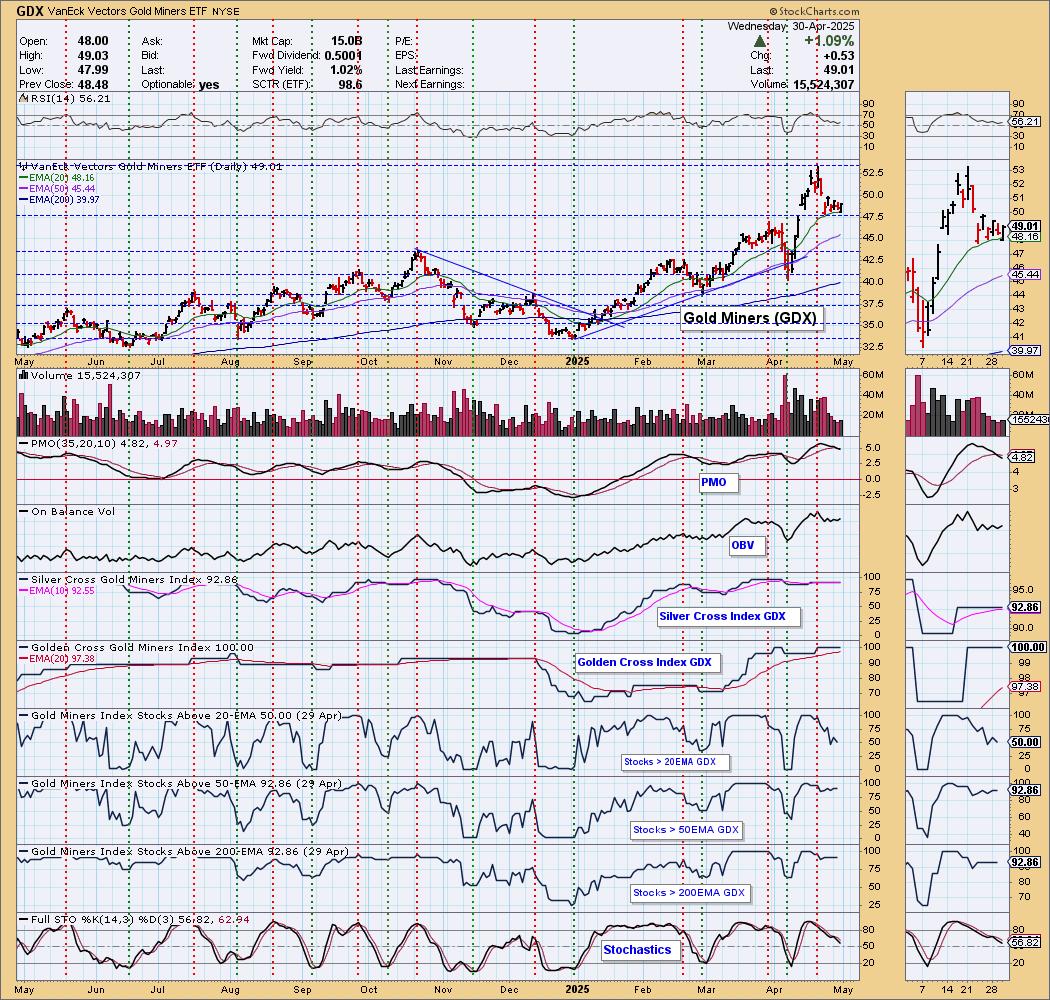
GOLD MINERS (GDX) Daily Chart: Gold Miners showed strength today. Gold was down -0.75% but GDX managed a rally of over 1%. This could mean that this support level will hold up. The PMO still looks very bearish so we aren't bullish on GDX at this point. Participation of stocks above their 20-day EMA has dropped quite a bit so there is still weakness here.
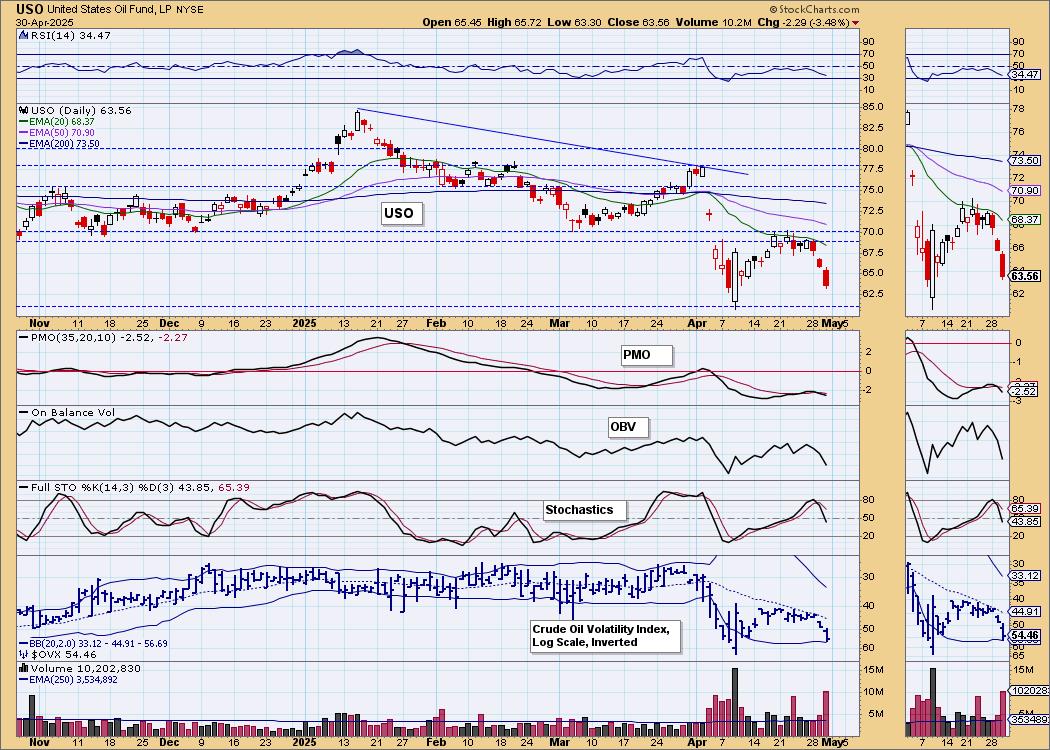
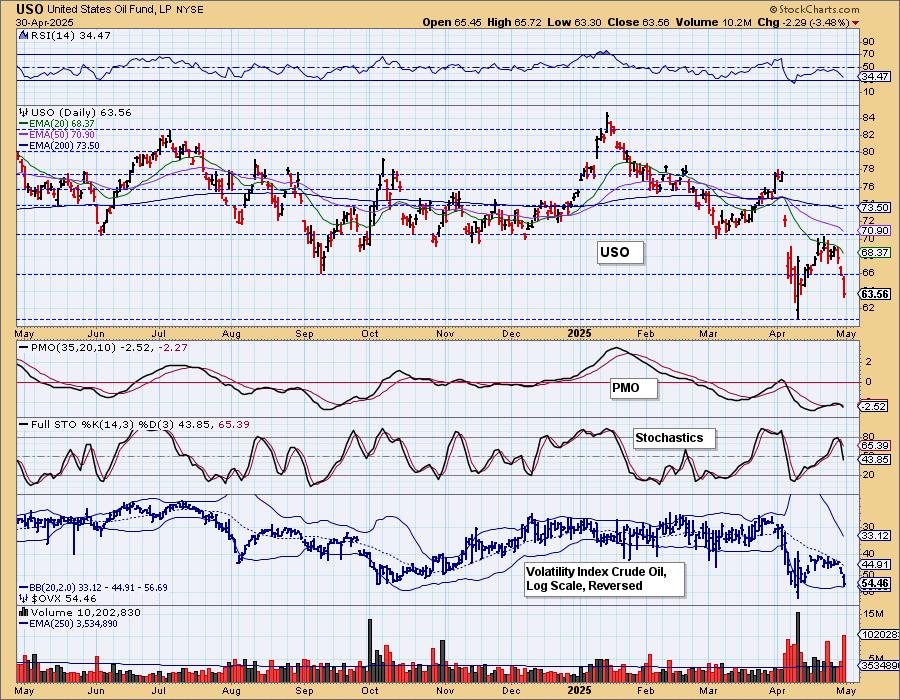
CRUDE OIL (USO)
IT Trend Model: NEUTRAL as of 2/27/2025
LT Trend Model: SELL as of 3/18/2025
USO Daily Chart: Crude Oil is falling out of bed after hitting overhead resistance. The PMO is very negative given its top and Crossover SELL Signal taking place well beneath the zero line. Stochastics have dropped into negative territory. Support is likely to be tested soon.
Good Luck & Good Trading!
Erin Swenlin and Carl Swenlin
Technical Analysis is a windsock, not a crystal ball. --Carl Swenlin
(c) Copyright 2025 DecisionPoint.com
Disclaimer: This blog is for educational purposes only and should not be construed as financial advice. The ideas and strategies should never be used without first assessing your own personal and financial situation, or without consulting a financial professional. Any opinions expressed herein are solely those of the author, and do not in any way represent the views or opinions of any other person or entity.
DecisionPoint is not a registered investment advisor. Investment and trading decisions are solely your responsibility. DecisionPoint newsletters, blogs or website materials should NOT be interpreted as a recommendation or solicitation to buy or sell any security or to take any specific action.
NOTE: The signal status reported herein is based upon mechanical trading model signals, specifically, the DecisionPoint Trend Model. They define the implied bias of the price index based upon moving average relationships, but they do not necessarily call for a specific action. They are information flags that should prompt chart review. Further, they do not call for continuous buying or selling during the life of the signal. For example, a BUY signal will probably (but not necessarily) return the best results if action is taken soon after the signal is generated. Additional opportunities for buying may be found as price zigzags higher, but the trader must look for optimum entry points. Conversely, exit points to preserve gains (or minimize losses) may be evident before the model mechanically closes the signal.
Helpful DecisionPoint Links:
DecisionPoint Alert Chart List
DecisionPoint Golden Cross/Silver Cross Index Chart List
DecisionPoint Sector Chart List
Price Momentum Oscillator (PMO)