
* * * * * * * * * * * * * *
Carl has decided to retire, and Erin will be joining him in retirement. We will continue publication until June 27th, and we will be contacting you soon via email on how this will affect your subscriptions.
* * * * * * * * * * * * * *
We noticed that IBB is beginning to wake up in the short term. We have a persistent rally off the April lows. The OBV is confirming the rally with its rising trend. Participation of stocks above their 20-day EMAs is very positive right now. There is still work to do however. We need much better participation of stocks above their 50/200-day EMAs. The Silver Cross Index had a Bullish Shift across its signal line but does remain at a very low 15%. We do see a small rising trend of outperformance against the SPY. EMAs are not configured the way we want right now, but if price can get above the 50-day EMA, it has a chance of setting up a Silver Cross of the 20/50-day EMAs.
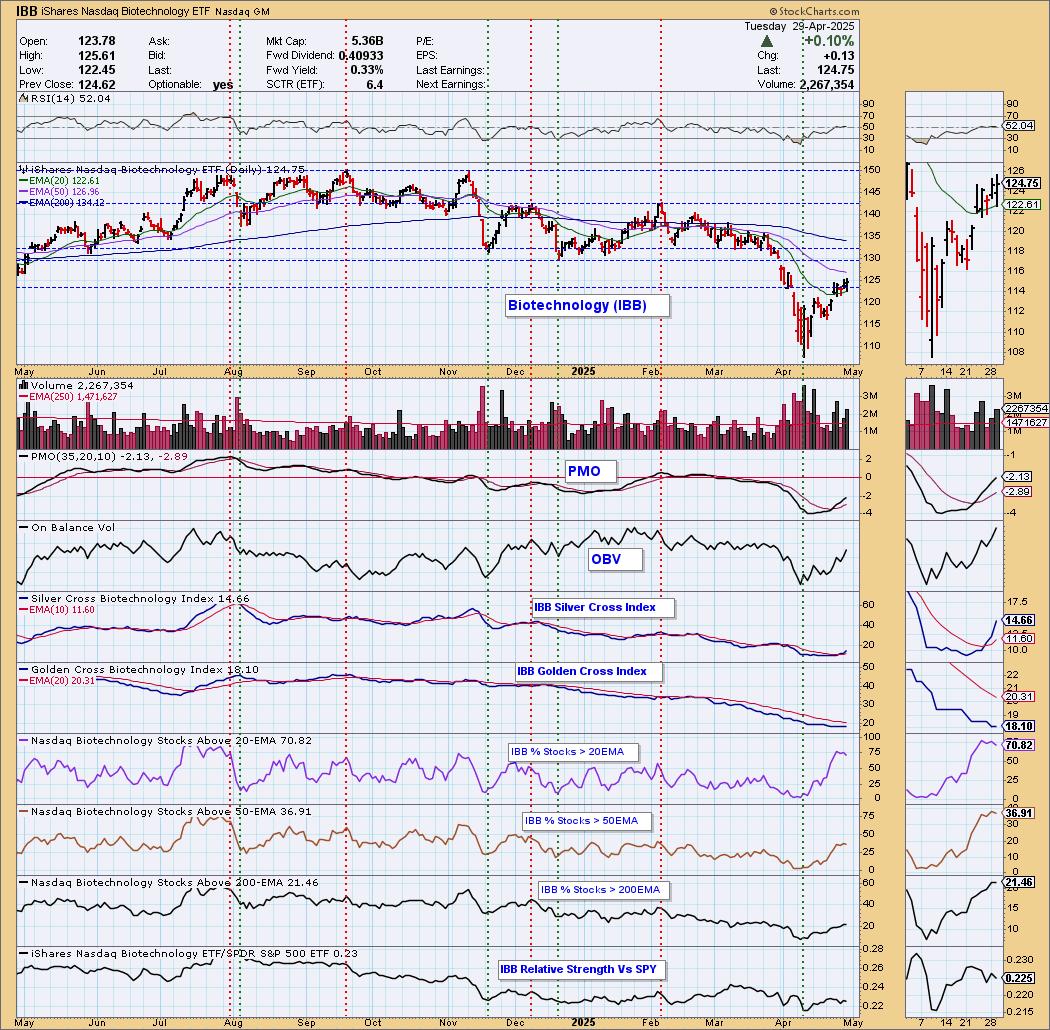
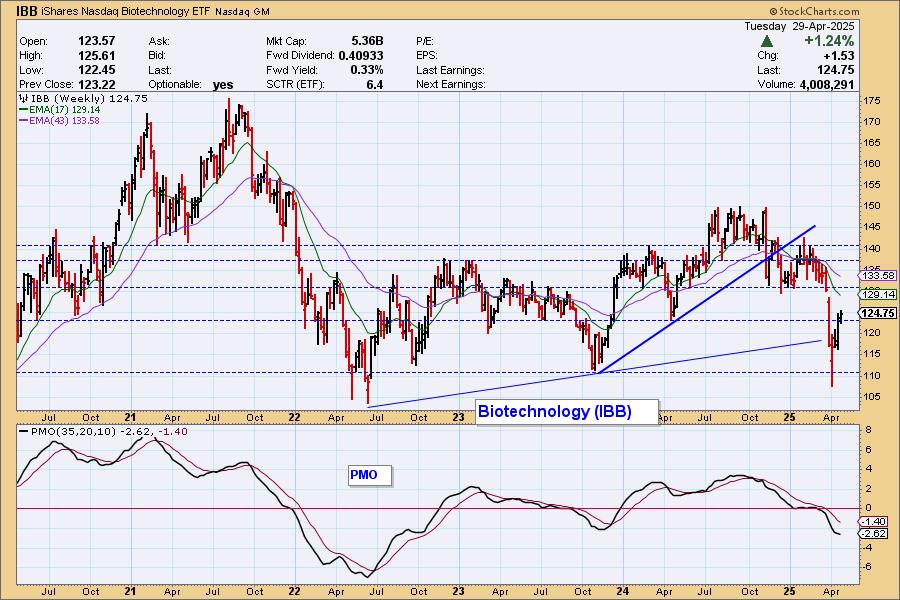
The weekly chart is not ripe yet given the weekly PMO is still in decline. It has decelerated though and this looks like a pretty good bounce off strong support at the 2024 low.
The DecisionPoint Alert Weekly Wrap presents an end-of-week assessment of the trend and condition of the Stock Market, the U.S. Dollar, Gold, Crude Oil, and Bonds. The DecisionPoint Alert daily report (Monday through Thursday) is abbreviated and gives updates on the Weekly Wrap assessments.
MARKET/INDUSTRY GROUP/SECTOR INDEXES
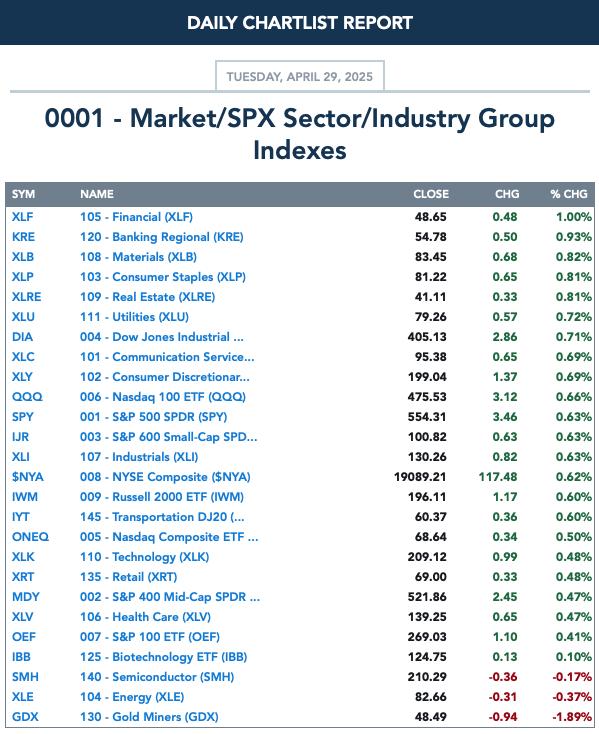
CLICK HERE for Carl's annotated Market Index, Sector, and Industry Group charts.
THE MARKET (S&P 500)
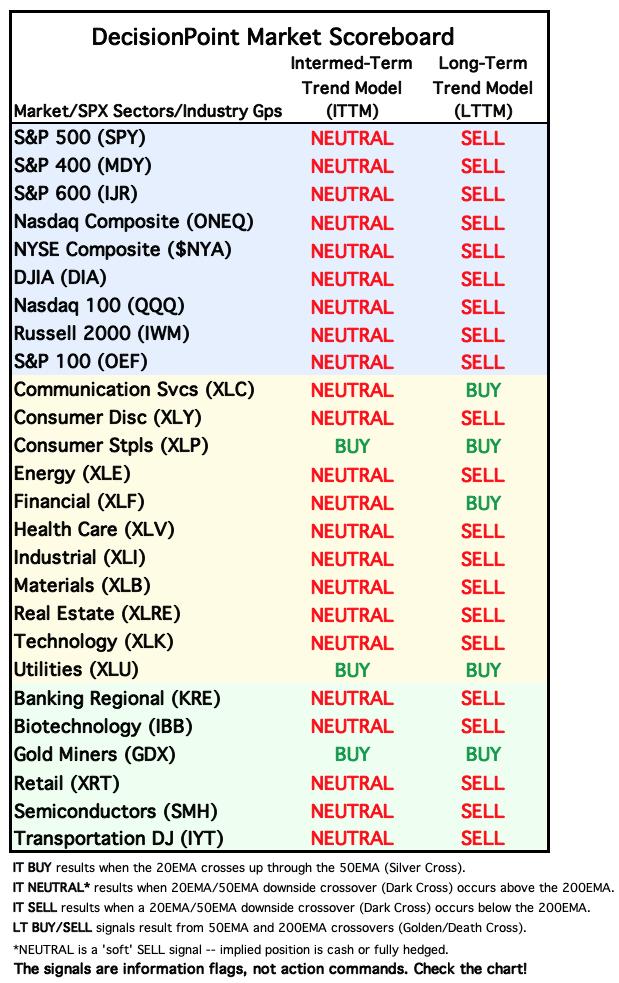
IT Trend Model: NEUTRAL as of 3/4/2025
LT Trend Model: SELL as of 4/16/2025
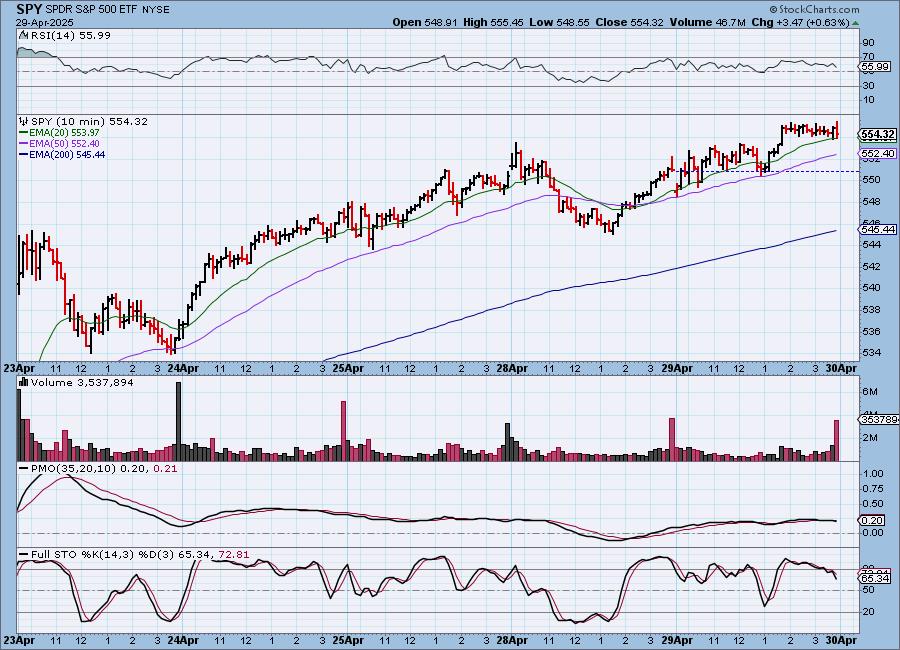
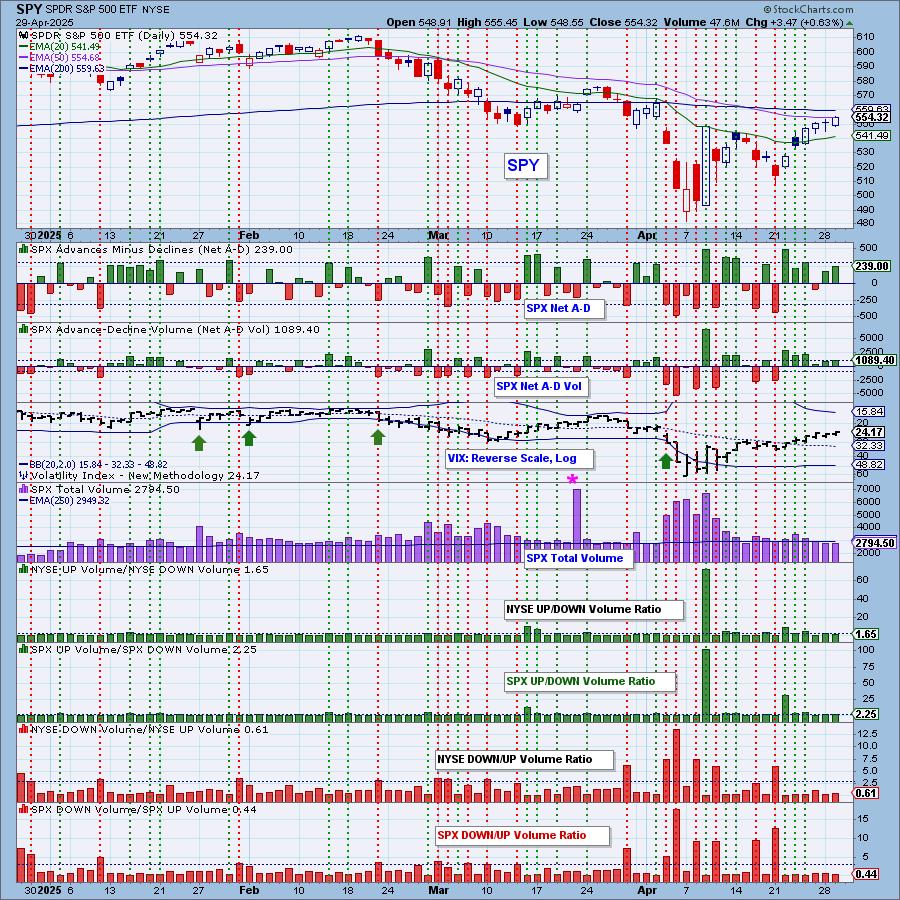
SPY 10-Minute Chart: The rising trend continued today. The late day consolidation did push the 10-minute PMO lower as well as Stochastics so we could see some rocky trading to start tomorrow.
SPY Daily Chart: This rally looks pretty good. The PMO is rising nicely and the RSI is positive again. The next line of resistance will be the 200-day EMA. A break above that would bode very well.
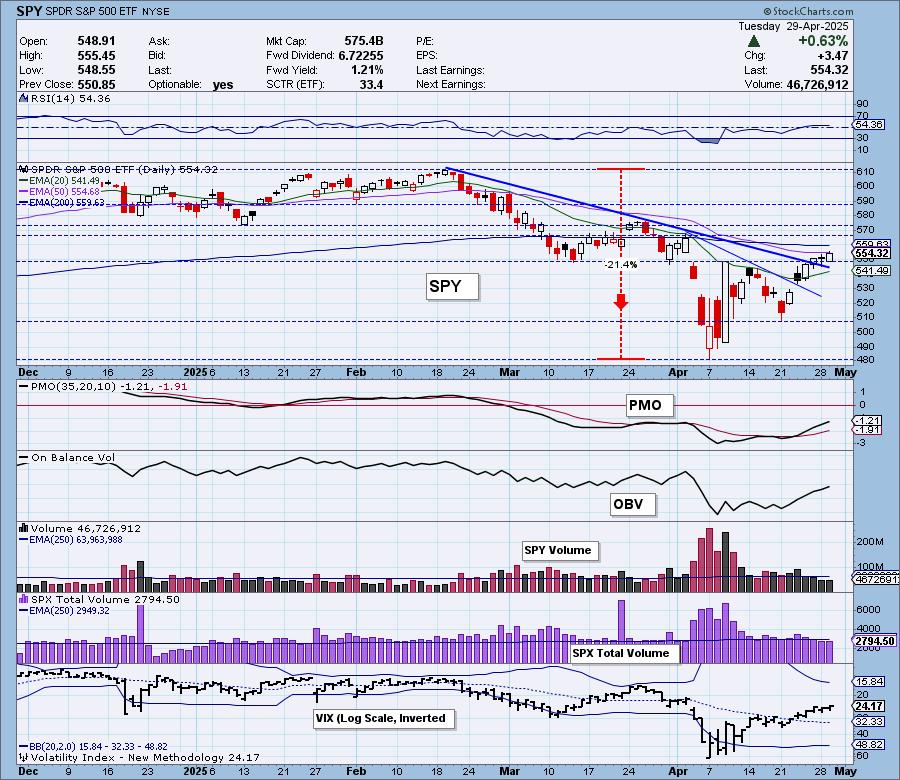
The VIX continues to rise on the inverted scale above its moving average so there is internal strength there. Stochastics also tell us there is short-term strength as they are above 80 right now.
S&P 500 New 52-Week Highs/Lows: We still see that we are at equilibrium for New Highs and New Lows. The High-Low Differential remains flat and unresponsive. A completely neutral chart.
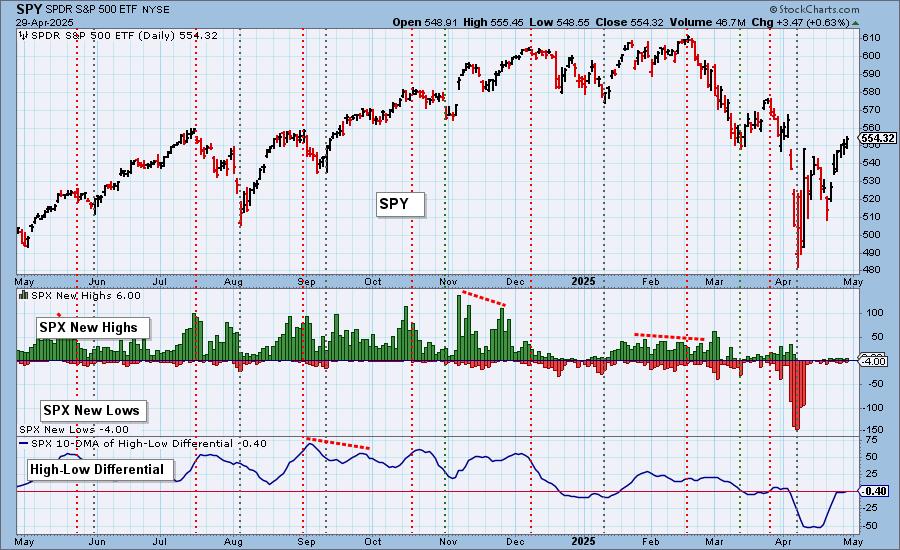
Climax* Analysis: There was only one climax reading on the four relevant indicators, so it is not a climax day.
*A climax is a one-day event when market action generates very high readings in, primarily, breadth and volume indicators. We also include the VIX, watching for it to penetrate outside the Bollinger Band envelope. The vertical dotted lines mark climax days -- red for downside climaxes, and green for upside. Climaxes are at their core exhaustion events; however, at price pivots they may be initiating a change of trend.
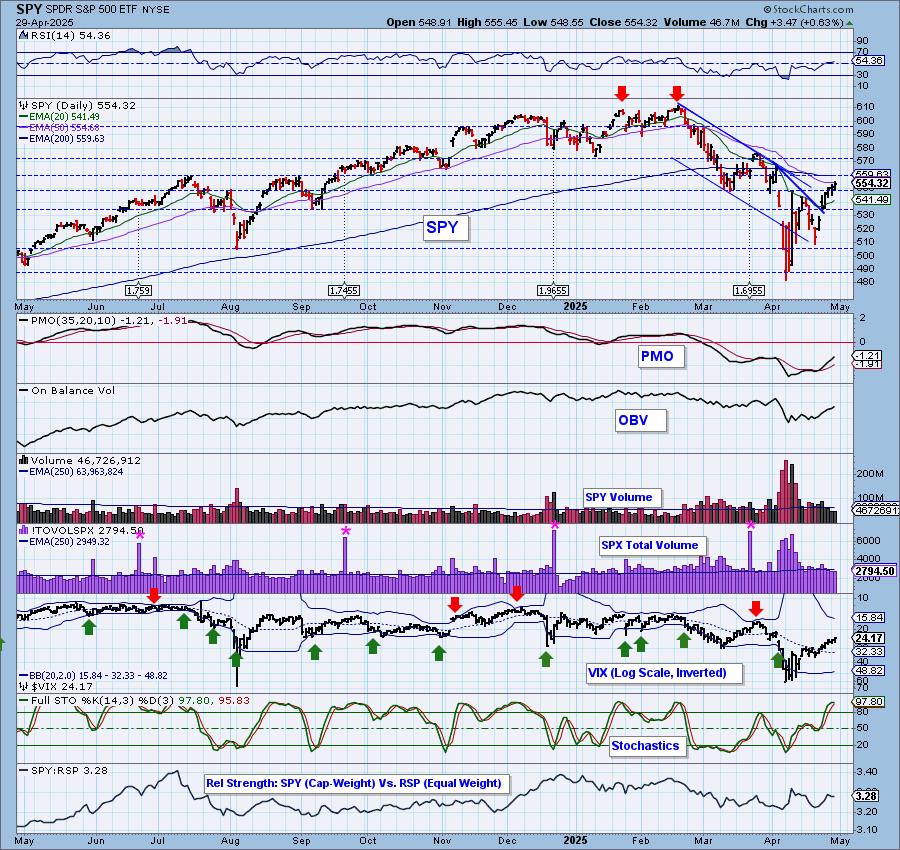
Short-Term Market Indicators: The short-term market trend is UP and the condition is OVERBOUGHT.
Swenlin Trading Oscillators (STOs) continue to rise bullishly but as we noted yesterday, they are definitely overbought. If we're going to get a downturn, this would be the time. Participation inched higher and we continue to see more rising PMOs which could keep price elevated.
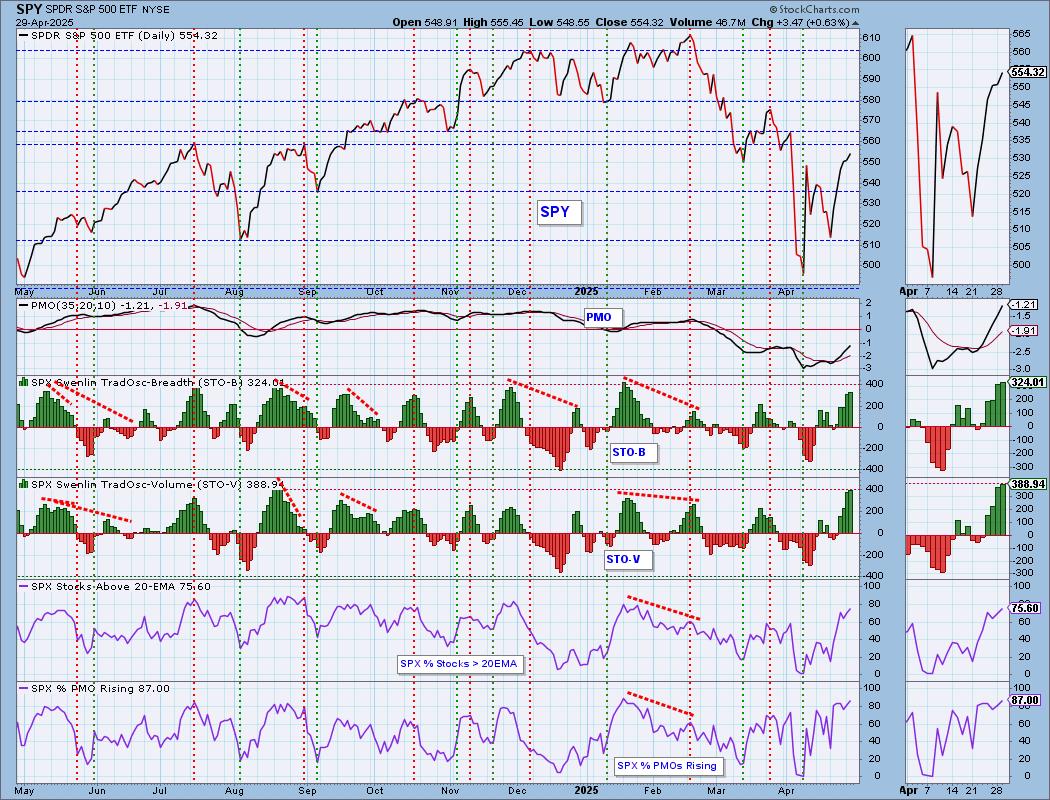
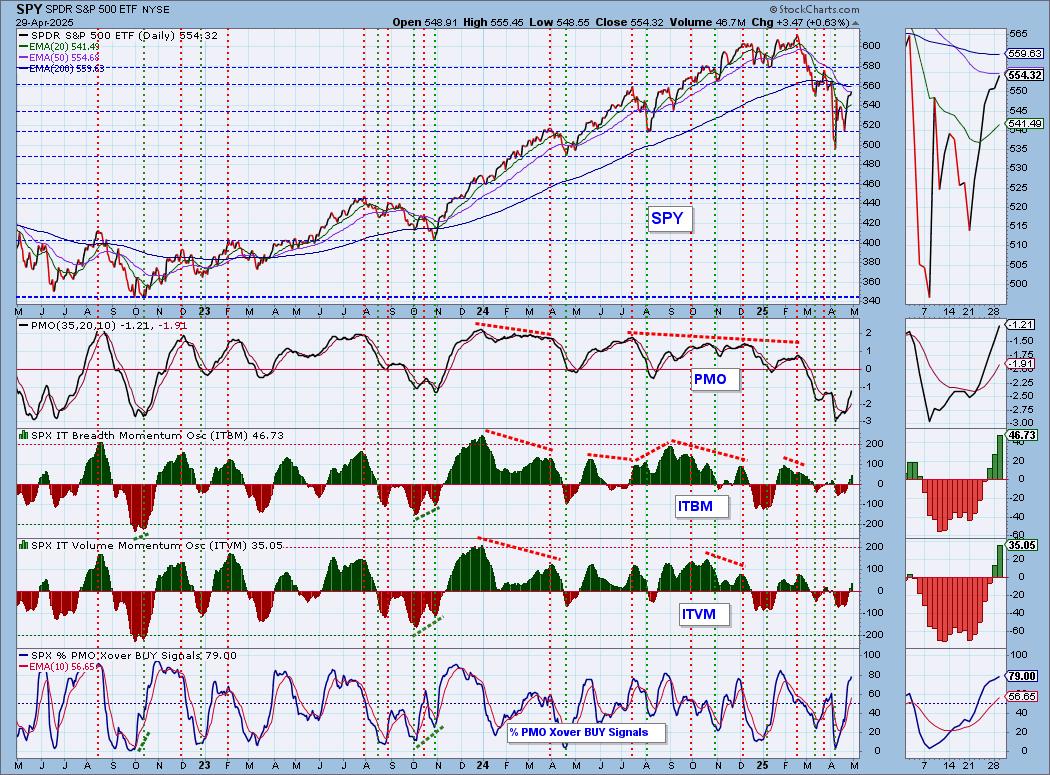
Intermediate-Term Market Indicators: The intermediate-term market trend is DOWN and the condition is NEUTRAL.
The ITBM and ITVM continue to expand upward which gives this rally some credibility. We have a large number of PMO BUY Signals within the index.
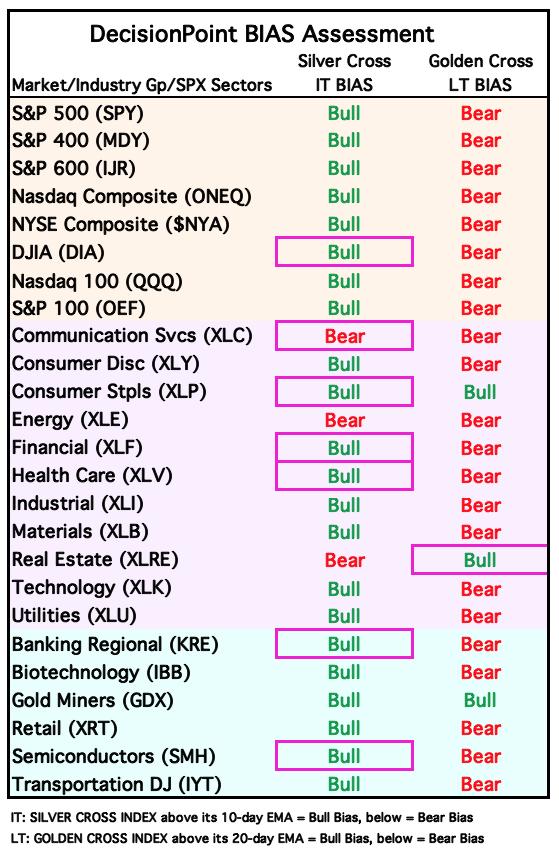
PARTICIPATION CHART (S&P 500): The following chart objectively shows the depth and trend of participation for the SPX in two time frames.
- Intermediate-Term - the Silver Cross Index (SCI) shows the percentage of SPX stocks on IT Trend Model BUY signals (20-EMA > 50-EMA). The opposite of the Silver Cross is a "Dark Cross" -- those stocks are, at the very least, in a correction.
- Long-Term - the Golden Cross Index (GCI) shows the percentage of SPX stocks on LT Trend Model BUY signals (50-EMA > 200-EMA). The opposite of a Golden Cross is the "Death Cross" -- those stocks are in a bear market.
The market bias is BULLISH in the intermediate term.
The market bias is BEARISH in the long term.
The Silver Cross Index looks very bullish on its rise and given we have higher percentages of stocks above their 20/50-day EMAs, it should continue to advance. It is above its moving average so the IT Bias is read as BULLISH. The Golden Cross Index has decelerated and is turning back up. It still has quite a bit of distance to cover before it can get above its signal line. For now it is below the signal line so the LT Bias is BEARISH.
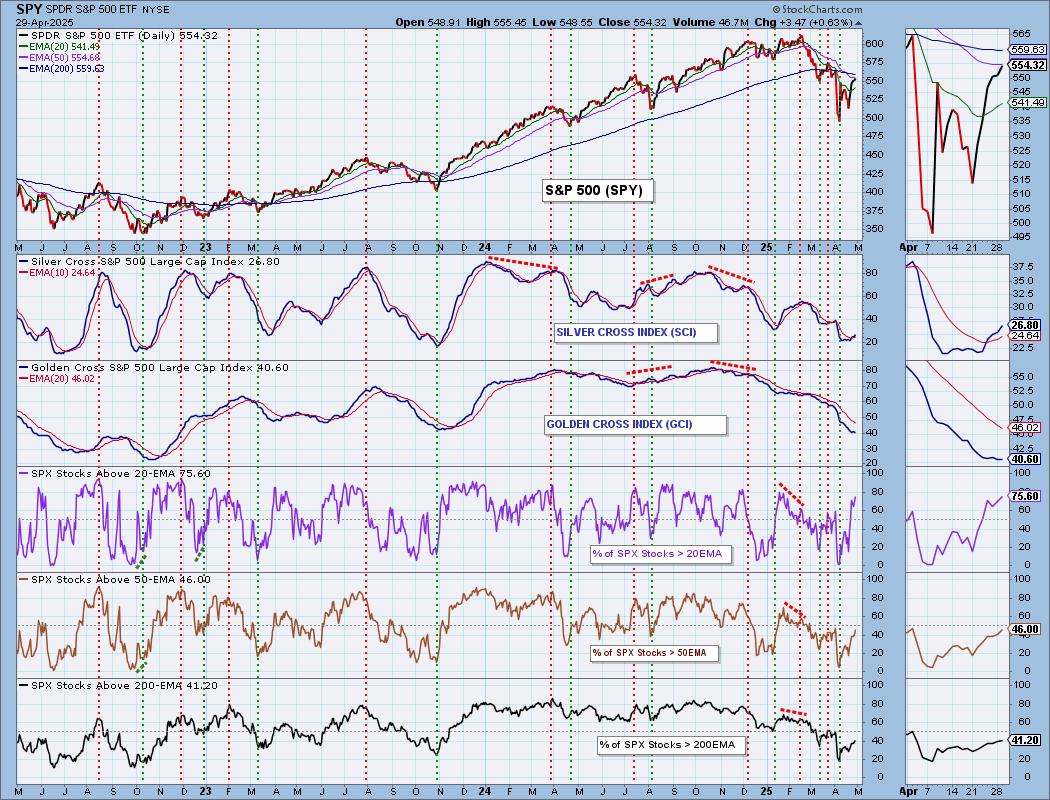
BIAS Assessment: The following table expresses the current BIAS of various price indexes based upon the relationship of the Silver Cross Index to its 10-day EMA (intermediate-term), and of the Golden Cross Index to its 20-day EMA (long-term). When the Index is above the EMA it is bullish, and it is bearish when the Index is below the EMA. The BIAS does not imply that any particular action should be taken. It is information to be used in the decision process.
The items with highlighted borders indicate that the BIAS changed today.
*****************************************************************************************************
CONCLUSION: We like what we are seeing on the Bias Table above, more "Bull" designations. We now have a large number of stocks with rising PMOs and PMO BUY Signals. The STOs are rising. All of this is short-term bullish and suggests this rally could continue on despite tariff worries. The IT looks fairly positive given the ITBM and ITVM are rising, but the Silver Cross Index and Golden Cross Index are still reading well below our bullish 50% threshold. There is work to do in the intermediate term. For now we think that this rally will inch ahead given positive PMO studies. So far earnings are coming in fairly positive and that could help things along too.
Erin is 10% long, 0% short. (This is intended as information, not a recommendation.)
*****************************************************************************************************
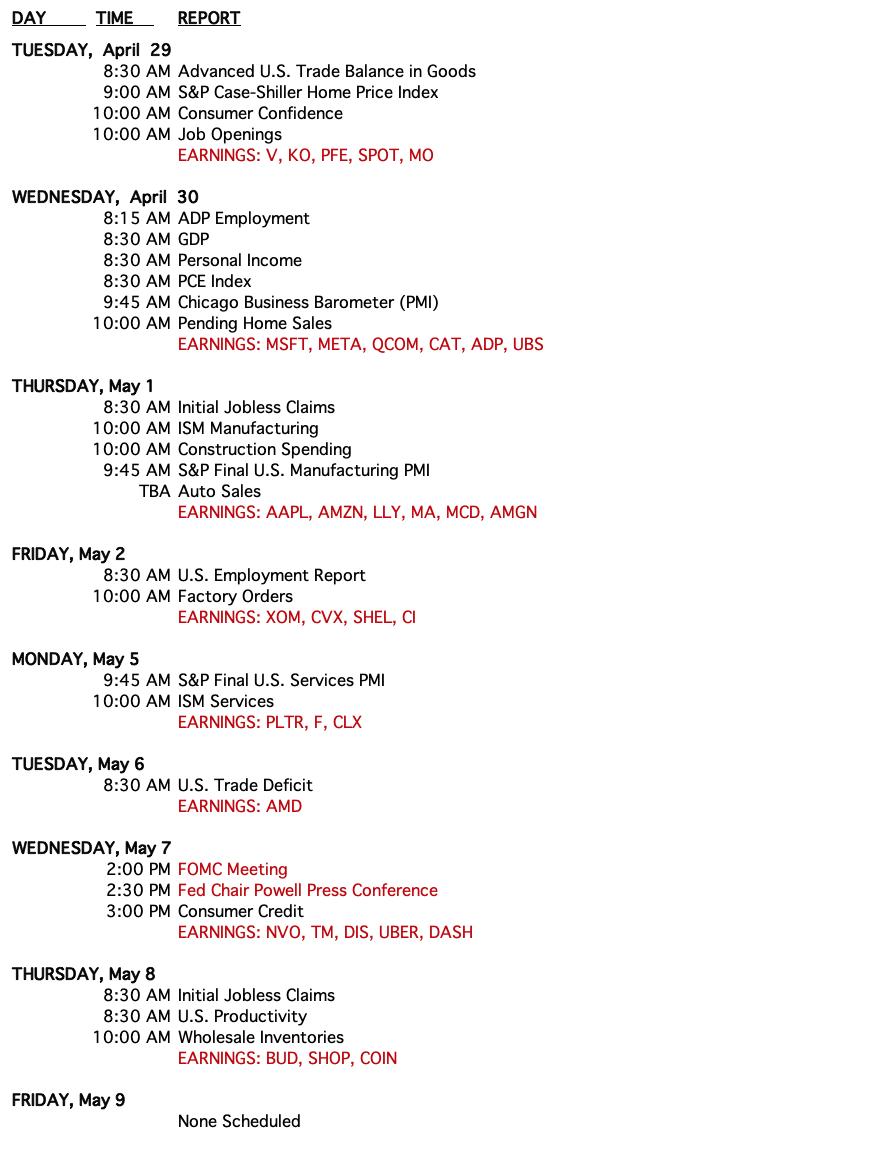
CALENDAR
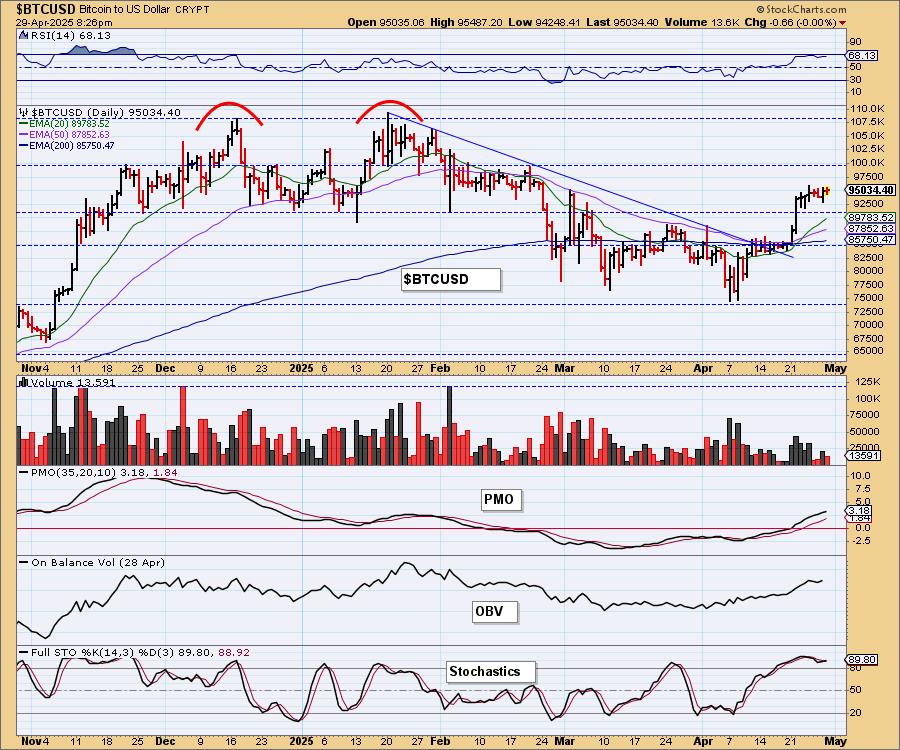
BITCOIN
Yesterday's comments still apply:
"Bitcoin had a great breakout from its declining trend. The rally got a bit heated and now it is consolidating the move. It appears we're getting a bull flag. The flag is trending up and those flags don't generally work out but we like the indicators. The RSI is positive and not overbought yet and the PMO is rising bullishly. Stochastics are also above 80. We are looking for more upside after this period of consolidation."
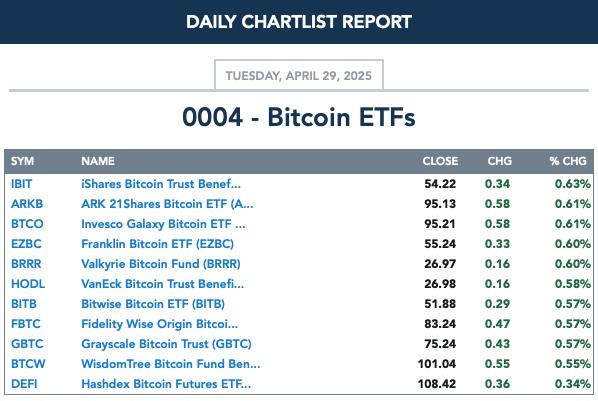
BITCOIN ETFs
INTEREST RATES
The latest support level is now being compromised by some yields. There is more downside available as there is another line of support. They do look bearish so we are looking for them to fall further.
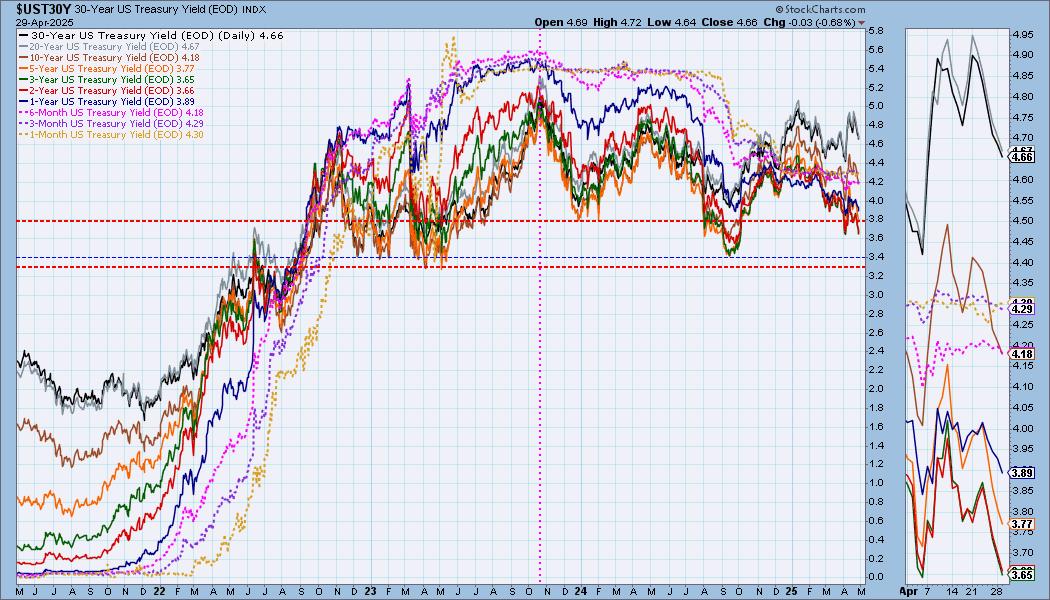
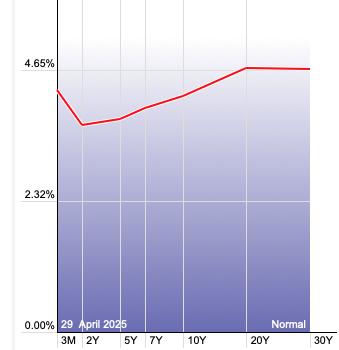
The Yield Curve Chart from StockCharts.com shows us the inversions taking place. The red line should move higher from left to right. Inversions are occurring where it moves downward.
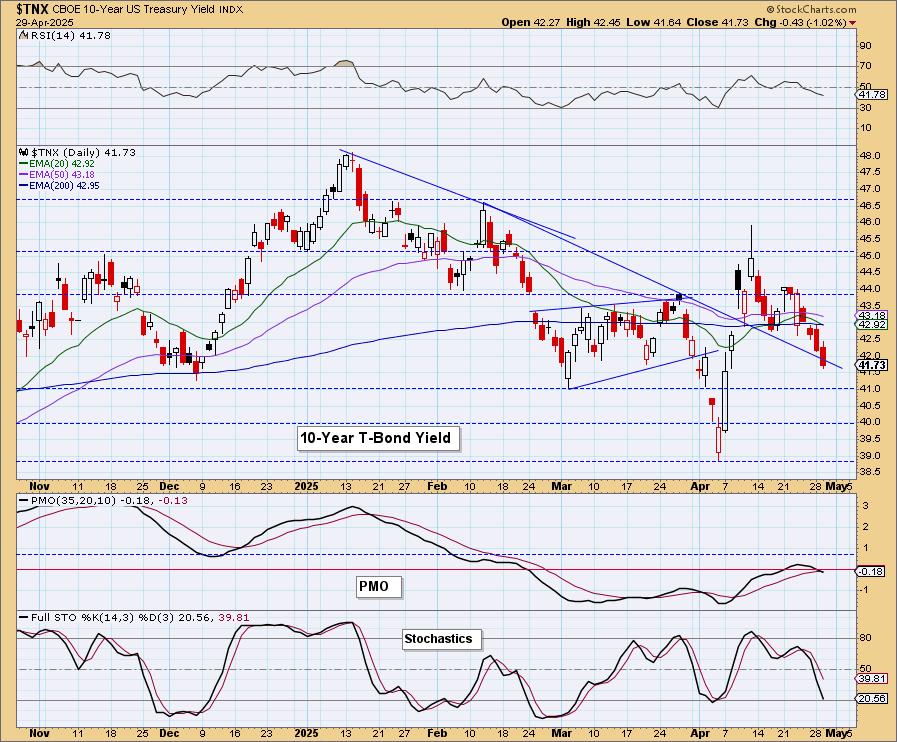
10-YEAR T-BOND YIELD
The flag on this flagpole is getting extended and looking at the PMO's new Crossover SELL Signal, we don't think we'll get an upside reversal yet. Stochastics also look very bearish. $TNX is now back in the prior declining trend.
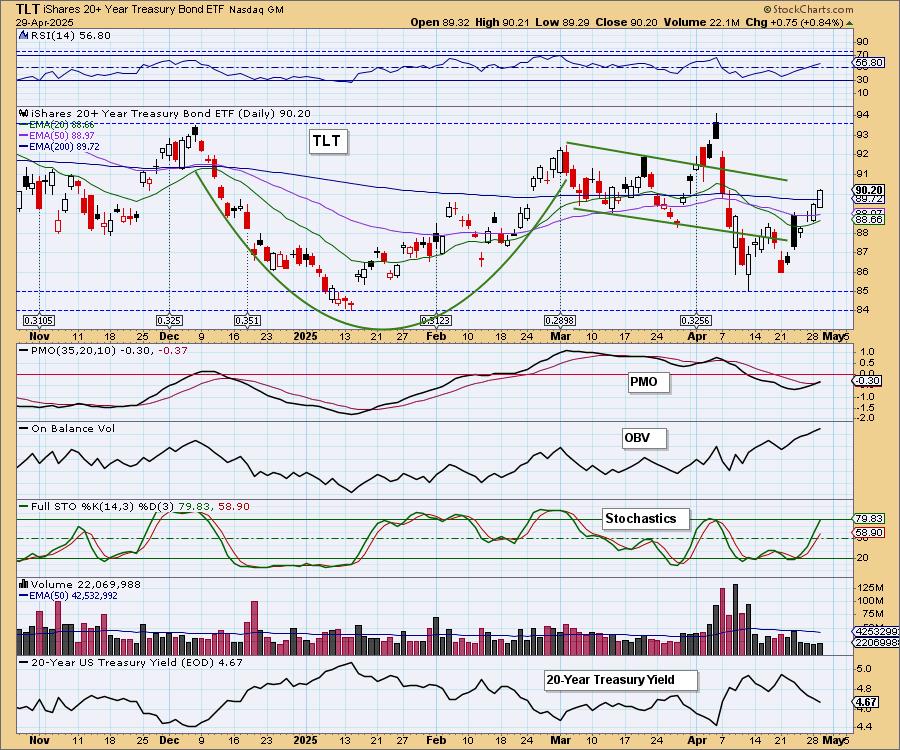
BONDS (TLT)
IT Trend Model: SELL as of 4/14/2025
LT Trend Model: SELL as of 12/13/2024
TLT Daily Chart: The upside target of the bullish double bottom is about to be met. That may be where Bonds finally run into trouble. However, at this point, price has broken back above the 200-day EMA and the PMO is on a new Crossover BUY Signal. Stochastics are rising nicely so we would expect to see more upside here.
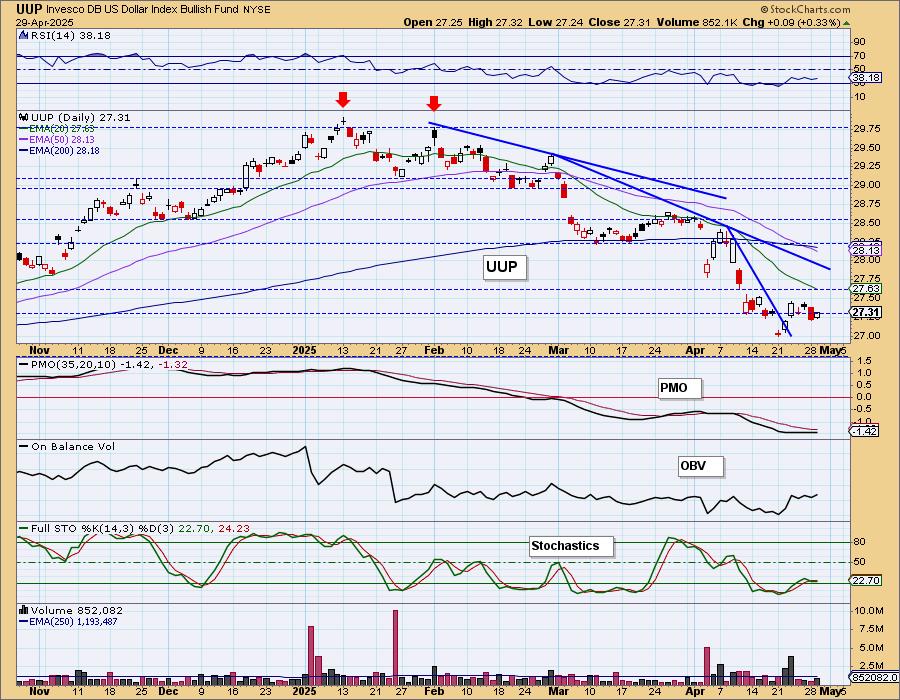
DOLLAR (UUP)
IT Trend Model: NEUTRAL as of 3/5/2025
LT Trend Model: SELL as of 4/25/2025
UUP Daily Chart: The Dollar tried to rally but it is already fading. The PMO is no help right now as it is very flat. When it is flat below the zero line, it is a sign of pure weakness. Stochastics did pause the decline, but overall we don't expect much out of the Dollar. It hasn't even come close to breaking the declining trend out of the late February high.
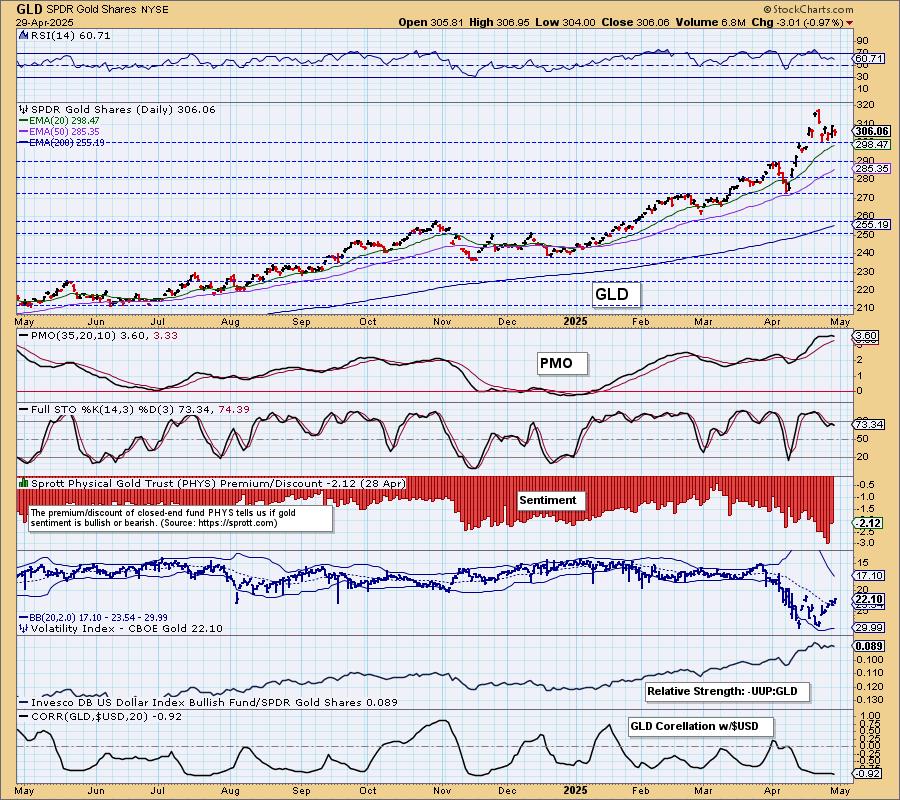
GOLD
IT Trend Model: BUY as of 1/10/2025
LT Trend Model: BUY as of 10/20/2023
GLD Daily Chart: Gold is digesting the near vertical rally. It is now forming a bull flag so we don't expect it to correct here. If anything we would look for consolidation with a possible melt lower given the topping PMO. Stochastics are falling, but don't look that negative yet.
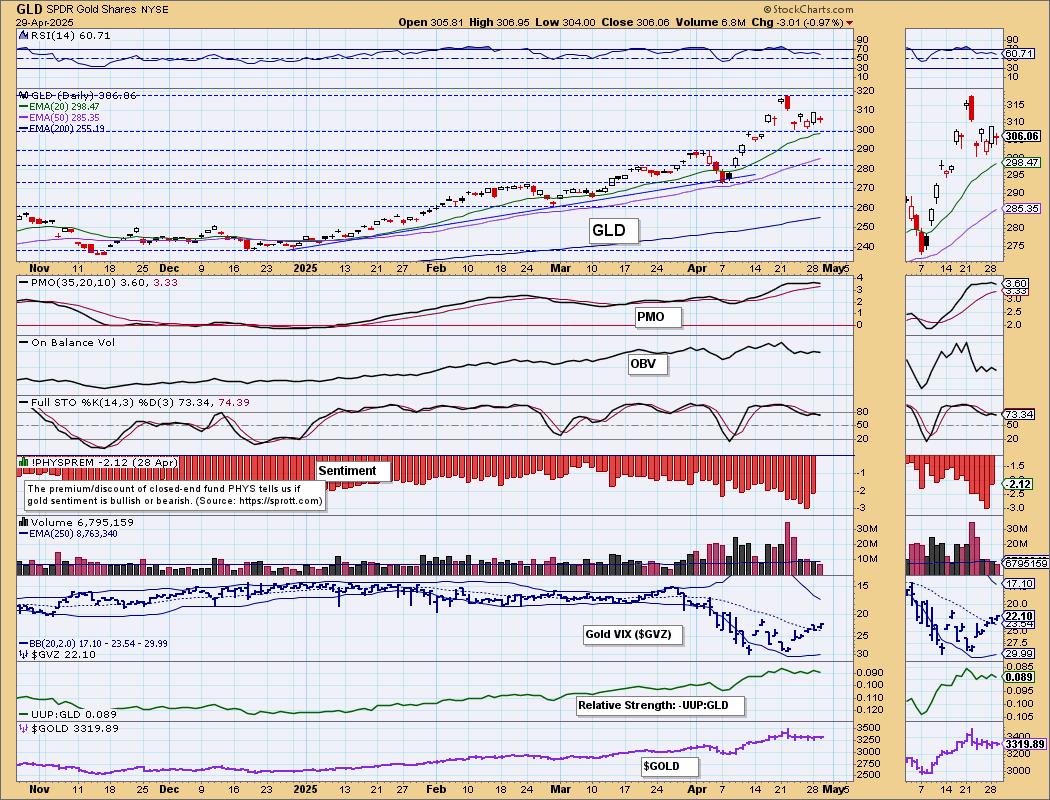
Discounts are very elevated, but did pare back yesterday. This tells us that investors are actually bearish on Gold right now. This could keep Gold down a bit longer.
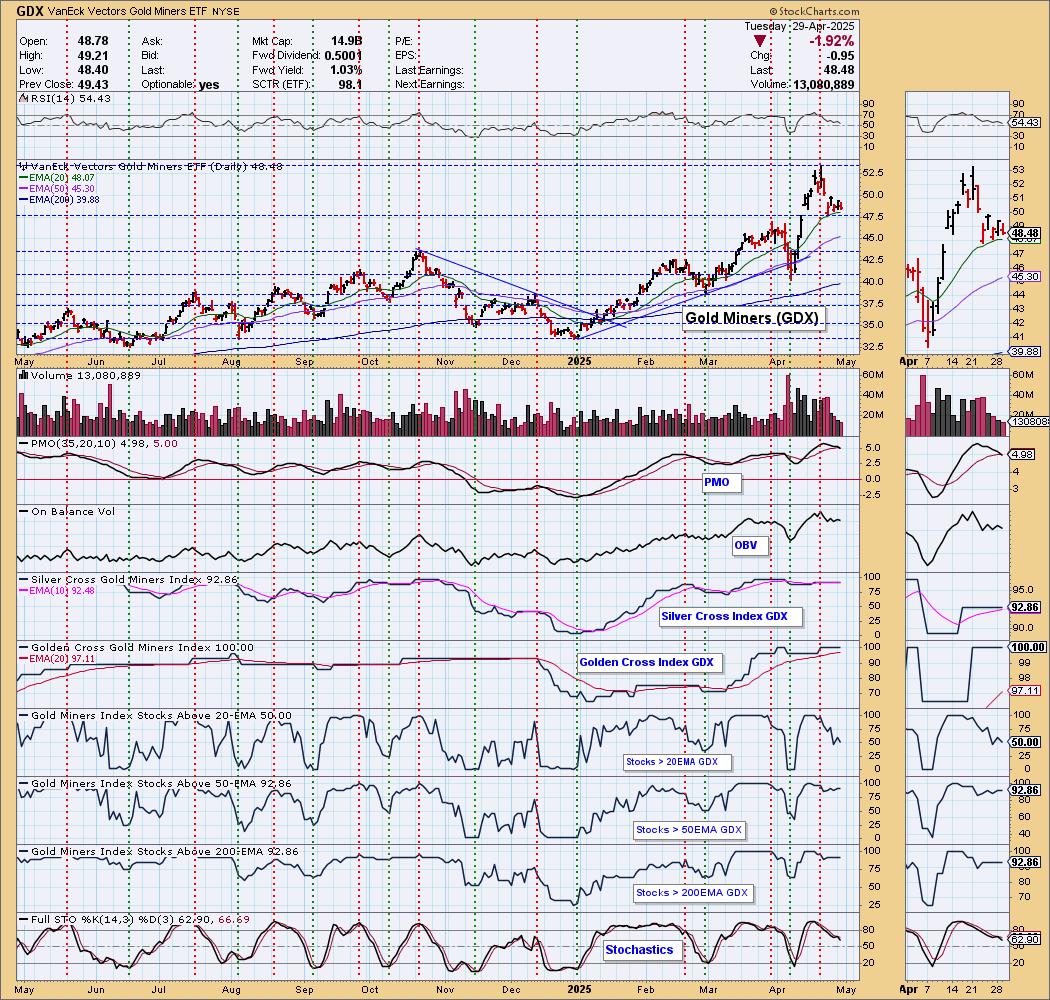
GOLD MINERS (GDX) Daily Chart: Support held today despite a sizable loss. This looks like sturdy support, but the PMO just triggered a Crossover SELL Signal so it may not be a strong as it looks. Gold is seeing bearish sentiment and could continue to experience weakness and that will be put downside pressure on Gold Miners. We expect this line of support will be broken as we did lose a lot of stocks above their 20-day EMAs.
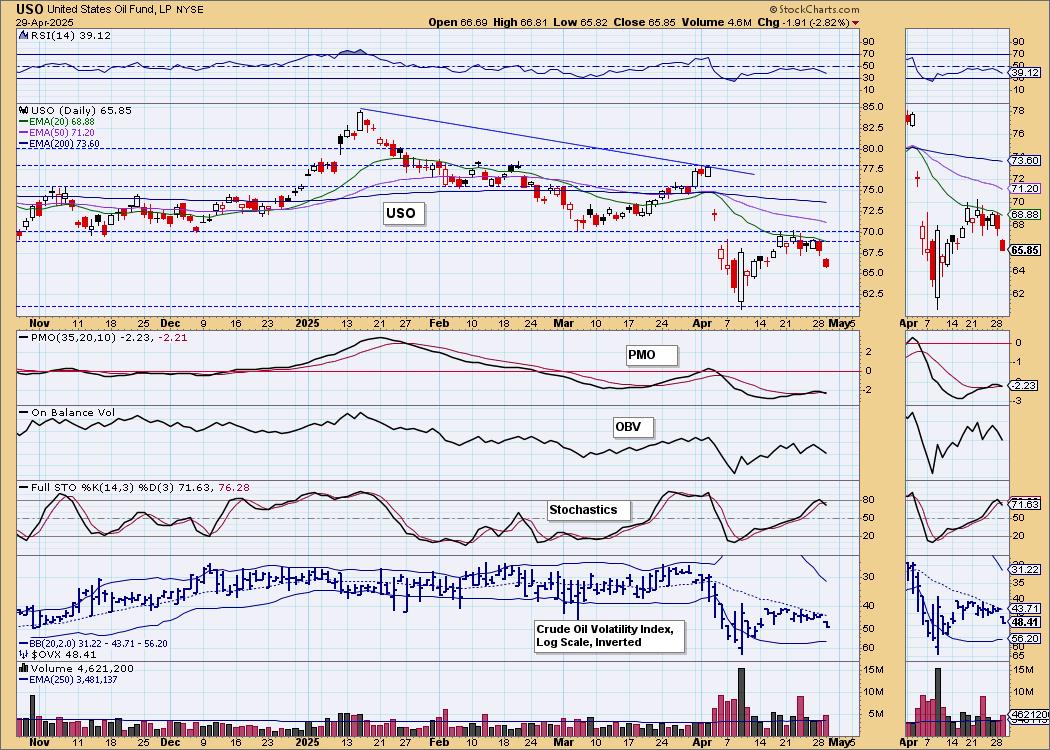
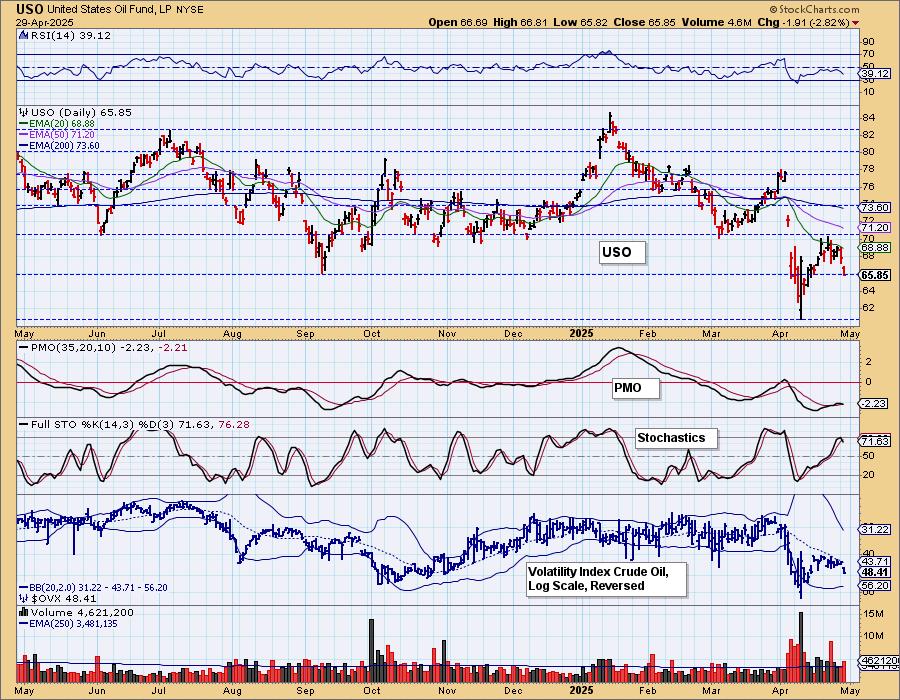
CRUDE OIL (USO)
IT Trend Model: NEUTRAL as of 2/27/2025
LT Trend Model: SELL as of 3/18/2025
USO Daily Chart: As we expected, the bull flag on Crude Oil did not execute. The PMO has topped well beneath the zero line and triggered a Crossover SELL Signal today. Stochastics have also topped. We are looking for price to get back down to the April low.
Good Luck & Good Trading!
Erin Swenlin and Carl Swenlin
Technical Analysis is a windsock, not a crystal ball. --Carl Swenlin
(c) Copyright 2025 DecisionPoint.com
Disclaimer: This blog is for educational purposes only and should not be construed as financial advice. The ideas and strategies should never be used without first assessing your own personal and financial situation, or without consulting a financial professional. Any opinions expressed herein are solely those of the author, and do not in any way represent the views or opinions of any other person or entity.
DecisionPoint is not a registered investment advisor. Investment and trading decisions are solely your responsibility. DecisionPoint newsletters, blogs or website materials should NOT be interpreted as a recommendation or solicitation to buy or sell any security or to take any specific action.
NOTE: The signal status reported herein is based upon mechanical trading model signals, specifically, the DecisionPoint Trend Model. They define the implied bias of the price index based upon moving average relationships, but they do not necessarily call for a specific action. They are information flags that should prompt chart review. Further, they do not call for continuous buying or selling during the life of the signal. For example, a BUY signal will probably (but not necessarily) return the best results if action is taken soon after the signal is generated. Additional opportunities for buying may be found as price zigzags higher, but the trader must look for optimum entry points. Conversely, exit points to preserve gains (or minimize losses) may be evident before the model mechanically closes the signal.
Helpful DecisionPoint Links:
DecisionPoint Alert Chart List
DecisionPoint Golden Cross/Silver Cross Index Chart List
DecisionPoint Sector Chart List
Price Momentum Oscillator (PMO)