
* * * * * * * * * * * * * *
Carl has decided to retire, and Erin will be joining him in retirement. We will continue publication until June 27th, and we will be contacting you soon via email as to how this will affect your subscriptions.
* * * * * * * * * * * * * *
The late Yale Hirsch of Stock Trader's Almanac identified the next six months as being a period of unfavorable seasonality. This negative environment doesn't necessarily start on May 1, but the market is vulnerable nevertheless.
__________
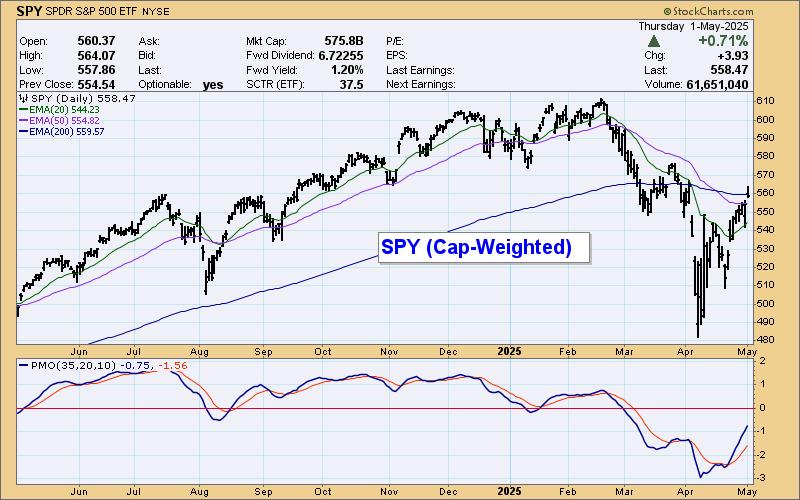
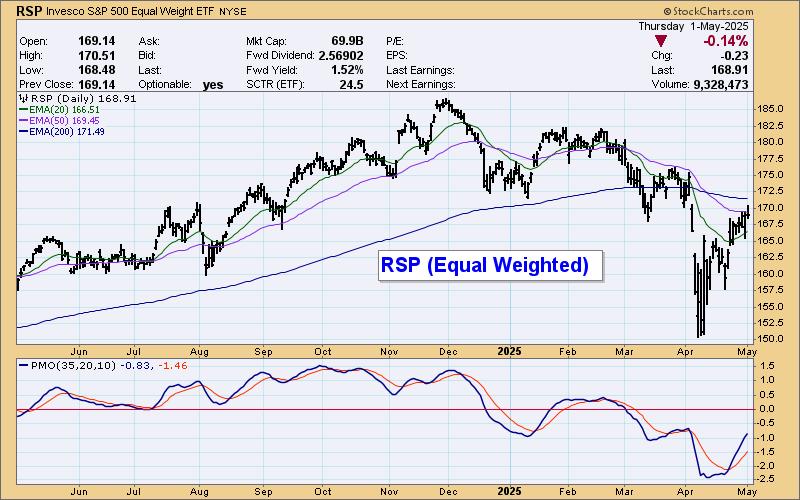
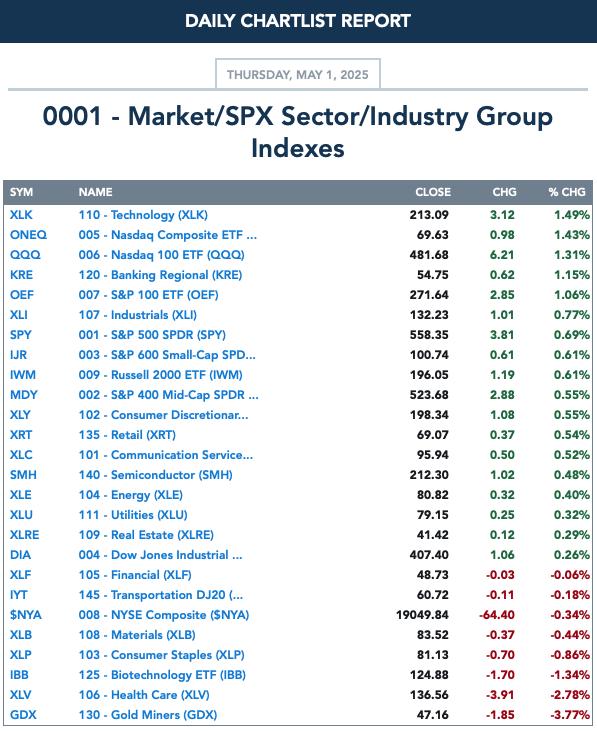
Today's rally was, as usual, primarily in big-cap tech stocks. When we compare the cap-weighted SPY ETF to the equal weighted RSP ETF, we can see that equal weighted index slightly down, while the cap-weighted index was up +0.72%. The difference was much more profound earlier in the day. It should also be noted that half the Dow 30 stocks were down today. Participation of stocks above their 20-day EMA also dropped on the rally.
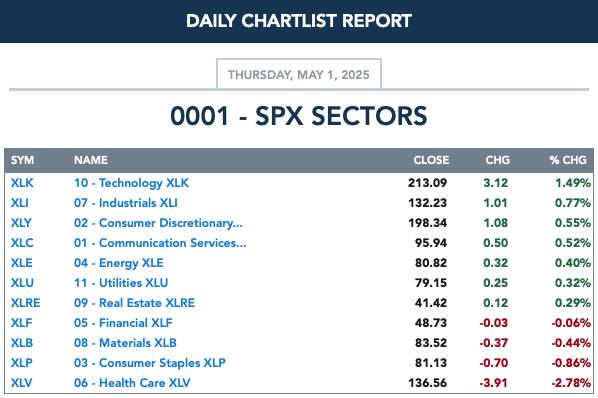
While seven of the eleven S&P 500 Index Sectors were up, Technology was way out in front.
The DecisionPoint Alert Weekly Wrap presents an end-of-week assessment of the trend and condition of the Stock Market, the U.S. Dollar, Gold, Crude Oil, and Bonds. The DecisionPoint Alert daily report (Monday through Thursday) is abbreviated and gives updates on the Weekly Wrap assessments.
MARKET/INDUSTRY GROUP/SECTOR INDEXES
CLICK HERE for Carl's annotated Market Index, Sector, and Industry Group charts.
THE MARKET (S&P 500)
IT Trend Model: NEUTRAL as of 3/4/2025
LT Trend Model: SELL as of 4/16/2025
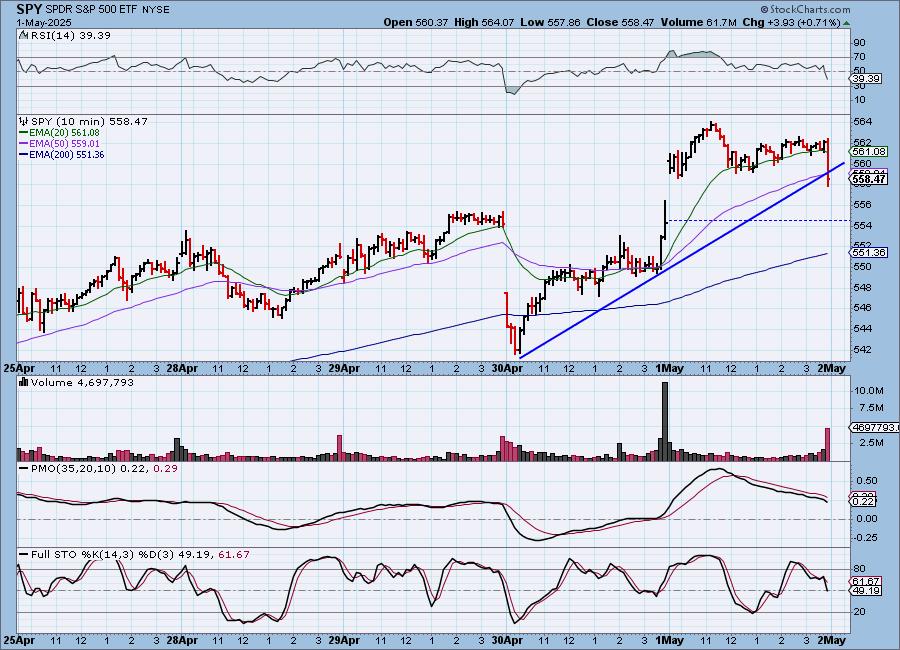
SPY 10-Minute Chart: We saw a nice gap up for the SPY, but that was followed by consolidation. The big problem is the loss of the rising trend. The 10-minute PMO is picking up speed to the downside so it does appear that we will see a decline tomorrow.
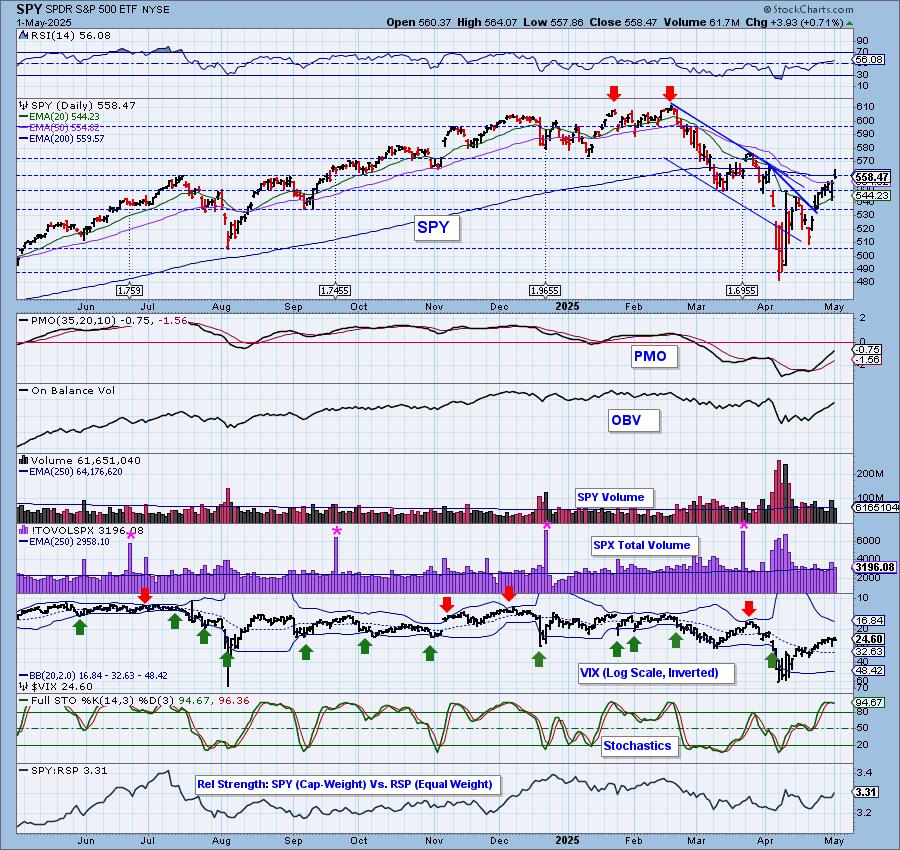
SPY Daily Chart: The rising trend on the daily chart persists. We did see a bearish filled black candlestick which also implies we'll see a decline tomorrow. The PMO and RSI are still positive so a decline could be short-lived.
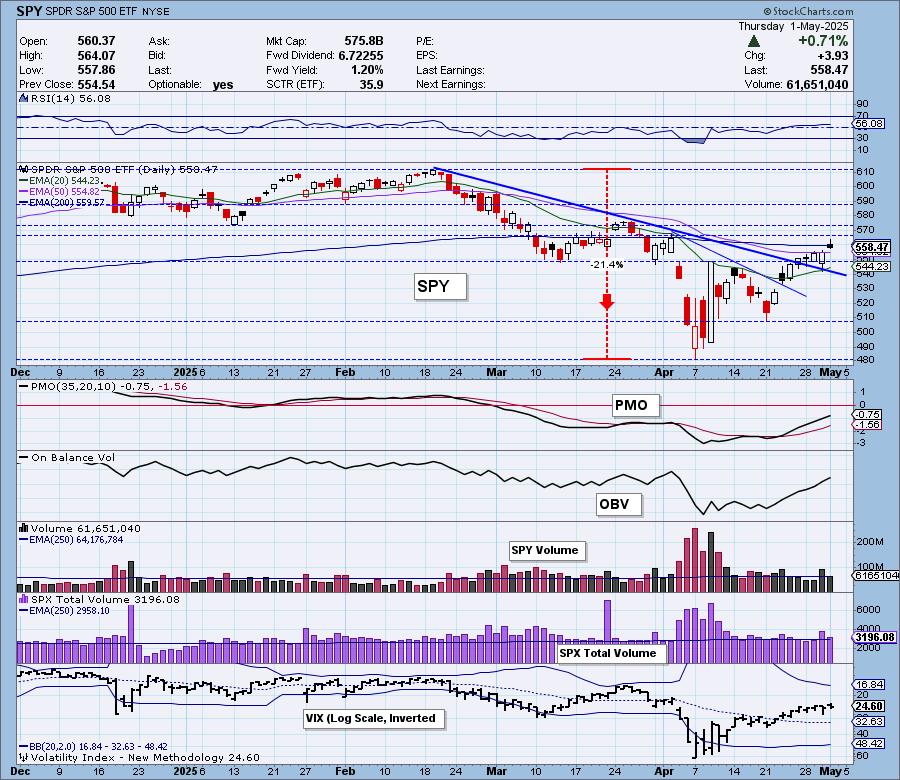
No changes on the VIX and Stochastics so we still see some internal strength in the very short term, but we are still pessimistic about tomorrow's trading.
S&P 500 New 52-Week Highs/Lows: New Highs did see a nice gain on the rally, but New Lows were also prevalent. The good news is that the High-Low Differential is above the zero line again.
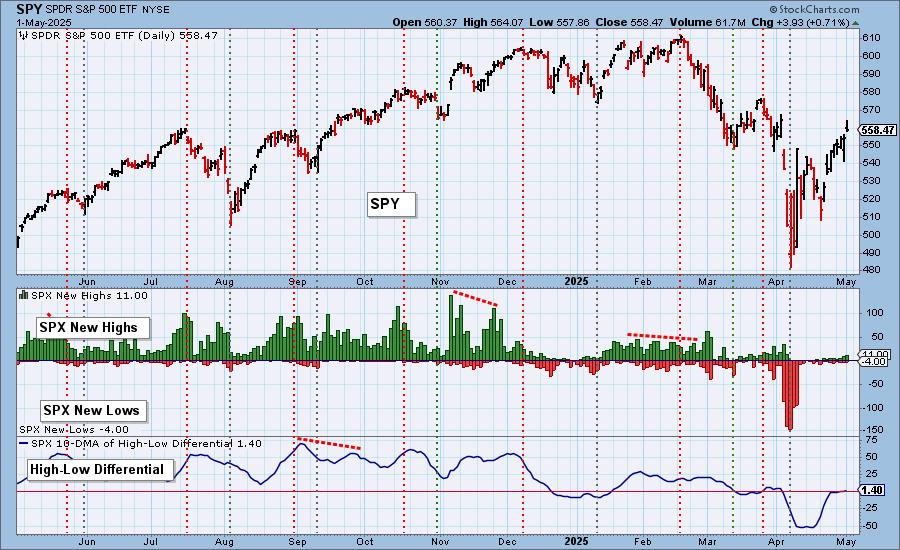
Climax* Analysis: There were no climax readings today.
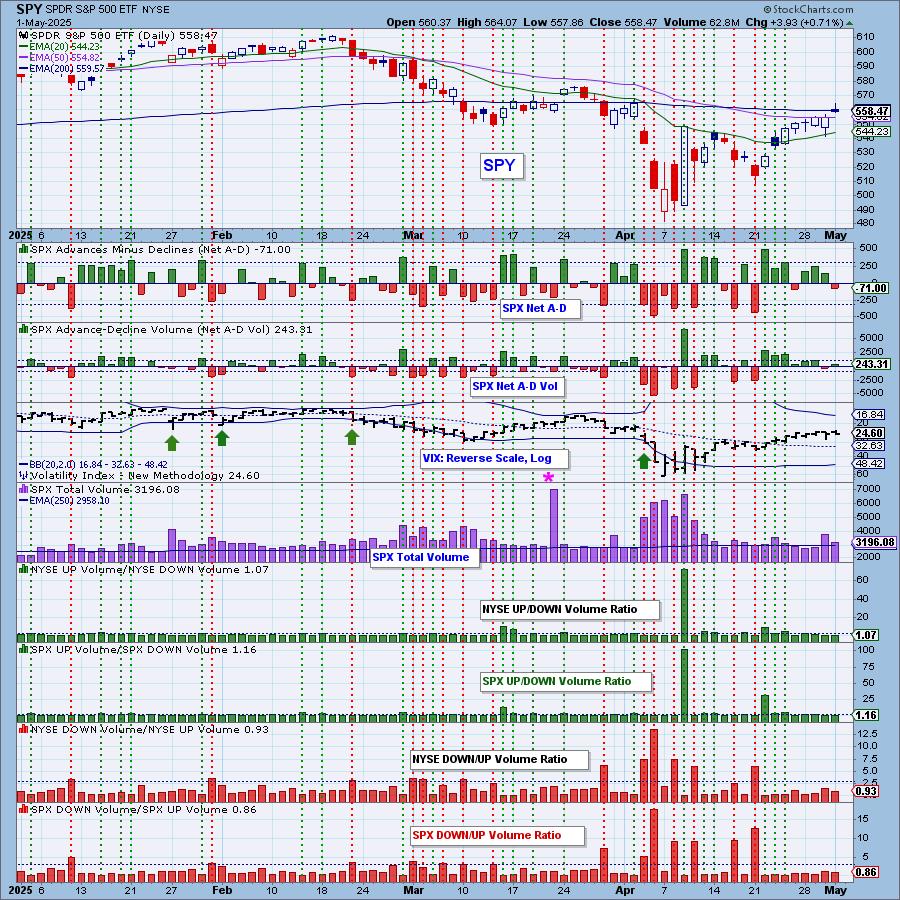
*A climax is a one-day event when market action generates very high readings in, primarily, breadth and volume indicators. We also include the VIX, watching for it to penetrate outside the Bollinger Band envelope. The vertical dotted lines mark climax days -- red for downside climaxes, and green for upside. Climaxes are at their core exhaustion events; however, at price pivots they may be initiating a change of trend.
Short-Term Market Indicators: The short-term market trend is UP and the condition is OVERBOUGHT.
Swenlin Trading Oscillators (STOs) continued to contract which doesn't bode well for the short term. Note that participation of stocks above their 20-day EMAs fell on the rally. We also lost some rising PMOs.
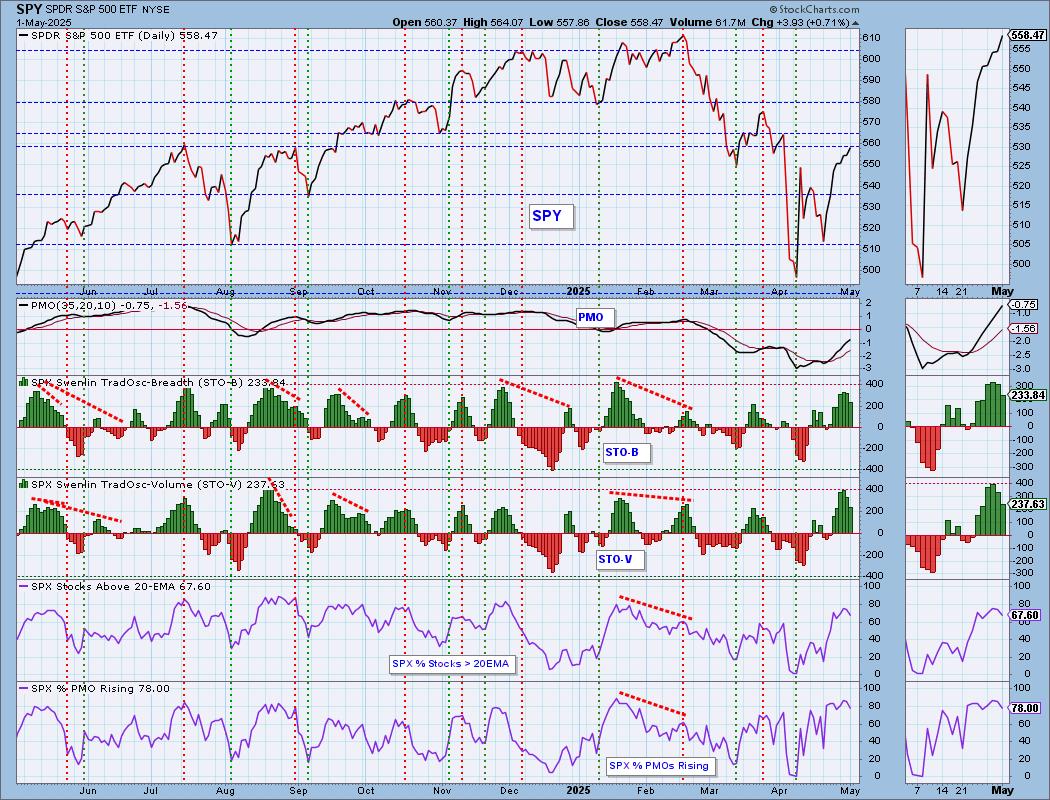
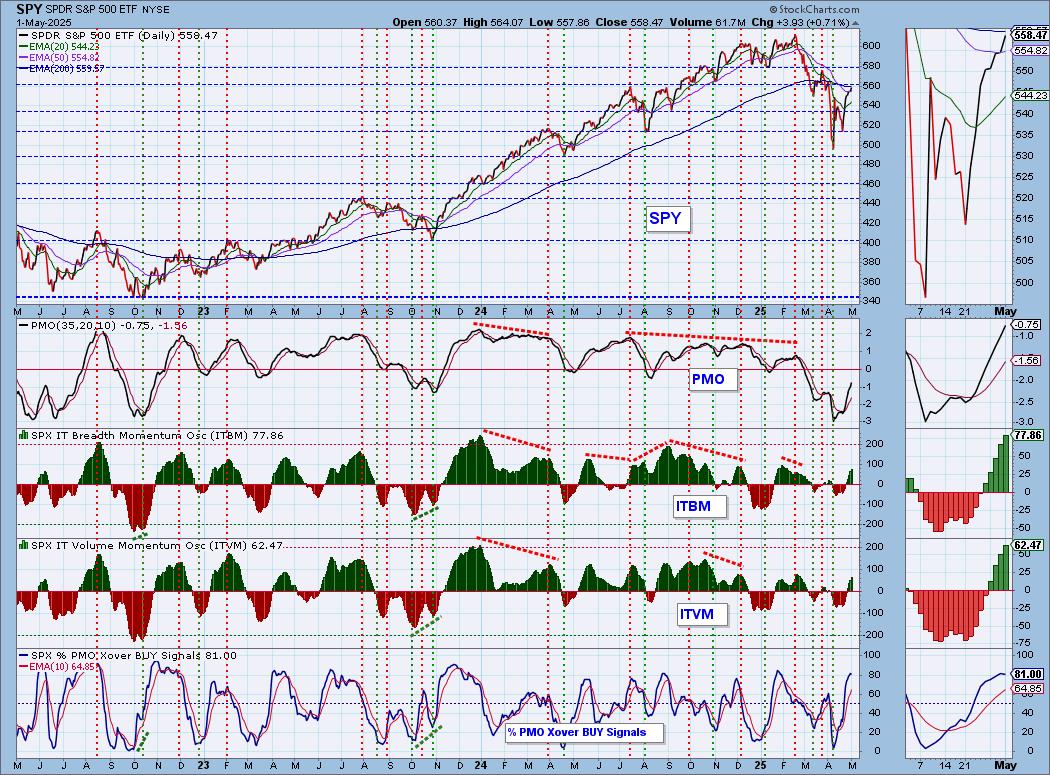
Intermediate-Term Market Indicators: The intermediate-term market trend is DOWN and the condition is NEUTRAL.
We're still listing the ITBM and ITVM as sitting in "neutral" territory, but they are getting close to near-term overbought territory. %PMO Xover BUY Signals also topped on today's rally.
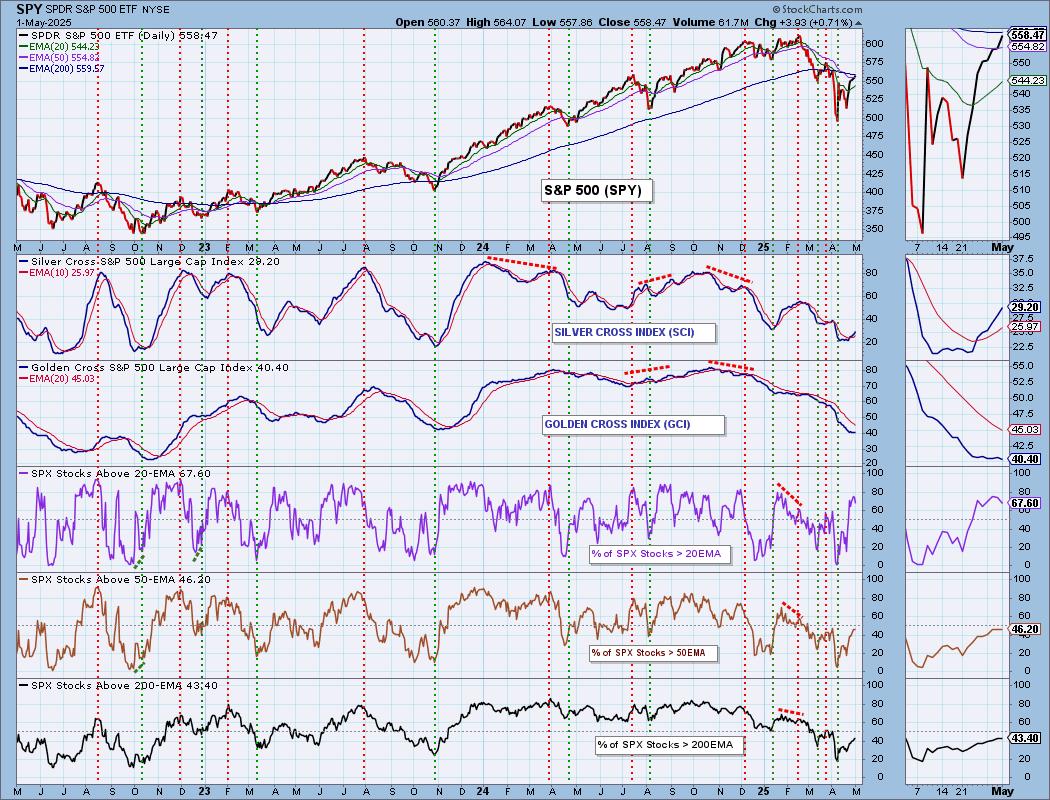
PARTICIPATION CHART (S&P 500): The following chart objectively shows the depth and trend of participation for the SPX in two time frames.
- Intermediate-Term - the Silver Cross Index (SCI) shows the percentage of SPX stocks on IT Trend Model BUY signals (20-EMA > 50-EMA). The opposite of the Silver Cross is a "Dark Cross" -- those stocks are, at the very least, in a correction.
- Long-Term - the Golden Cross Index (GCI) shows the percentage of SPX stocks on LT Trend Model BUY signals (50-EMA > 200-EMA). The opposite of a Golden Cross is the "Death Cross" -- those stocks are in a bear market.
The market bias is BULLISH in the intermediate term.
The market bias is BEARISH in the long term.
Note that %Stocks > 50/200EMAs are reading below our bullish 50% threshold still. As noted previously we lost stocks above their 20-day EMA on a rally. The Silver Cross Index looks quite bullish in its rise, but remember it is at a low 29% which is still ultimately a bearish reading. It is above its signal line so the IT Bias remains BULLISH. The Golden Cross Index topped and is also reading below our bullish 50% threshold. It is well below its signal line so the LT Bias is BEARISH.
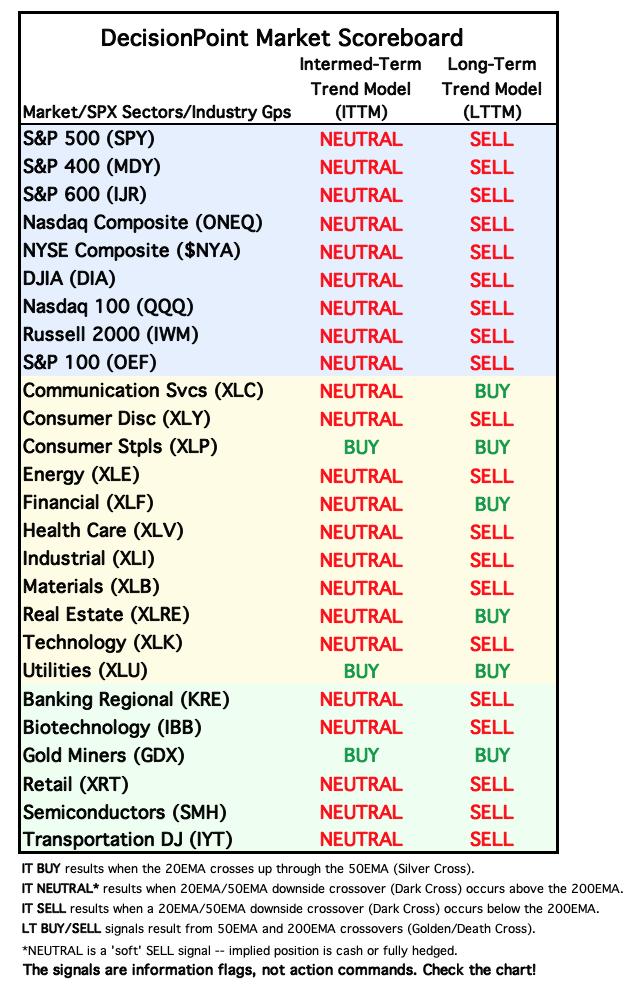
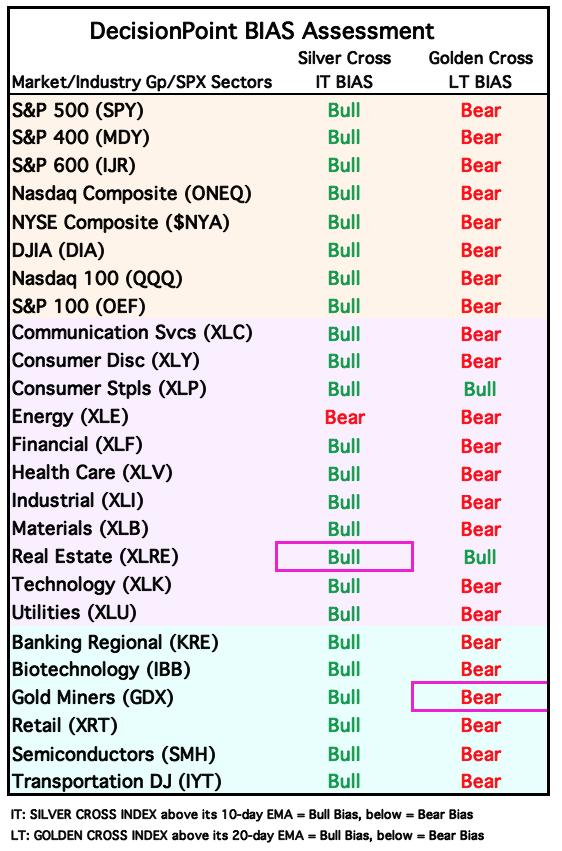
BIAS Assessment: The following table expresses the current BIAS of various price indexes based upon the relationship of the Silver Cross Index to its 10-day EMA (intermediate-term), and of the Golden Cross Index to its 20-day EMA (long-term). When the Index is above the EMA it is bullish, and it is bearish when the Index is below the EMA. The BIAS does not imply that any particular action should be taken. It is information to be used in the decision process.
The items with highlighted borders indicate that the BIAS changed today.
*****************************************************************************************************
CONCLUSION: Energy is the only "Bear" bias on the Bias Table above for the Silver Cross IT Bias. This is short-term bullish. However, in the very short term, there are problems. STOs are falling, we didn't see a broad rally and PMOs are beginning to back off within the index. We also don't like that participation of stocks above their 20-day EMAs contracted today. The filled black candlestick also suggests that we will get lower prices over the next day or two. However, if mega-caps continue to pour it on, the SPY could continue higher. The rally seems to be exclusive to Technology and the Magnificent Seven. We need this rally to broaden out before we look for a steady advance.
Erin is 10% long, 0% short. (This is intended as information, not a recommendation.)
*****************************************************************************************************
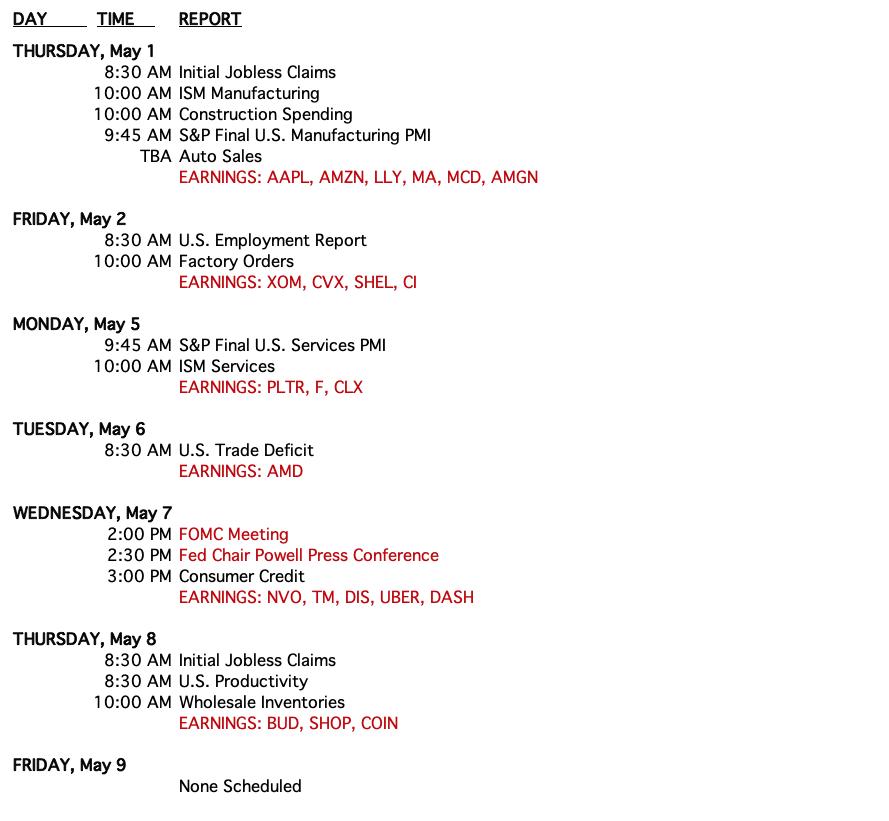
CALENDAR
BITCOIN
As we expected, Bitcoin rallied up and out of the consolidation zone. It looks ready to get back to all-time highs. The only trouble may be the overbought RSI which does suggest the rally is already getting ahead of itself. The PMO looks very bullish on its rise so more than likely Bitcoin will maintain overbought conditions as it did in November.

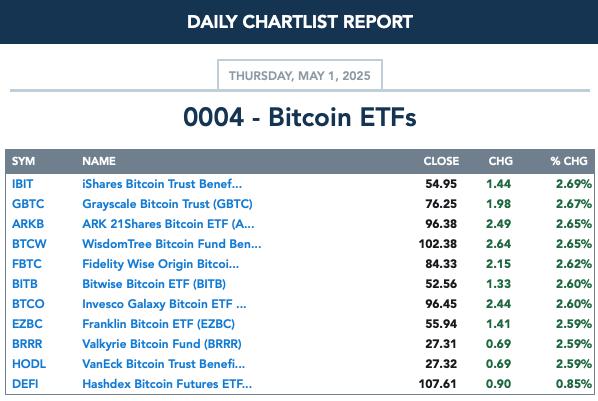
BITCOIN ETFs
INTEREST RATES
Yields bounced today, but ultimately remain in declining trends so we are expecting them to fall a bit further from here.
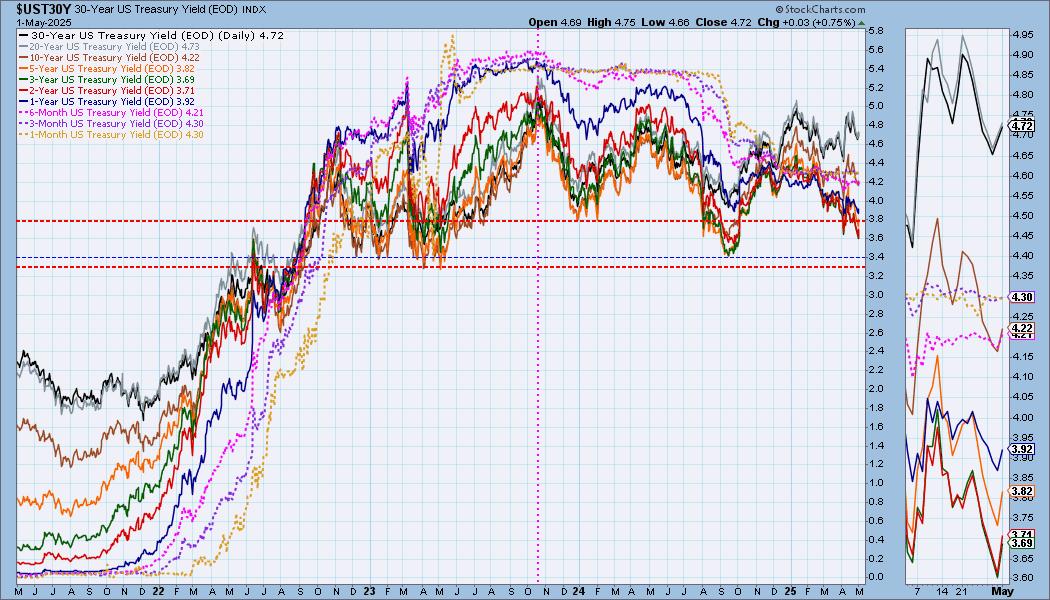
The Yield Curve Chart from StockCharts.com shows us the inversions taking place. The red line should move higher from left to right. Inversions are occurring where it moves downward.

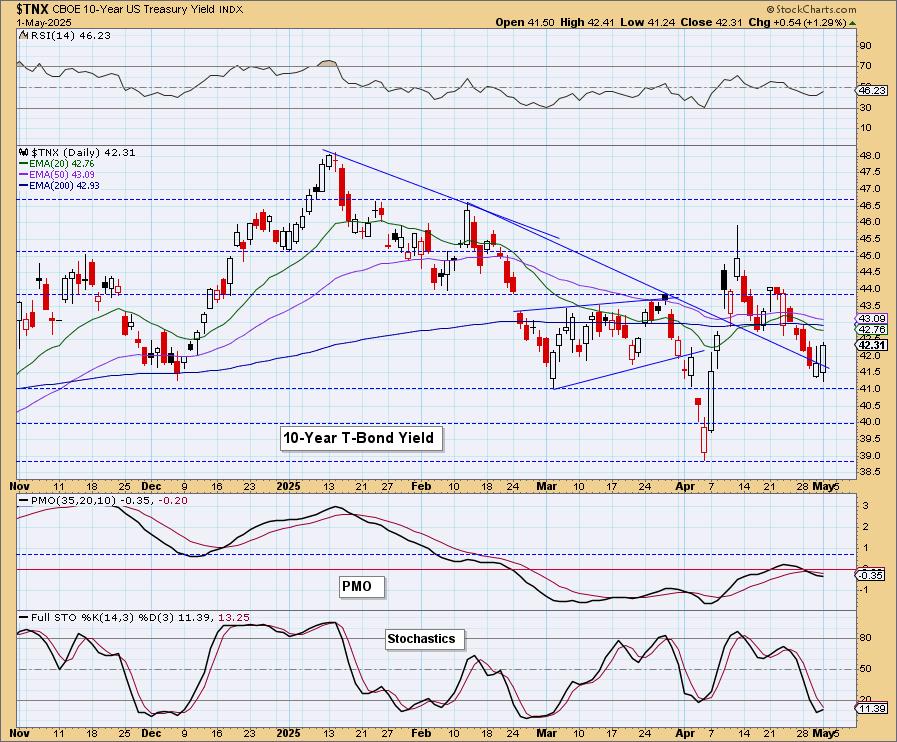
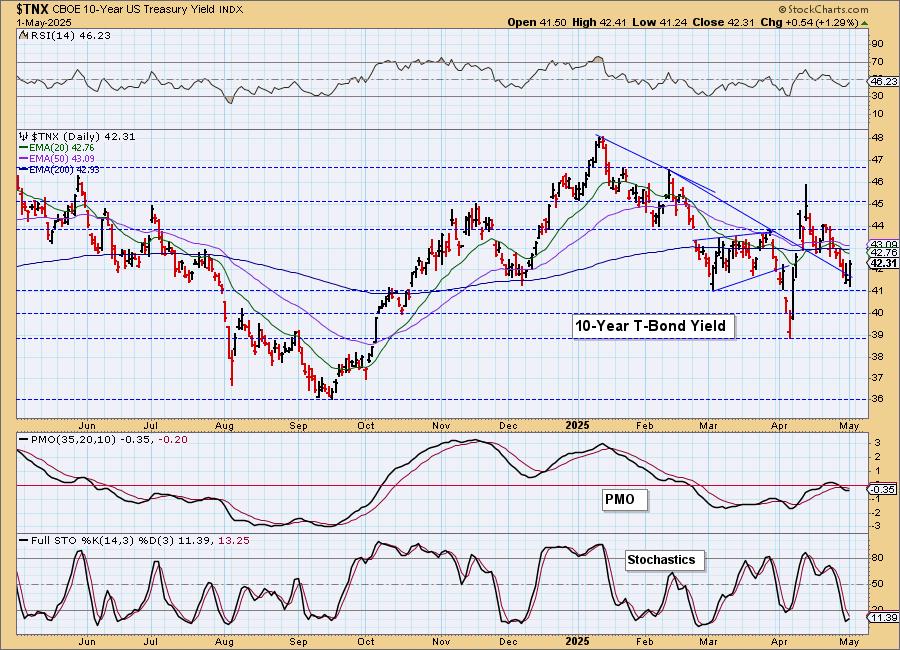
10-YEAR T-BOND YIELD
We saw a nice rally on $TNX today which does make us wonder if this bull flag will finally see a breakout. For now the PMO is falling and the RSI is negative so we see a bearish bias on the chart. It is nearing a Death Cross of the 50/200-day EMAs. Stochastics did turn back up but are very weak below 20.
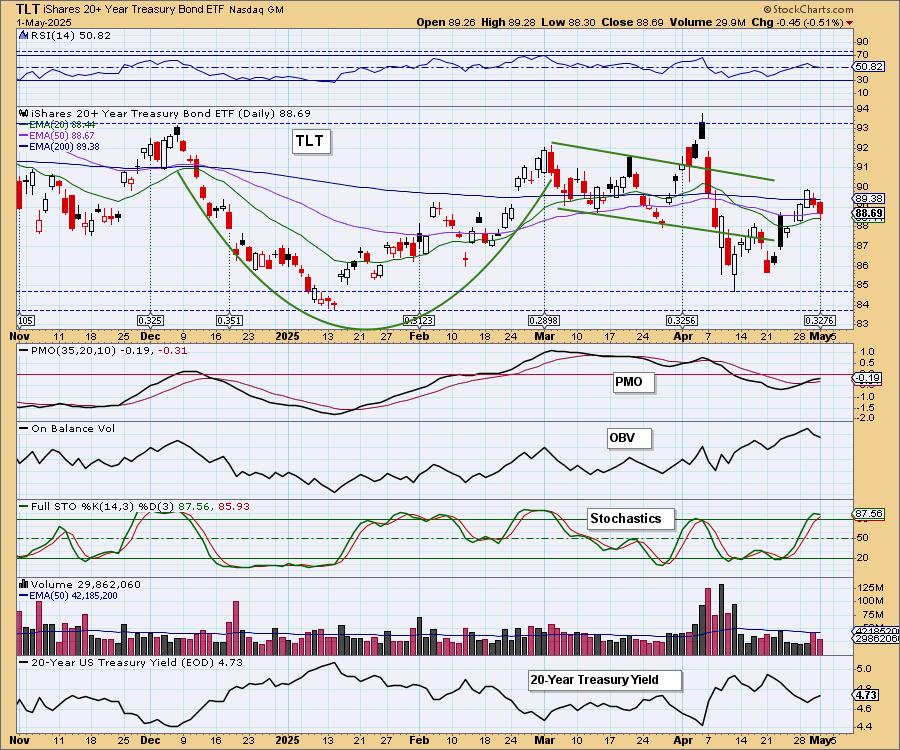
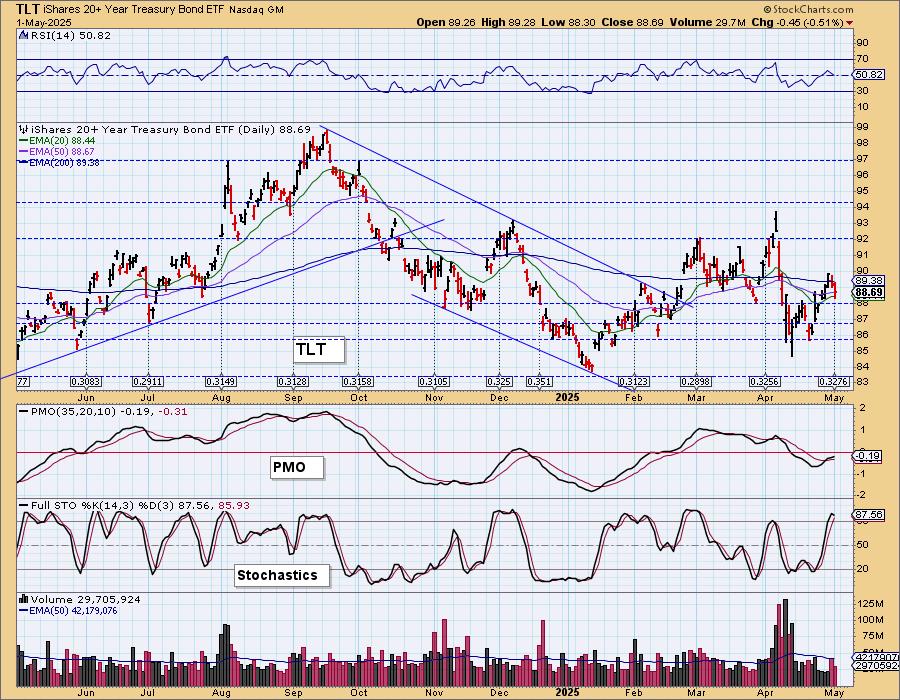
BONDS (TLT)
IT Trend Model: SELL as of 4/14/2025
LT Trend Model: SELL as of 12/13/2024
TLT Daily Chart: Bonds are pulling back right now, but we expect they will soon be rising again given yields are still in declining trends. The PMO is still rising toward the zero line and Stochastics are holding above 80 so we should see the rally reignite.
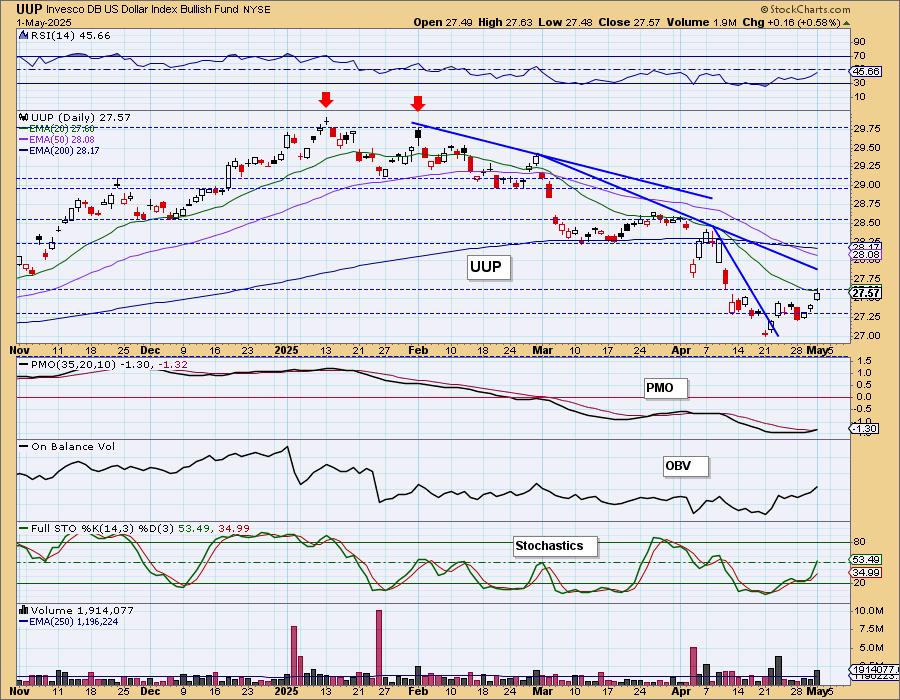
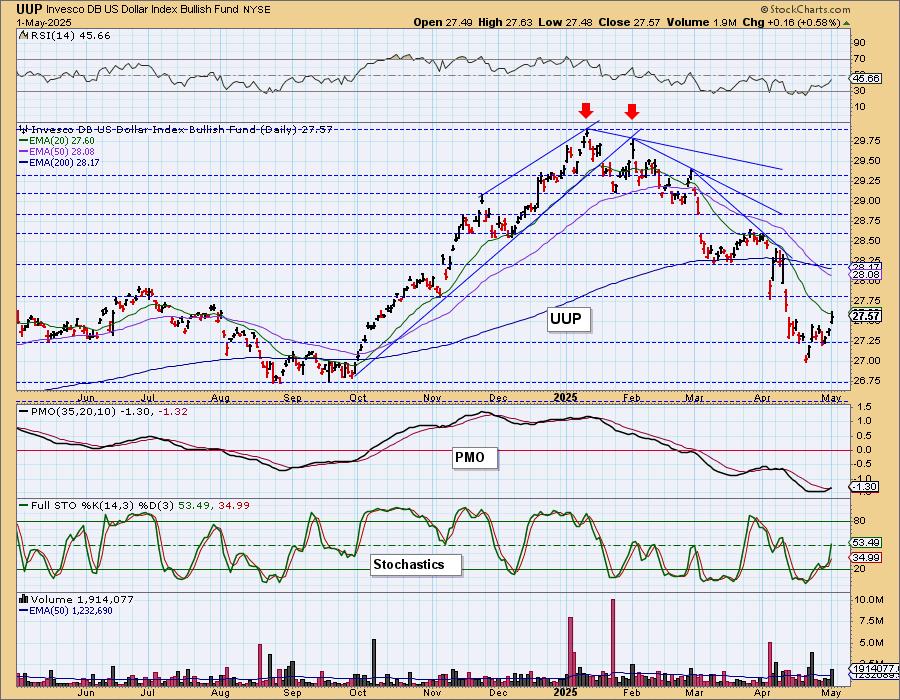
DOLLAR (UUP)
IT Trend Model: NEUTRAL as of 3/5/2025
LT Trend Model: SELL as of 4/25/2025
UUP Daily Chart: The Dollar managed a nice rally but is already up against an area of resistance at the 20-day EMA and gap resistance. The indicators are beginning to firm up slightly so we would look for more upside at this point. The PMO is on a new Crossover BUY Signal and Stochastics have reached positive territory.
GOLD
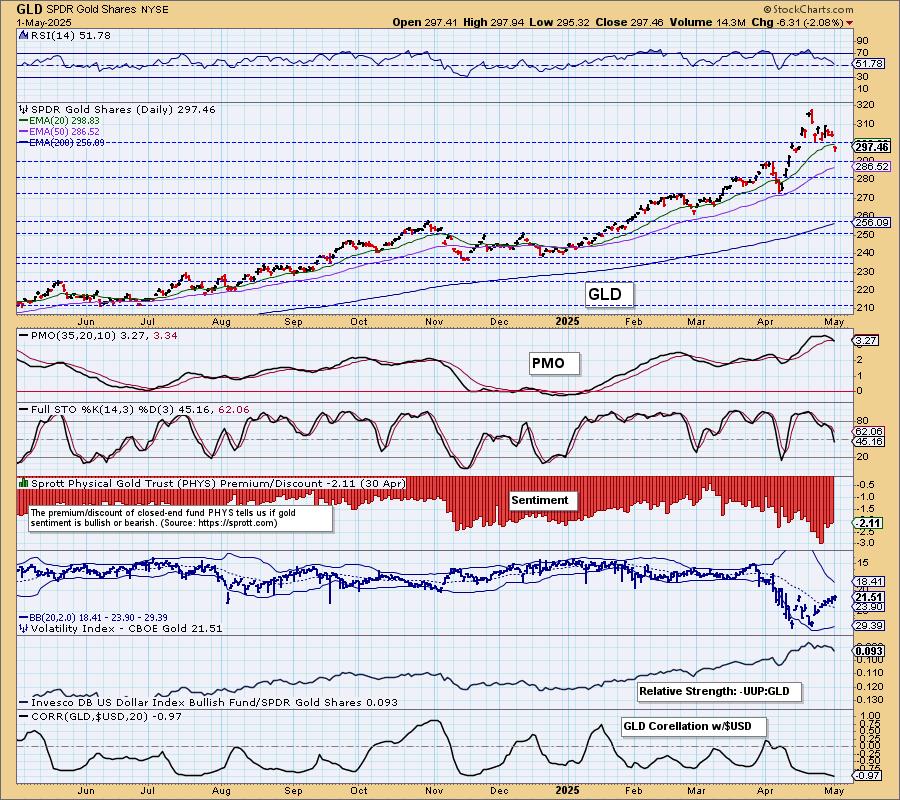
IT Trend Model: BUY as of 1/10/2025
LT Trend Model: BUY as of 10/20/2023
GLD Daily Chart: Gold continues to pull back, but now it has formed a bull flag. We still think there is more downside to absorb so the flag could be extended further. We have a new PMO Crossover SELL Signal that doesn't bode well. Stochastics have also dropped into negative territory.
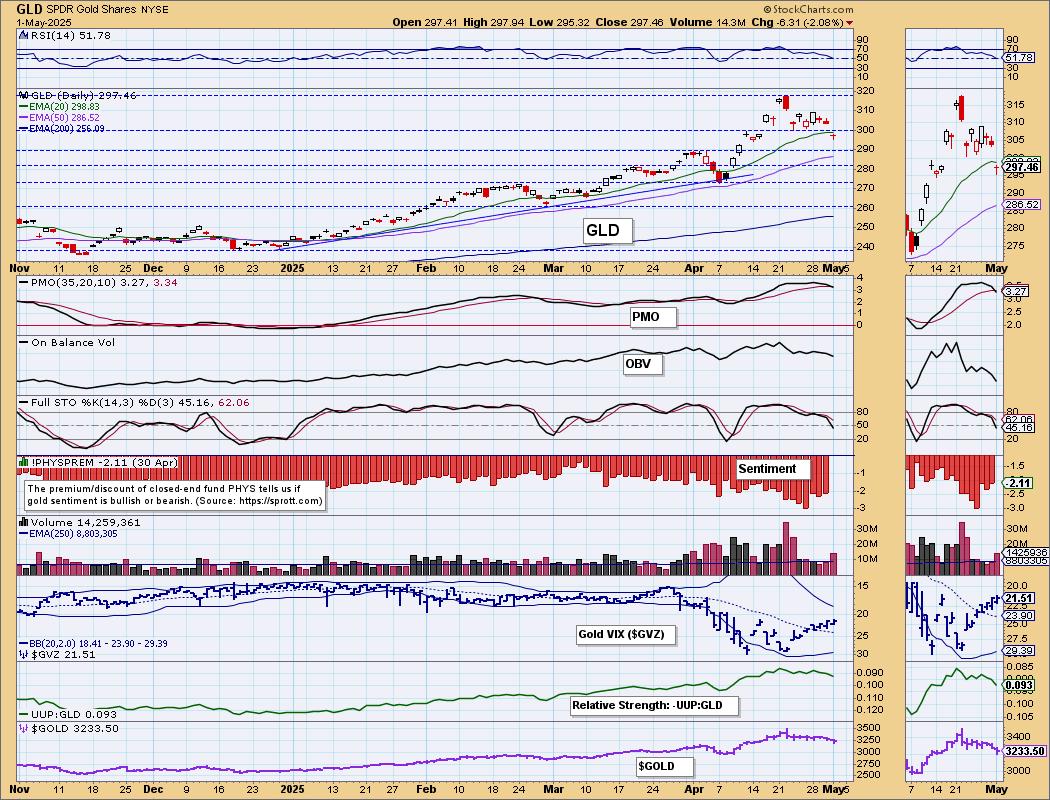
Relative strength against the Dollar is fading. The correlation is almost a perfect inverse so more rally by the Dollar will definitely hurt Gold. Look for the next line of support to be tested at 300 for GLD.
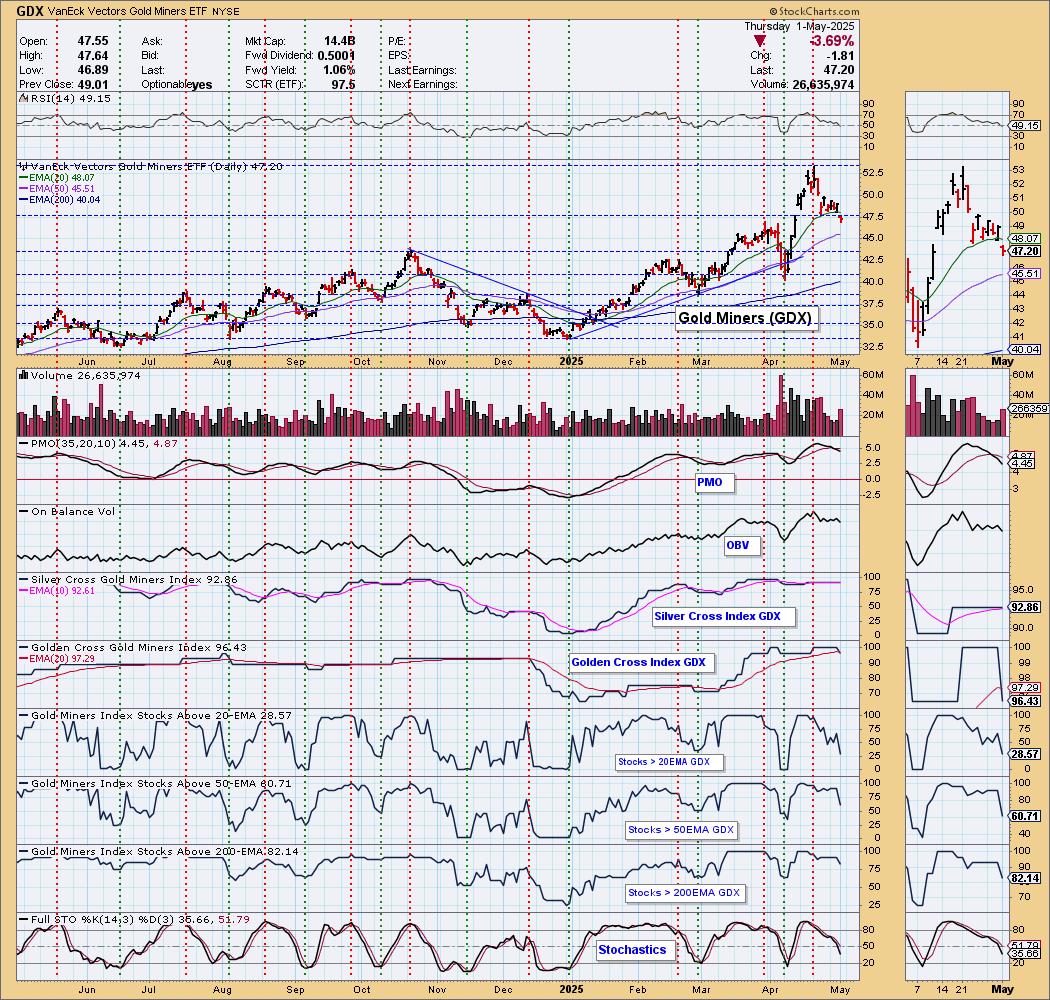
GOLD MINERS (GDX) Daily Chart: Gold Miners lost support and we think there is more downside ahead as participation readings are all declining quickly. The PMO looks especially negative and the RSI dropped into negative territory. Stochastics are also in negative territory. The Golden Cross Index dropped below its signal line giving GDX a bearish LT Bias. We would look for support to be tested at 43.00.
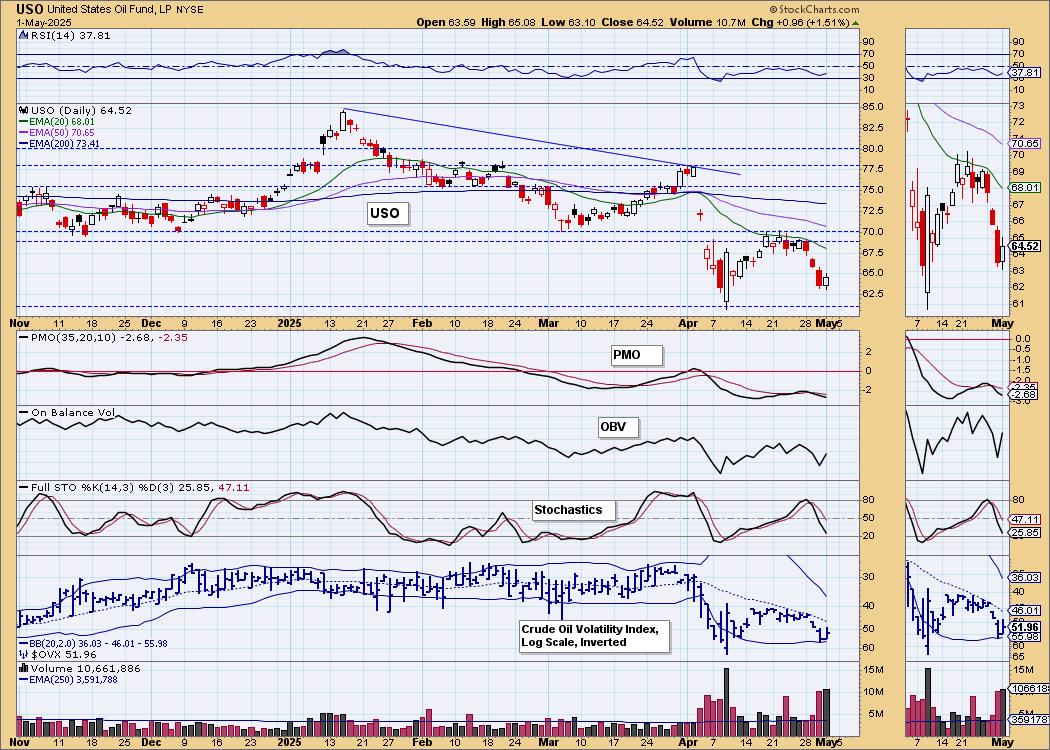
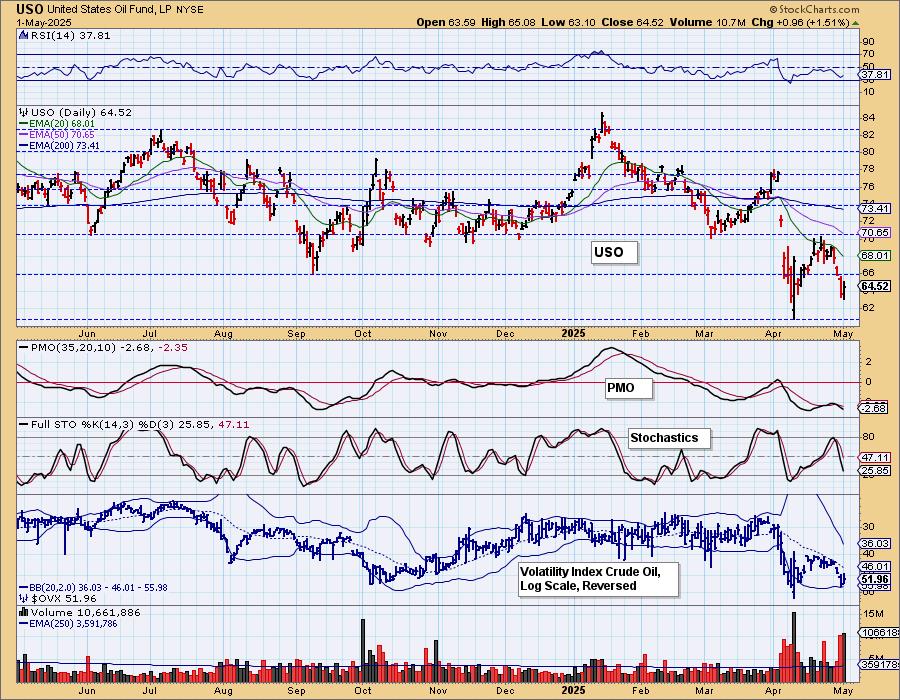
CRUDE OIL (USO)
IT Trend Model: NEUTRAL as of 2/27/2025
LT Trend Model: SELL as of 3/18/2025
USO Daily Chart: Crude Oil had a welcomed rally, but we still saw a lower high and lower low. The PMO is about as bearish as it can get and Stochastics are still falling in negative territory. We doubt this rally will catch hold.
Good Luck & Good Trading!
Erin Swenlin and Carl Swenlin
Technical Analysis is a windsock, not a crystal ball. --Carl Swenlin
(c) Copyright 2025 DecisionPoint.com
Disclaimer: This blog is for educational purposes only and should not be construed as financial advice. The ideas and strategies should never be used without first assessing your own personal and financial situation, or without consulting a financial professional. Any opinions expressed herein are solely those of the author, and do not in any way represent the views or opinions of any other person or entity.
DecisionPoint is not a registered investment advisor. Investment and trading decisions are solely your responsibility. DecisionPoint newsletters, blogs or website materials should NOT be interpreted as a recommendation or solicitation to buy or sell any security or to take any specific action.
NOTE: The signal status reported herein is based upon mechanical trading model signals, specifically, the DecisionPoint Trend Model. They define the implied bias of the price index based upon moving average relationships, but they do not necessarily call for a specific action. They are information flags that should prompt chart review. Further, they do not call for continuous buying or selling during the life of the signal. For example, a BUY signal will probably (but not necessarily) return the best results if action is taken soon after the signal is generated. Additional opportunities for buying may be found as price zigzags higher, but the trader must look for optimum entry points. Conversely, exit points to preserve gains (or minimize losses) may be evident before the model mechanically closes the signal.
Helpful DecisionPoint Links:
DecisionPoint Alert Chart List
DecisionPoint Golden Cross/Silver Cross Index Chart List
DecisionPoint Sector Chart List
Price Momentum Oscillator (PMO)