
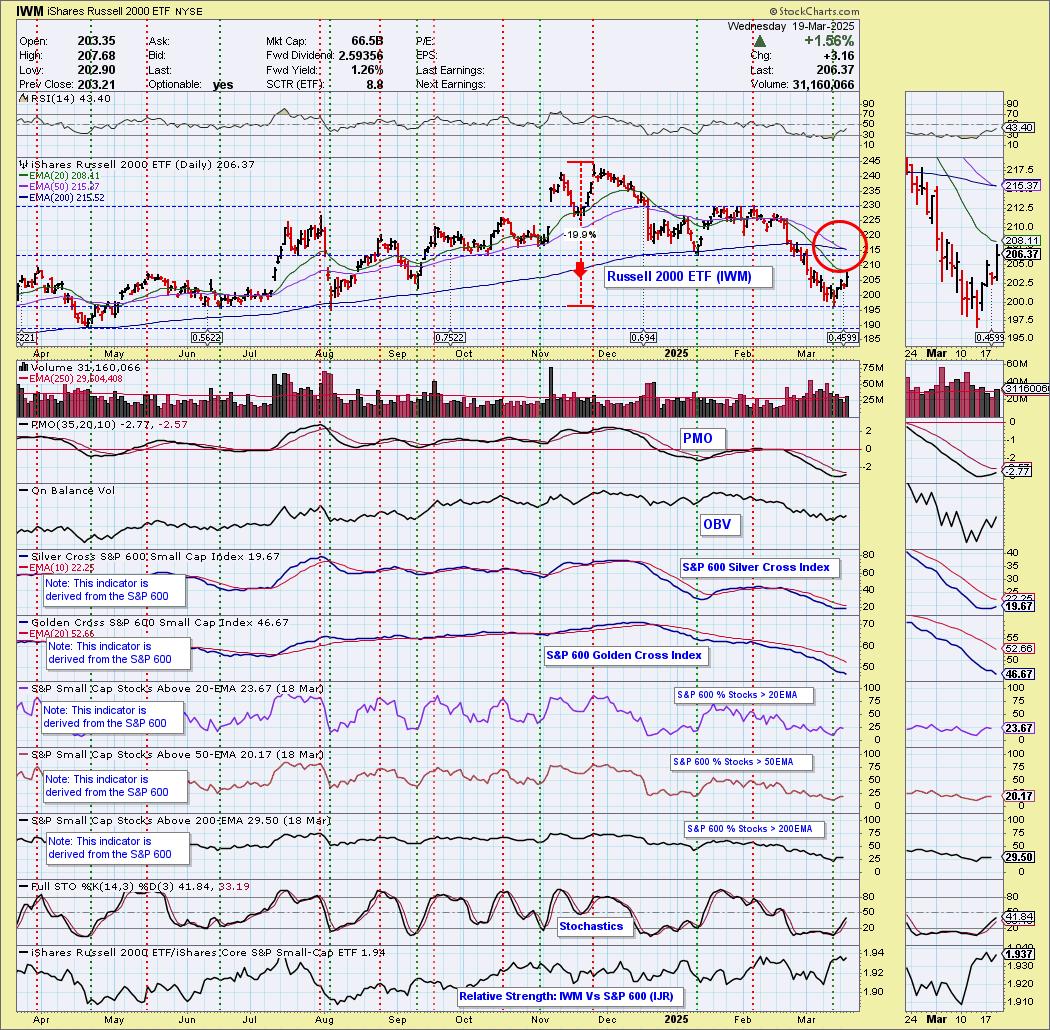
Today the Russell 2000 ETF (IWM) 50-day EMA crossed down through the 200-day EMA (Death Cross), generating an LT Trend Model SELL Signal. IWM has declined -20% from its all-time high, and it is in a bear market. This is a good bounce off strong support, but we should consider it a bear market rally which may not have staying power.
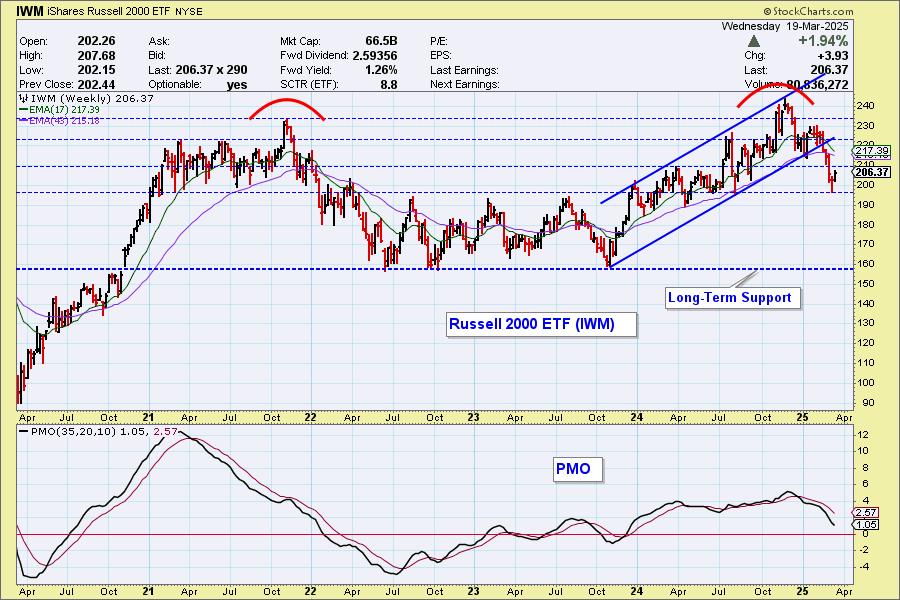
The weekly chart shows that IWM has a long-term rounded top. The weekly PMO is headed lower. If the decline persists all the way to long-term support at 157.25, the total decline would be -36%.
The DecisionPoint Alert Weekly Wrap presents an end-of-week assessment of the trend and condition of the Stock Market, the U.S. Dollar, Gold, Crude Oil, and Bonds. The DecisionPoint Alert daily report (Monday through Thursday) is abbreviated and gives updates on the Weekly Wrap assessments.
Watch the latest episode of DecisionPoint on our YouTube channel here!
MARKET/INDUSTRY GROUP/SECTOR INDEXES
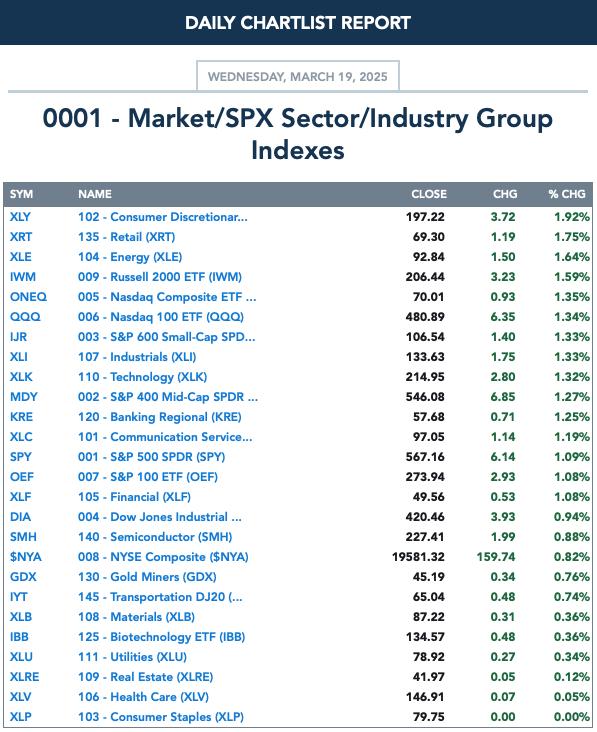
CLICK HERE for Carl's annotated Market Index, Sector, and Industry Group charts.
THE MARKET (S&P 500)
IT Trend Model: NEUTRAL as of 3/4/2025
LT Trend Model: BUY as of 3/29/2023
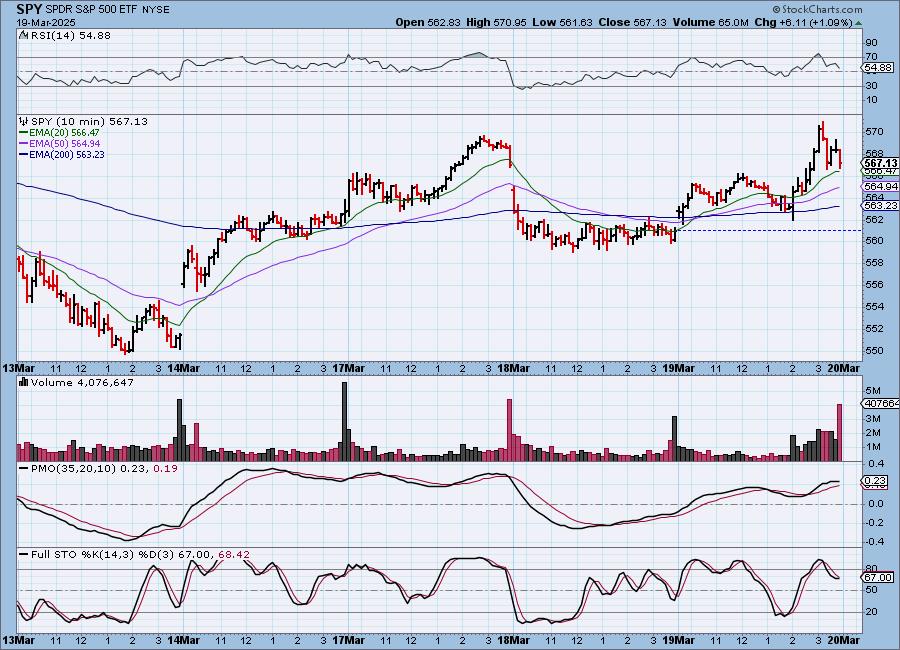
SPY 10-Minute Chart: Price was up on the open, but really didn't go anywhere until after Chairman Powell's remarks that the economy remains strong despite drop off in consumer confidence.
SPY Daily Chart: We still think we may be looking at a bearish reverse flag formation. Price has hit the declining tops trendline so we'll know more about the voracity of this rally soon, but this would be an area where we could see price fail. The PMO finally turned up today, but barely.
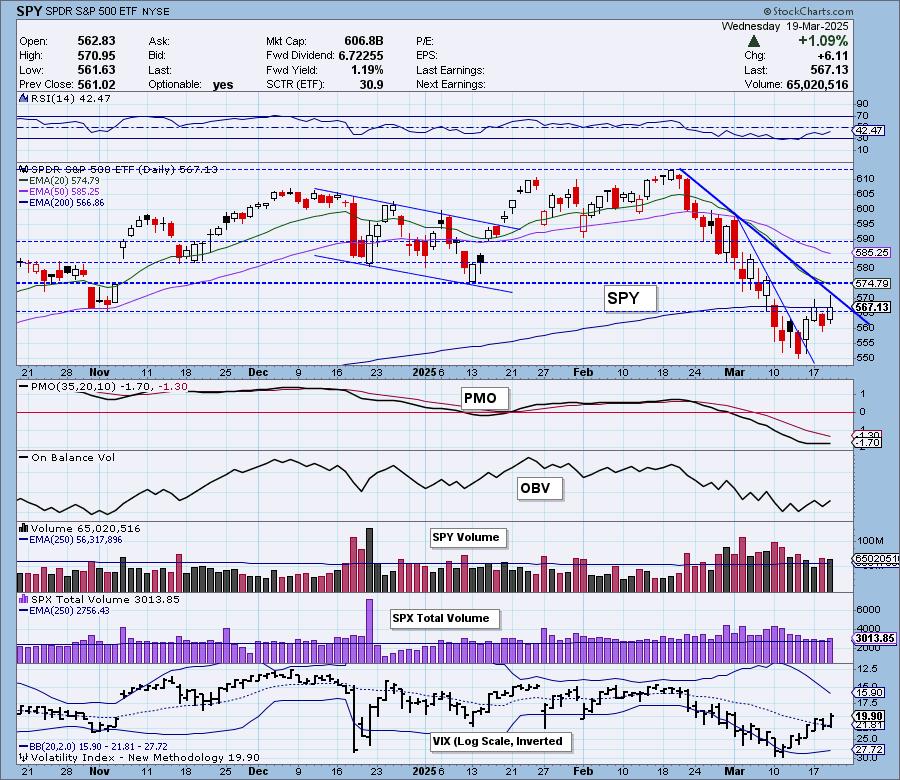
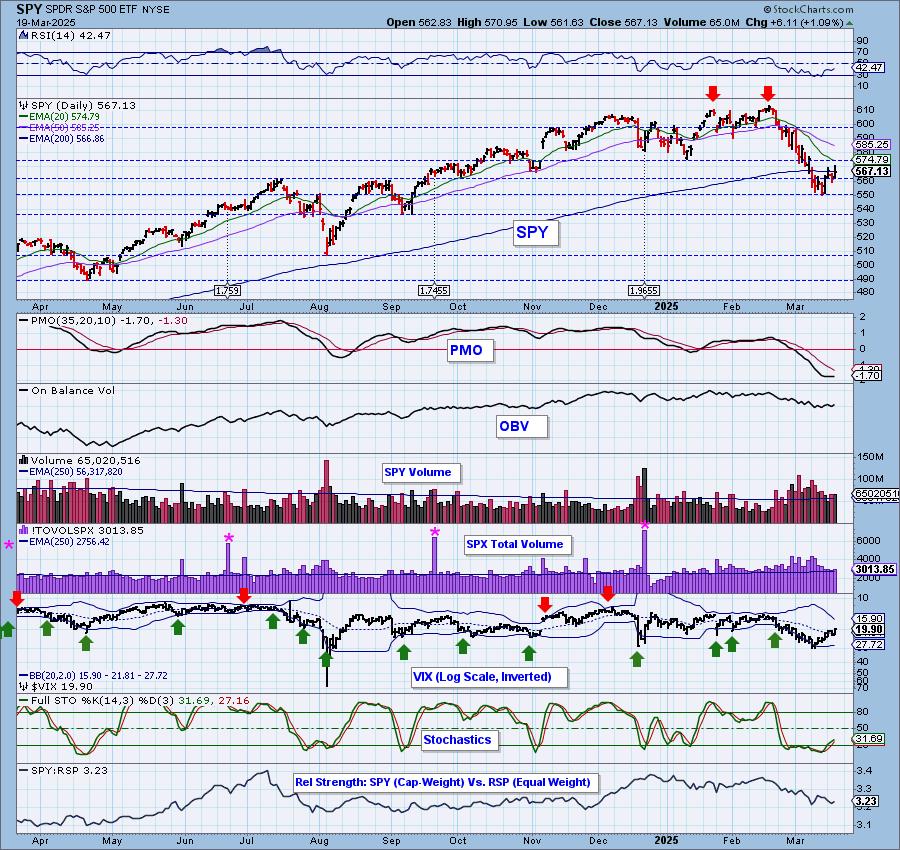
The VIX looks very good above its moving average on the inverted scale as fear continues to leak out of the market on this rally. Stochastics are also encouraging as they rise. They are still in negative territory so this is a weak signal of internal strength.

Here is the latest recording from 3/17. Click HERE to get to our video list.:
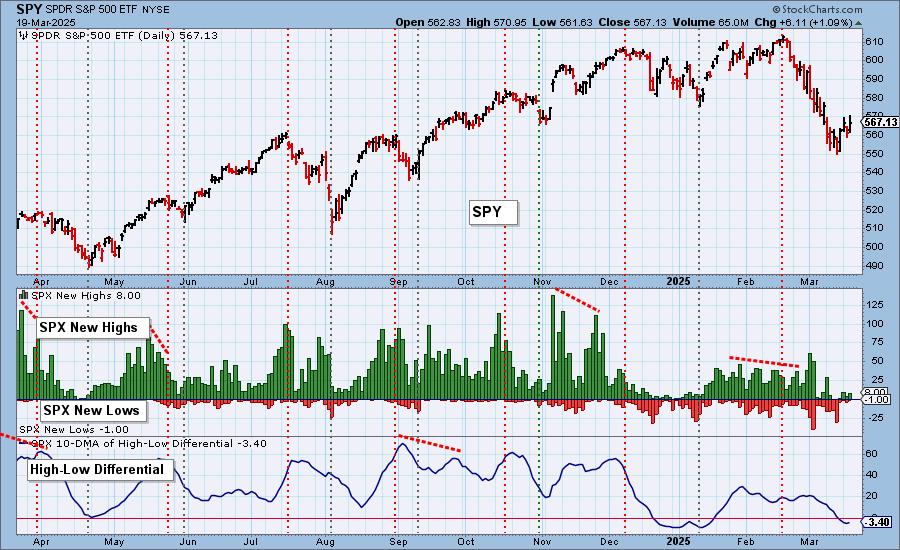
S&P 500 New 52-Week Highs/Lows: New Highs expanded somewhat on the rally but remain in a declining trend. We only saw one New Low. The High-Low Differential turned up today.
Climax* Analysis: {{{ Today there were two climax readings (and one "almost") on the four relevant indicators, giving us a weak upside exhaustion climax. We note that it is the second upside exhaustion climax since the rally started last week, so we should be alert for the market to turn down again.
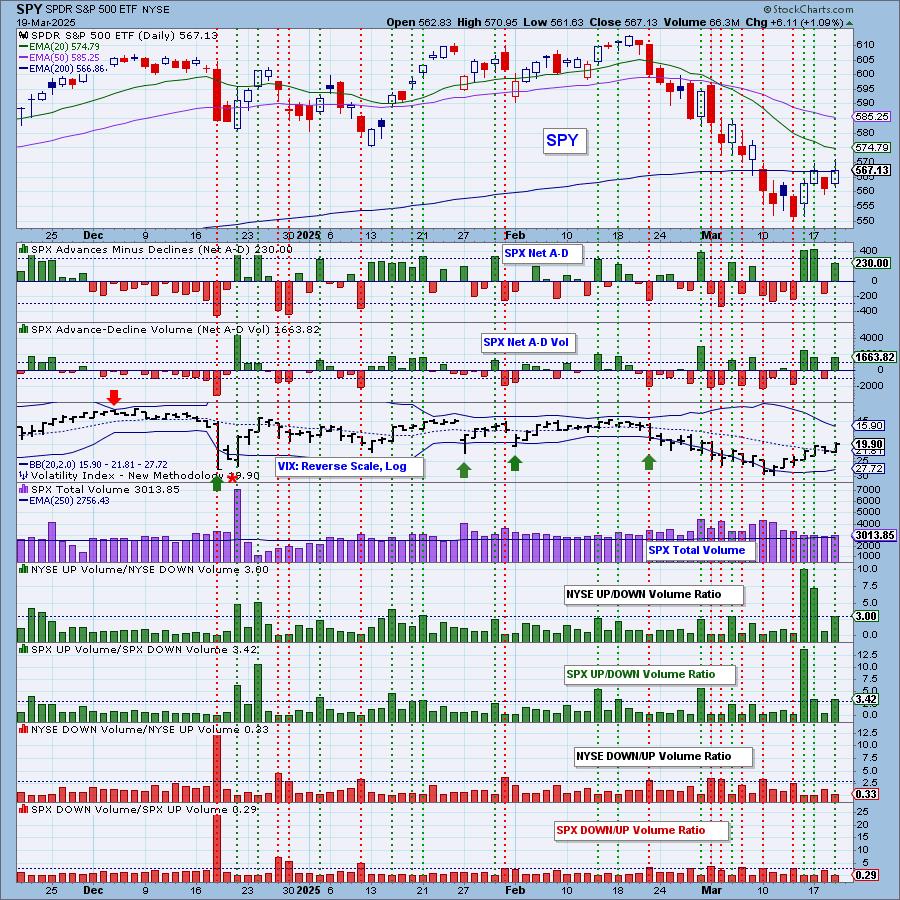
*A climax is a one-day event when market action generates very high readings in, primarily, breadth and volume indicators. We also include the VIX, watching for it to penetrate outside the Bollinger Band envelope. The vertical dotted lines mark climax days -- red for downside climaxes, and green for upside. Climaxes are at their core exhaustion events; however, at price pivots they may be initiating a change of trend.
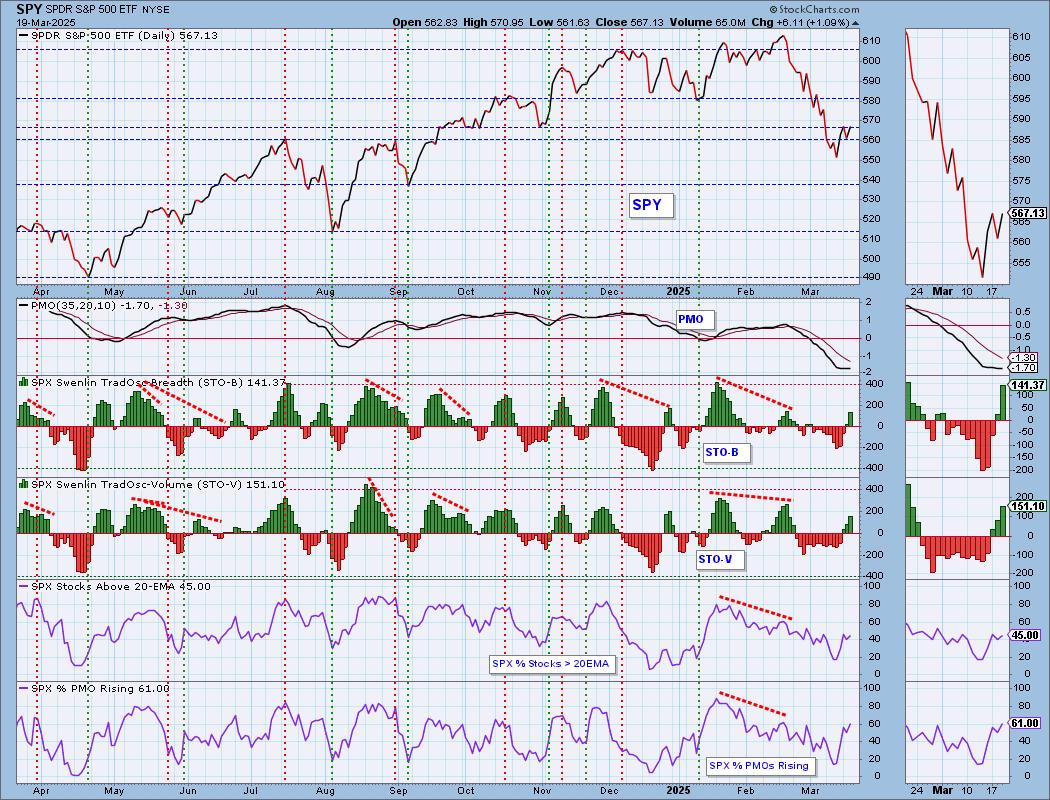
Short-Term Market Indicators: The short-term market trend is DOWN and the condition is NEUTRAL.
The Swenlin Trading Oscillators (STOs) are both rising strongly, but are getting a little bit overbought near-term. Participation expanded somewhat. We did see more internal rising momentum. The declining trend on %PMOs Rising has broken from its declining trend.
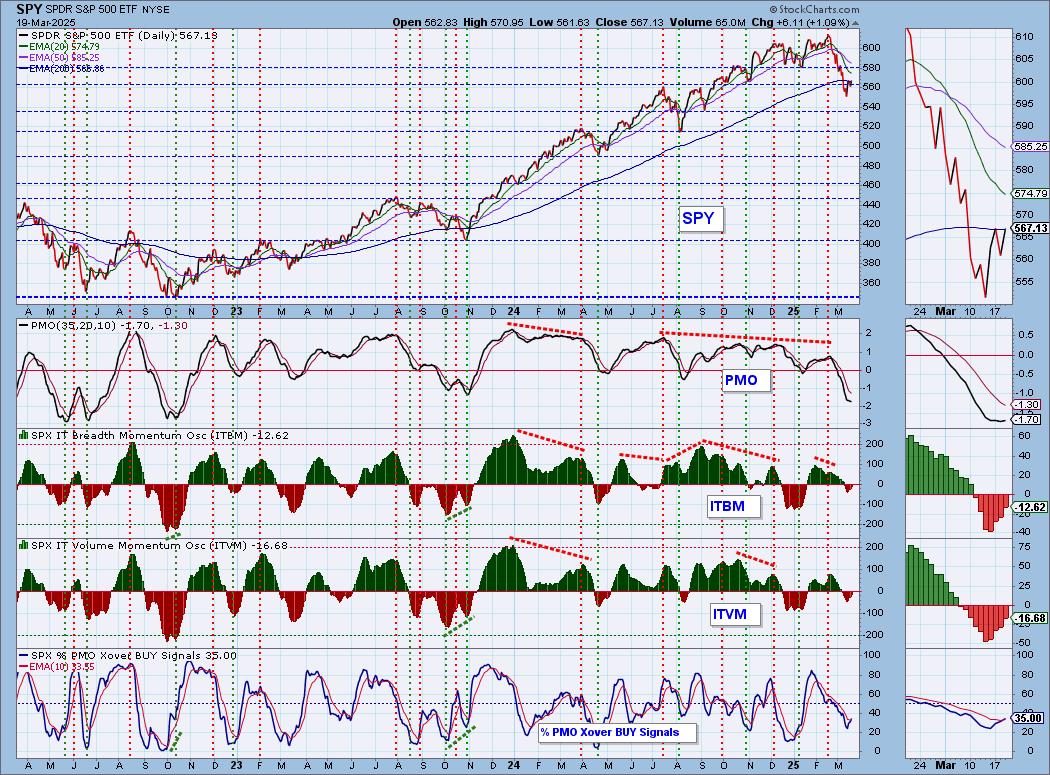
Intermediate-Term Market Indicators: The intermediate-term market trend is DOWN and the condition is NEUTRAL.
The ITBM and ITVM rose again today, but both remain in negative territory. We did see %PMO Xover BUY Signals cross above the signal line, but the declining trend is clearly intact.
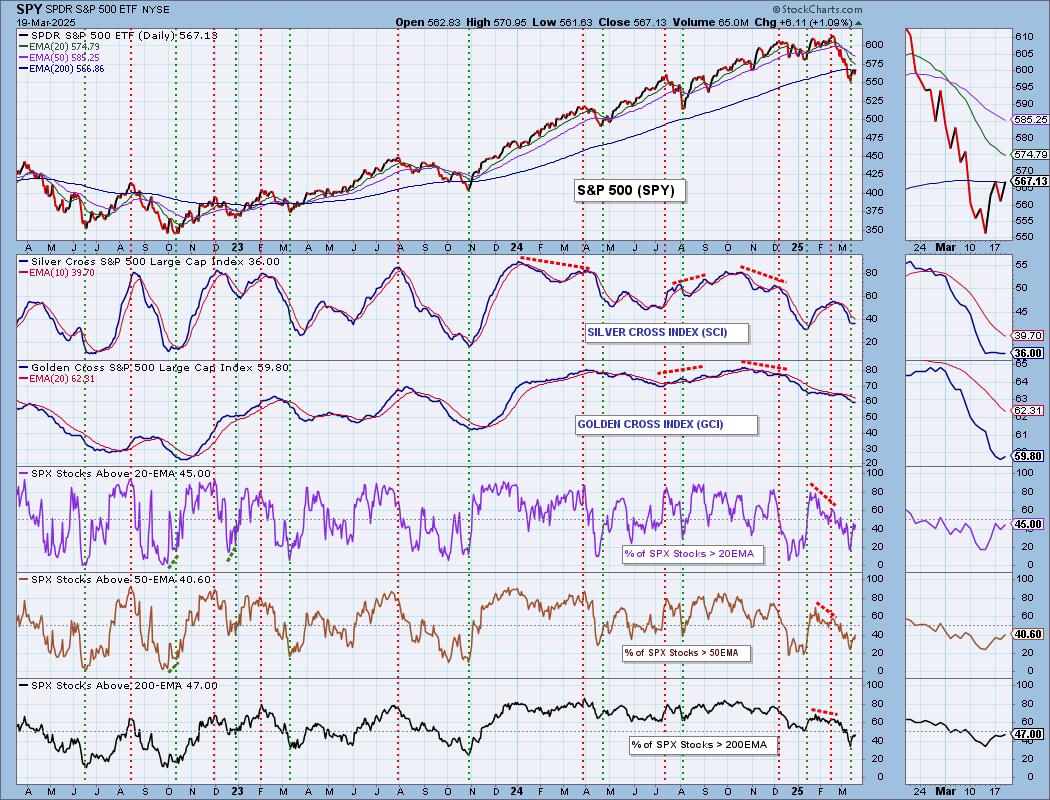
PARTICIPATION CHART (S&P 500): The following chart objectively shows the depth and trend of participation for the SPX in two time frames.
- Intermediate-Term - the Silver Cross Index (SCI) shows the percentage of SPX stocks on IT Trend Model BUY signals (20-EMA > 50-EMA). The opposite of the Silver Cross is a "Dark Cross" -- those stocks are, at the very least, in a correction.
- Long-Term - the Golden Cross Index (GCI) shows the percentage of SPX stocks on LT Trend Model BUY signals (50-EMA > 200-EMA). The opposite of a Golden Cross is the "Death Cross" -- those stocks are in a bear market.
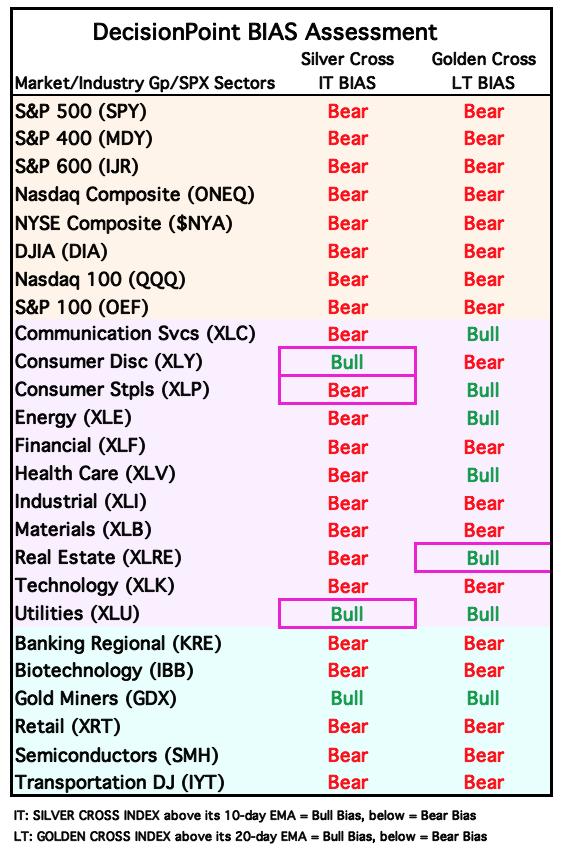
The market bias is BEARISH in the intermediate- and long-term timeframes.
Participation is still reading below our bullish 50% threshold and are basically in declining trends. We want to see more participation before we get too bullish. The Silver Cross Index is flat. It is below its signal line so the IT Bias is still BEARISH. Good news is that the Golden Cross Index did turn up today, but that condition isn't likely to last given we have fewer stocks above their 200-day EMA as compared to those with Golden Crosses. The Golden Cross Index is below its signal line so the LT Bias is BEARISH.
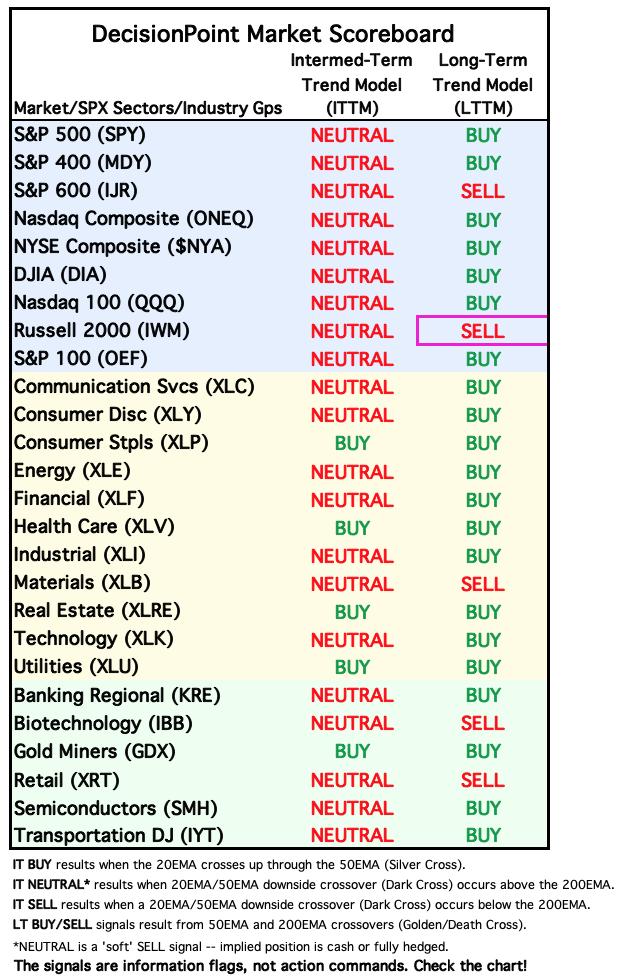
BIAS Assessment: The following table expresses the current BIAS of various price indexes based upon the relationship of the Silver Cross Index to its 10-day EMA (intermediate-term), and of the Golden Cross Index to its 20-day EMA (long-term). When the Index is above the EMA it is bullish, and it is bearish when the Index is below the EMA. The BIAS does not imply that any particular action should be taken. It is information to be used in the decision process.
The items with highlighted borders indicate that the BIAS changed today.
*****************************************************************************************************
CONCLUSION: We had a nice rally today, but it does fit into the category of 'churn'. This rally looks good off support, but we now see a bear flag on the SPY. We are still concerned that we are seeing a bear market rally which means it is very vulnerable to a downside reversal. The upside exhaustion climax also tells us to be cautious. Indicators are doing what we want, although we would like to see stronger participation readings to set up a good foundation for a rally continuation. We experienced some churn over the past two days and we wouldn't be surprised to see more. Our indicators have us cautiously bullish right now, but we are on the lookout for possible rally failure. A breakout from the current declining trend would go a long way to restore confidence.
Erin is 20% long, 0% short. (This is intended as information, not a recommendation.)
*****************************************************************************************************
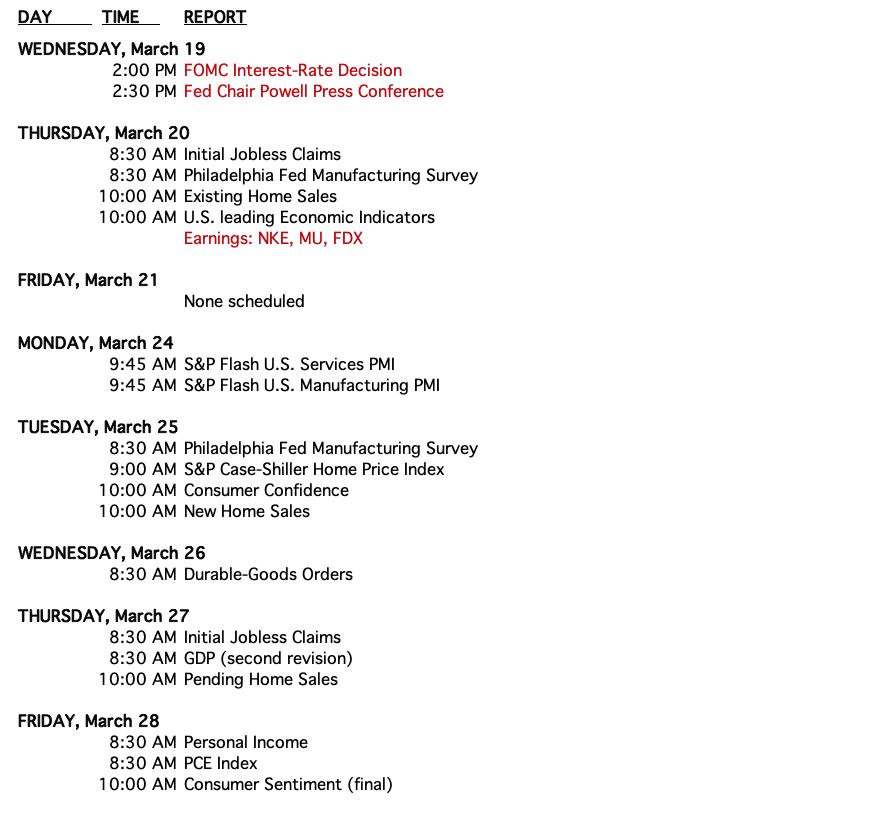
CALENDAR
Have you subscribed the DecisionPoint Diamonds yet? DP does the work for you by providing handpicked stocks/ETFs from exclusive DP scans! Add it with a discount! Contact support@decisionpoint.com for more information!
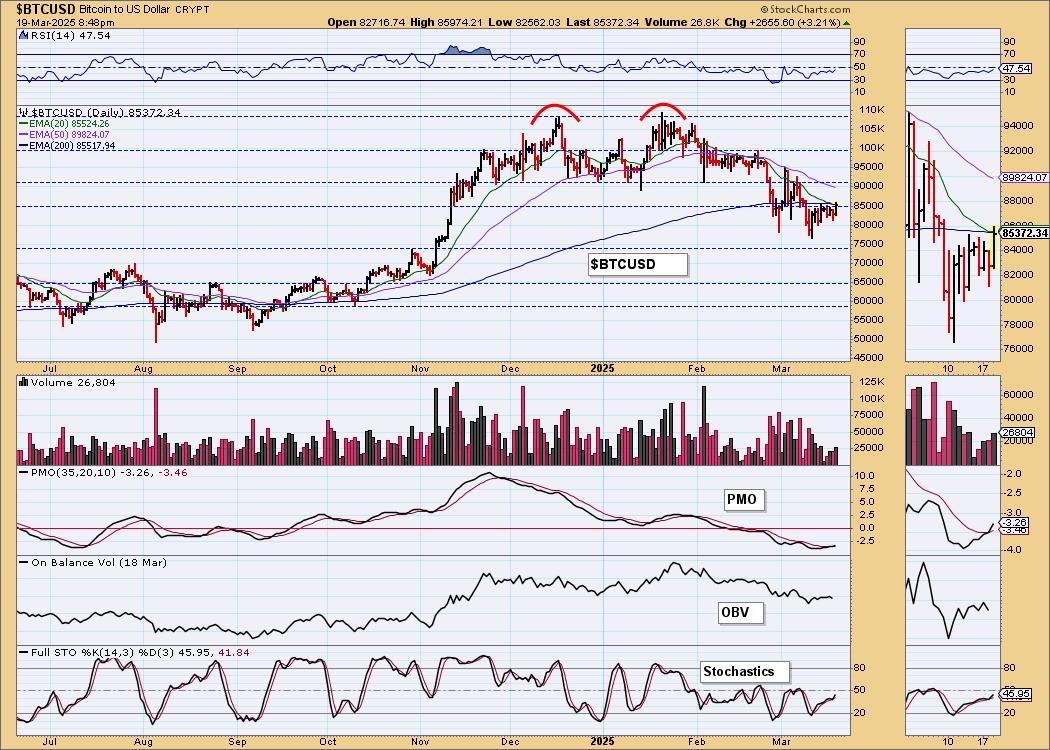
BITCOIN
Bitcoin rallied strongly today, but the declining trend out of the second top is still intact so we can't get overly bullish yet. Price challenged the 200-day EMA today but failed to close above it. The PMO looks better with its Crossover BUY Signal, but it is still in highly negative territory. Stochastics are rising, but are still in negative territory. We think we could see a move to 90,000.
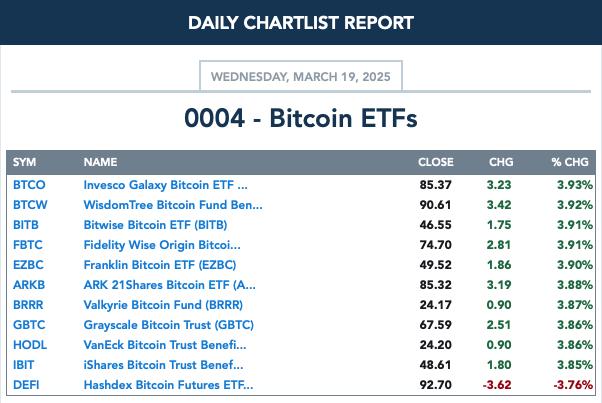
BITCOIN ETFs
INTEREST RATES
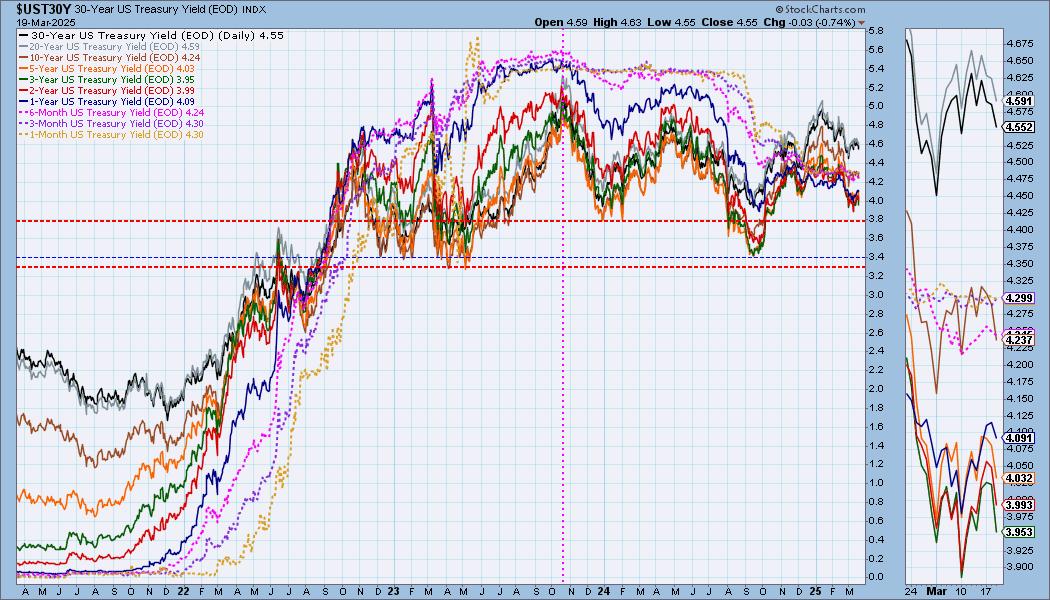
Yields are falling again as you can see in the thumbnail of our yield chart. Rising trends are being broken so we would expect yields to fall further.
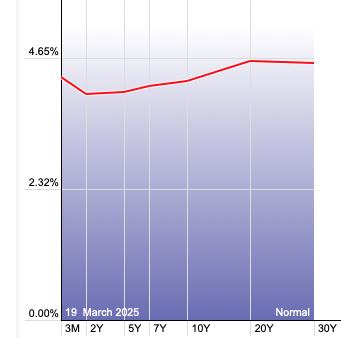
The Yield Curve Chart from StockCharts.com shows us the inversions taking place. The red line should move higher from left to right. Inversions are occurring where it moves downward.
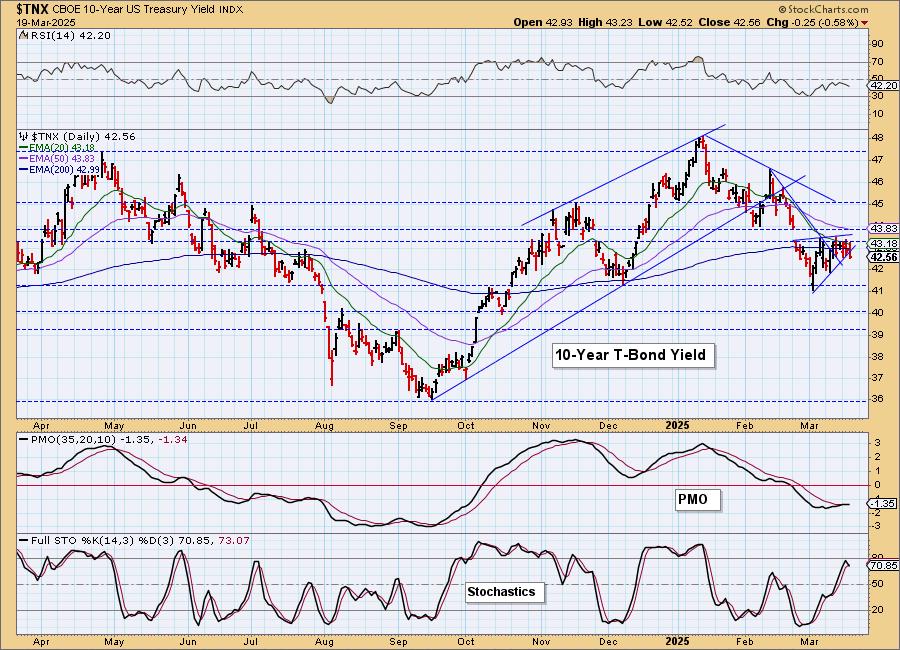
10-YEAR T-BOND YIELD
We got the expected breakdown from the bearish rising wedge today. The PMO has topped and triggered a new PMO Crossover SELL Signal. Stochastics have topped. We are looking for $TNX to drop to 4.1%.
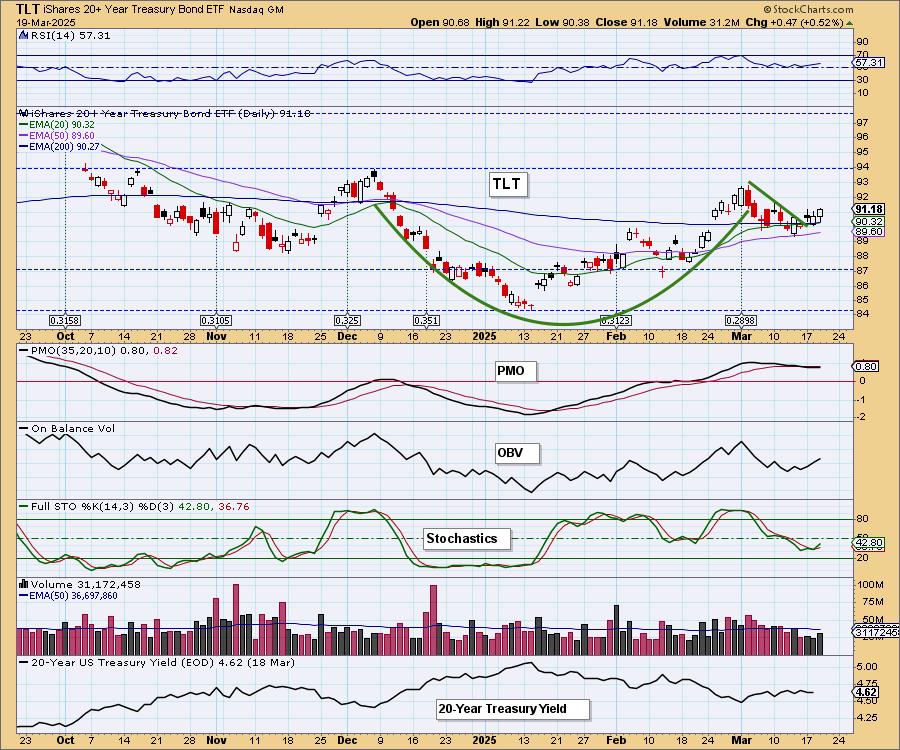
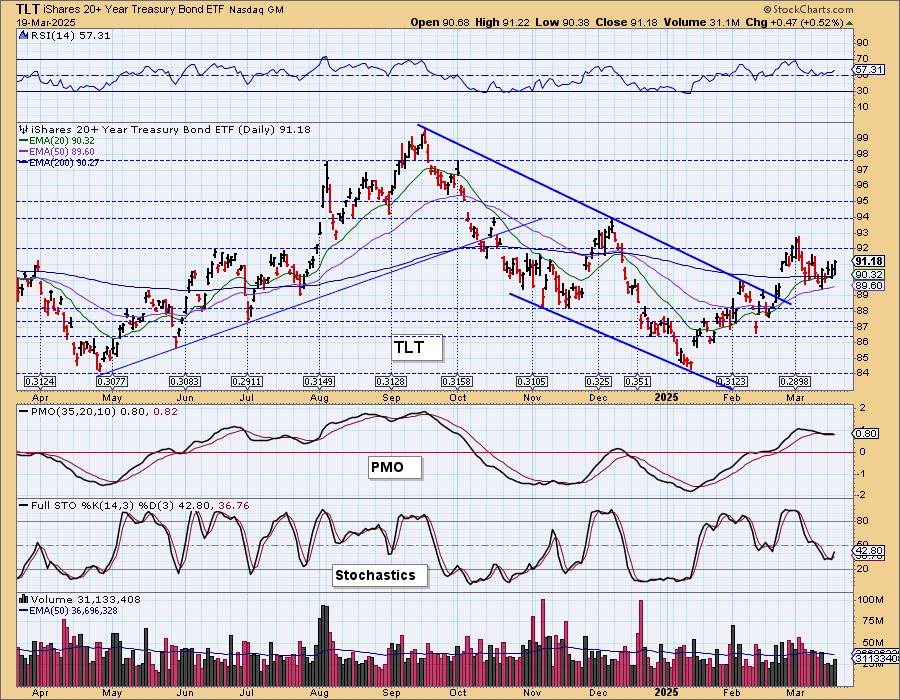
BONDS (TLT)
IT Trend Model: BUY as of 2/25/2025
LT Trend Model: SELL as of 12/13/2024
TLT Daily Chart: The bullish cup with handle pattern has essentially been confirmed with the small rally out of the declining trend of the handle. The PMO is flat and unresponsive, but we expect a Crossover BUY Signal any day now. Stochastics are rising again. Yields look somewhat bearish so we should see some more upside out of TLT.
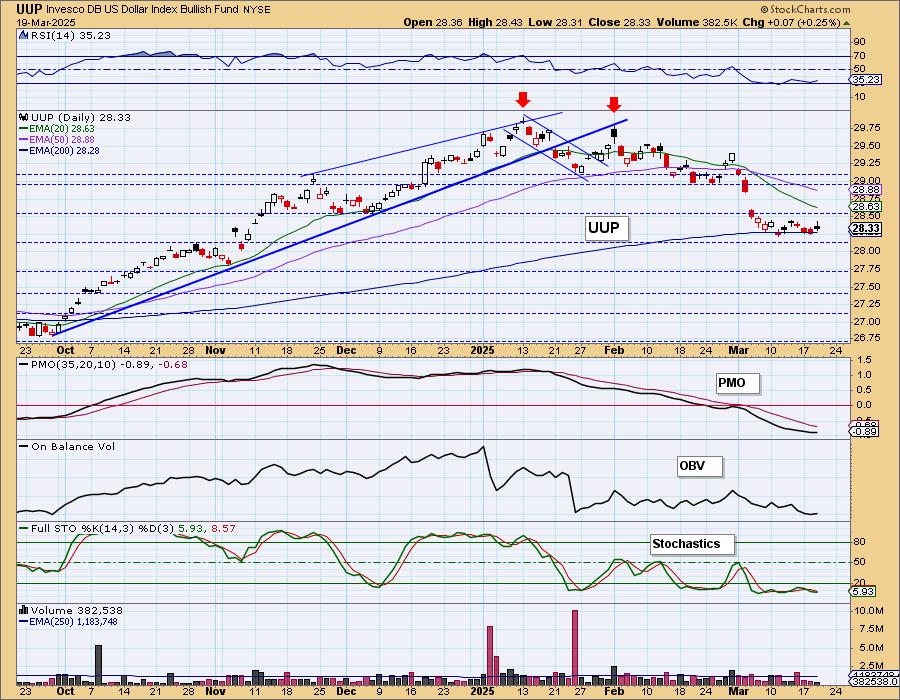
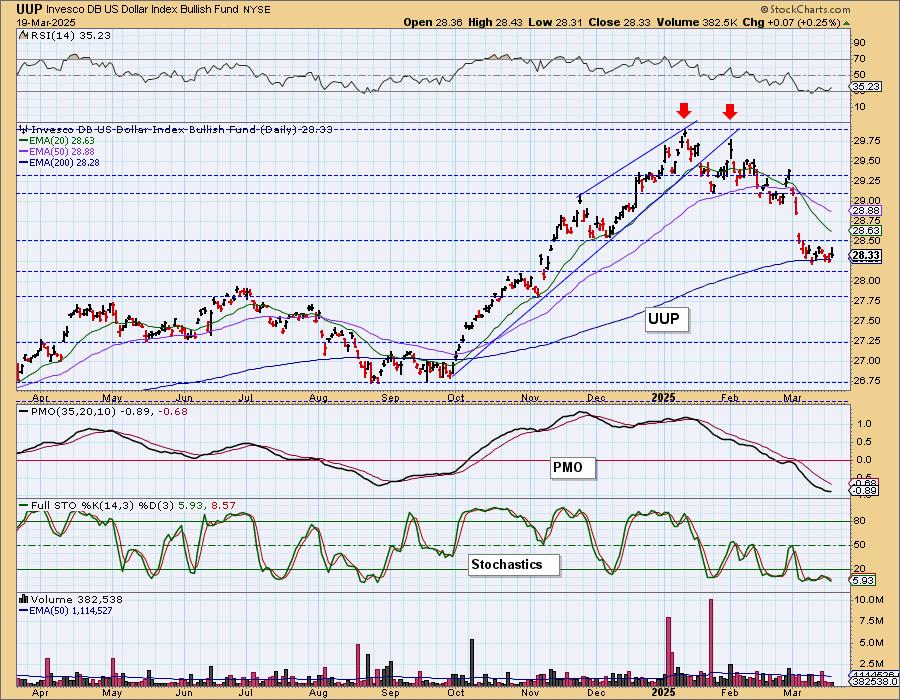
DOLLAR (UUP)
IT Trend Model: NEUTRAL as of 3/5/2025
LT Trend Model: BUY as of 5/25/2023
UUP Daily Chart: Yesterday's comments still apply:
"The Dollar reached support at the 200-day EMA and horizontal support at the October high. It isn't really going anywhere. Indicators are bearish with the PMO declining and Stochastics topping below 20. This support level is very vulnerable. We suspect we'll see some more sideways movement on the Dollar before a likely breakdown."
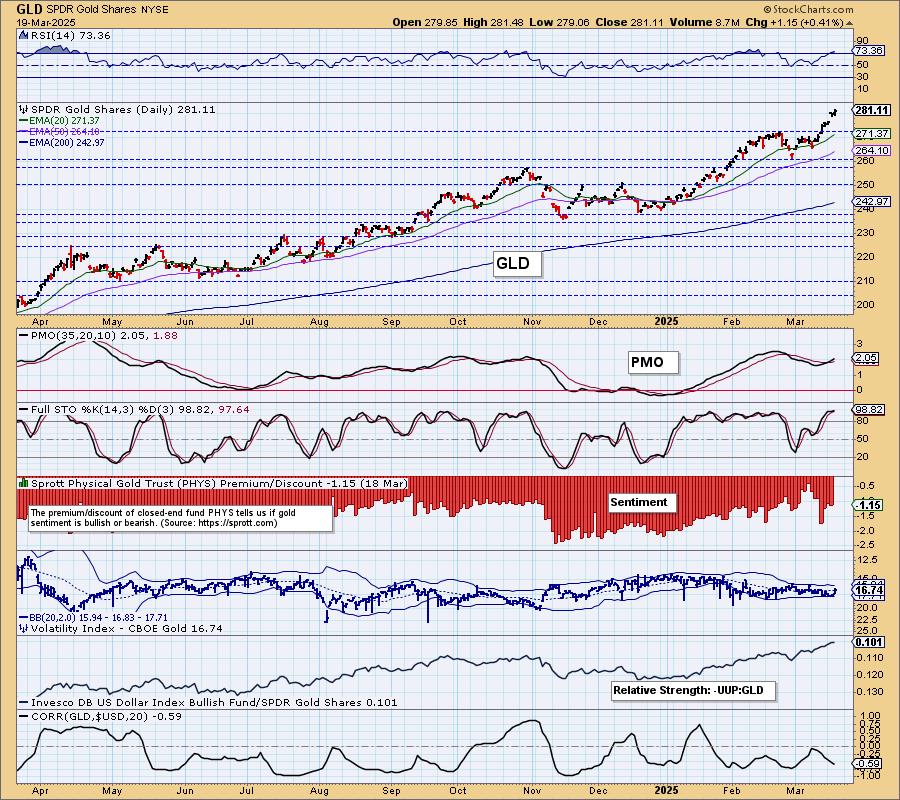
GOLD
IT Trend Model: BUY as of 1/10/2025
LT Trend Model: BUY as of 10/20/2023
GLD Daily Chart: Gold made yet another all-time high and more investors pile in. The RSI has now moved into overbought territory so it is time to look for some sort of pause. Indicators are very strong so any decline is likely to be tame unless the Dollar decides to rally and not breakdown. Relative strength still looks very strong.
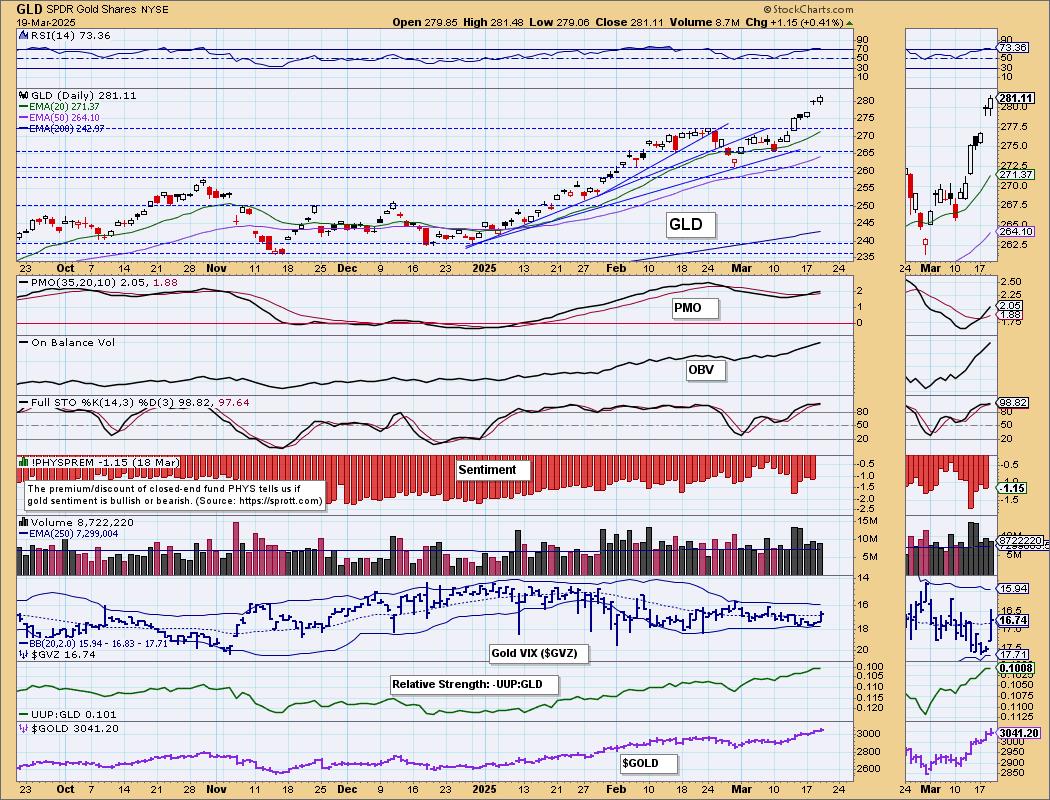
Discounts are somewhat elevated so that could keep the rally going a bit longer. They aren't at oversold extremes yet. We especially don't want them to get too low or disappear as that would mean sentiment would be too bullish and a decline could ensue. For now they are in what we'd call neutral territory.
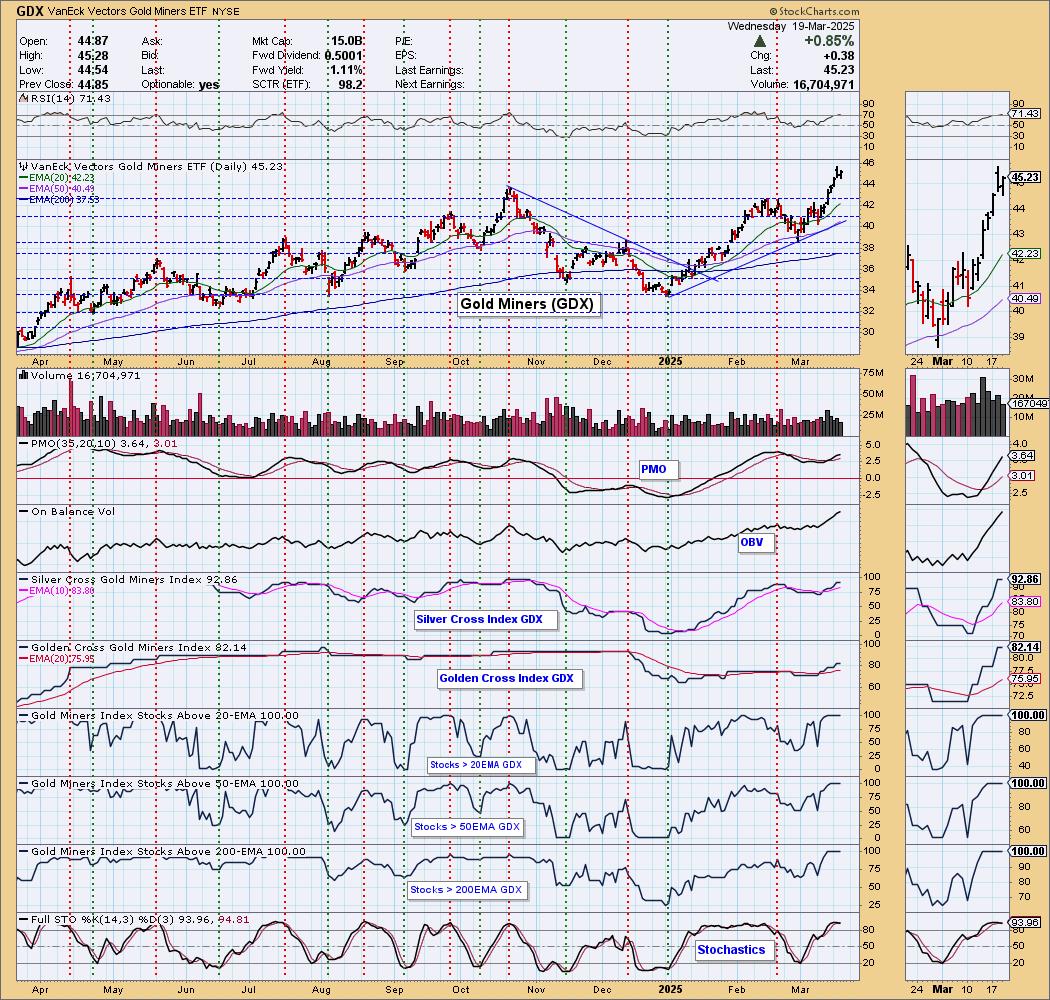
GOLD MINERS (GDX) Daily Chart: Gold Miners were up on the day, but essentially topped given we saw a lower high. It is time for Gold to take a breather and it is time for GDX to also take a breather as the RSI has gotten overbought. Still, under the hood they are incredibly strong so any decline would likely be minimal.
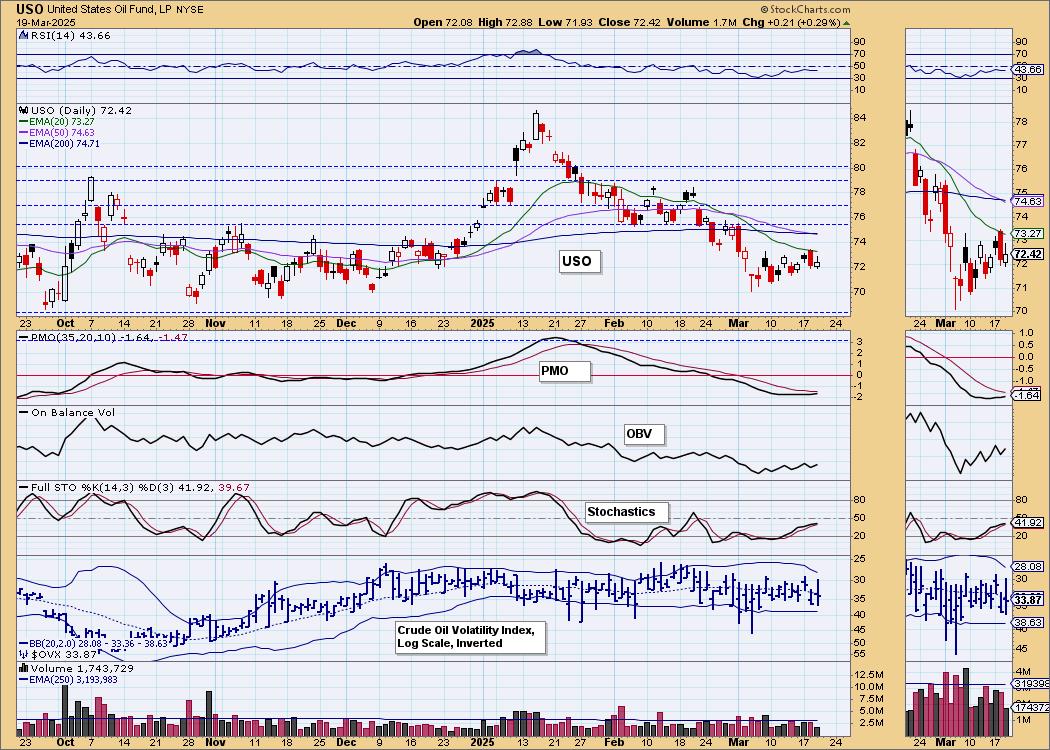
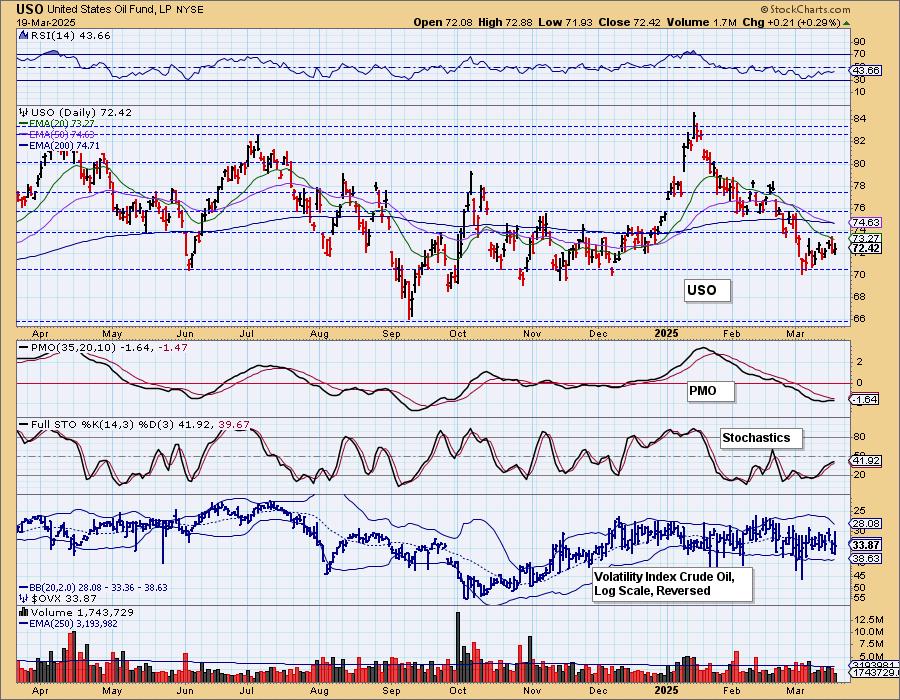
CRUDE OIL (USO)
IT Trend Model: NEUTRAL as of 2/27/2025
LT Trend Model: SELL as of 3/18/2025
USO Daily Chart: Crude Oil is on a nice little rising trend in the short-term, but we suspect it won't last as the PMO while turning up is still has a very negative reading and is mostly flat. Stochastics are very slowly rising. It isn't a big vote of confidence in our opinion. Yesterday's Death Cross also sets up a bearish backdrop. We could get a little more upside, but think it is highly vulnerable to decline.
Good Luck & Good Trading!
Erin Swenlin and Carl Swenlin
Technical Analysis is a windsock, not a crystal ball. --Carl Swenlin
(c) Copyright 2025 DecisionPoint.com
Disclaimer: This blog is for educational purposes only and should not be construed as financial advice. The ideas and strategies should never be used without first assessing your own personal and financial situation, or without consulting a financial professional. Any opinions expressed herein are solely those of the author, and do not in any way represent the views or opinions of any other person or entity.
DecisionPoint is not a registered investment advisor. Investment and trading decisions are solely your responsibility. DecisionPoint newsletters, blogs or website materials should NOT be interpreted as a recommendation or solicitation to buy or sell any security or to take any specific action.
NOTE: The signal status reported herein is based upon mechanical trading model signals, specifically, the DecisionPoint Trend Model. They define the implied bias of the price index based upon moving average relationships, but they do not necessarily call for a specific action. They are information flags that should prompt chart review. Further, they do not call for continuous buying or selling during the life of the signal. For example, a BUY signal will probably (but not necessarily) return the best results if action is taken soon after the signal is generated. Additional opportunities for buying may be found as price zigzags higher, but the trader must look for optimum entry points. Conversely, exit points to preserve gains (or minimize losses) may be evident before the model mechanically closes the signal.
Helpful DecisionPoint Links:
DecisionPoint Alert Chart List
DecisionPoint Golden Cross/Silver Cross Index Chart List
DecisionPoint Sector Chart List
Price Momentum Oscillator (PMO)