
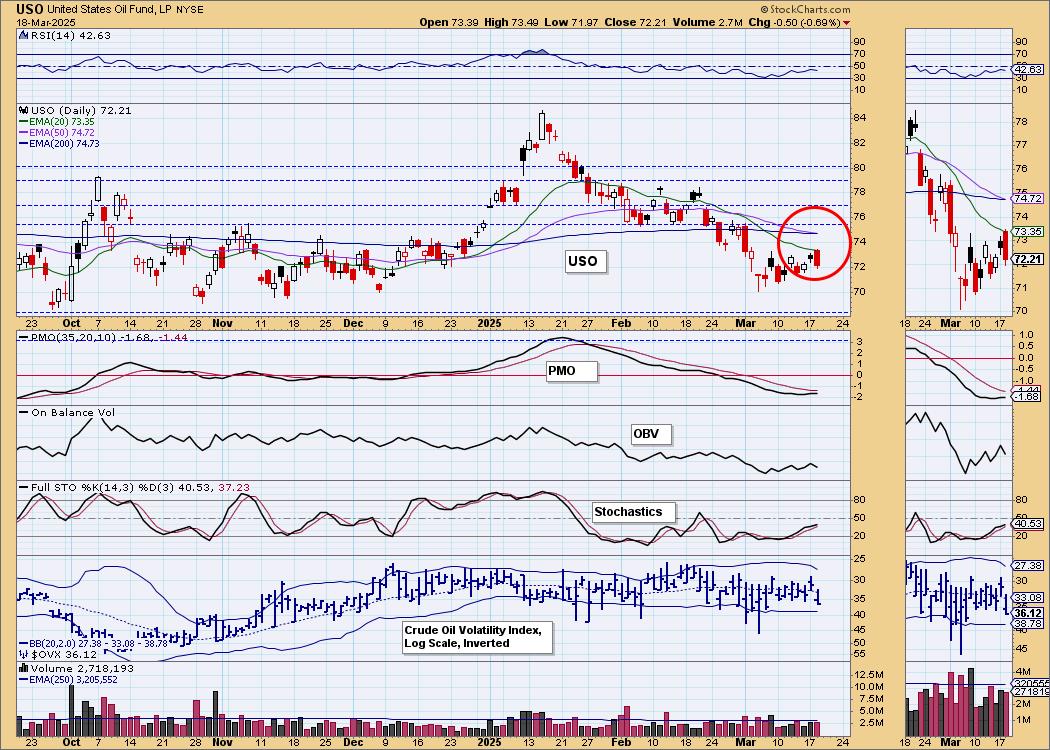
Today the Crude Oil ETF (USO) 50-day EMA crossed down through the 200-day EMA (Death Cross), generating an LT Trend Model SELL Signal. We will discuss this more thoroughly in the Crude Oil section below.
The DecisionPoint Alert Weekly Wrap presents an end-of-week assessment of the trend and condition of the Stock Market, the U.S. Dollar, Gold, Crude Oil, and Bonds. The DecisionPoint Alert daily report (Monday through Thursday) is abbreviated and gives updates on the Weekly Wrap assessments.
Watch the latest episode of DecisionPoint on our YouTube channel here!
MARKET/INDUSTRY GROUP/SECTOR INDEXES
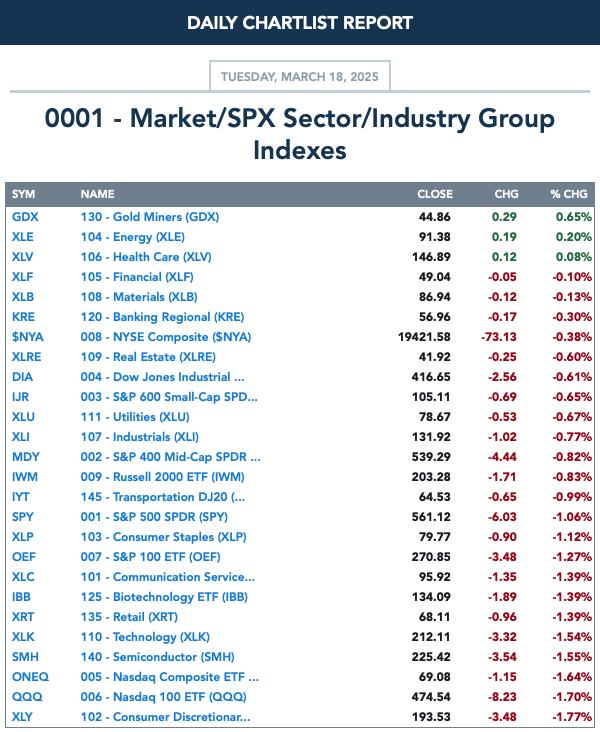
CLICK HERE for Carl's annotated Market Index, Sector, and Industry Group charts.
THE MARKET (S&P 500)
IT Trend Model: NEUTRAL as of 3/4/2025
LT Trend Model: BUY as of 3/29/2023
SPY 10-Minute Chart: We saw a sizable drop on the open, but price managed to hold up and not decline further all day long.
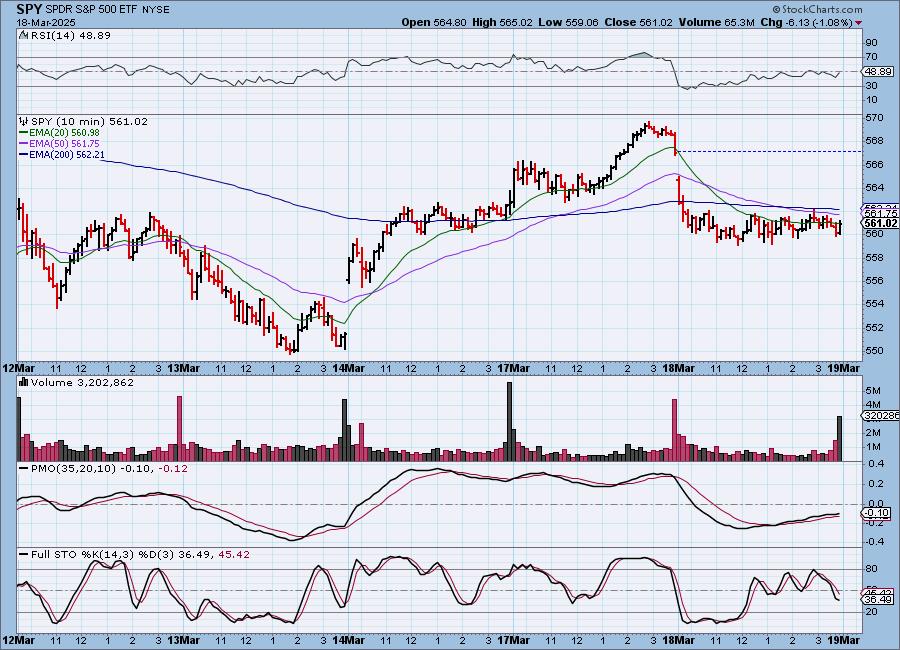
SPY Daily Chart: One thing that could be a problem is the formation of a bear flag. Yesterday's upside exhaustion climax did play out today, but we are looking for churn not necessarily another large decline. The PMO is flat, but technically still moving lower.
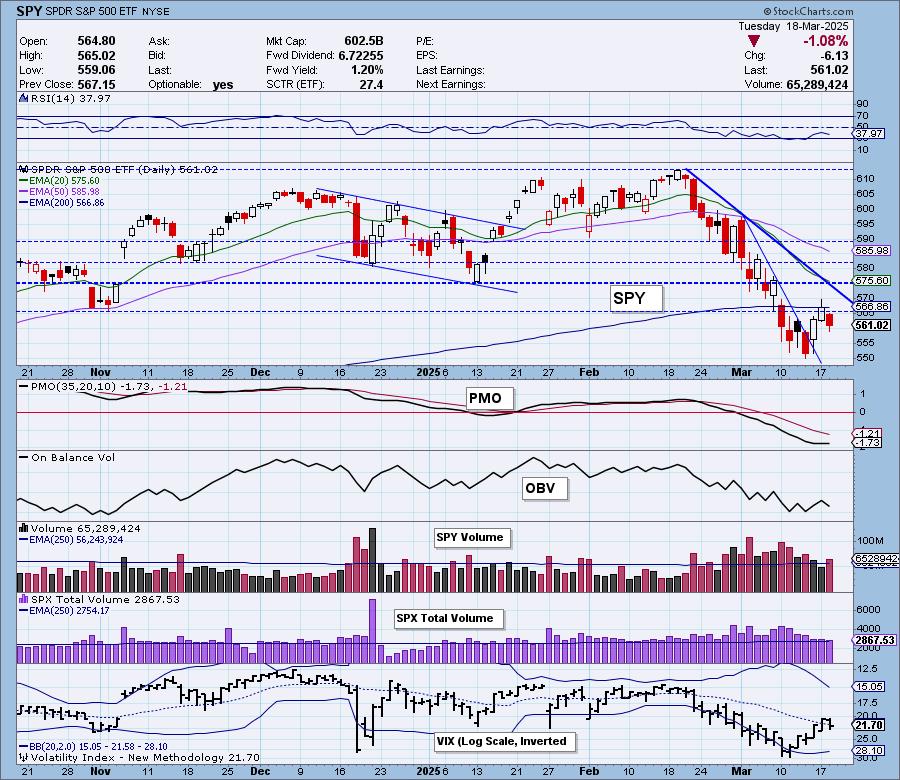
The VIX is still technically above its moving average on the inverted scale which is somewhat positive. We do like that Stochastics are continuing to rise. They are now back above 20. Notice that mega-caps continue to underperform equal-weight RSP. We need these guys to wake back up if this rally is to continue.

Here is the latest recording from 3/17. Click HERE to get to our video list.:
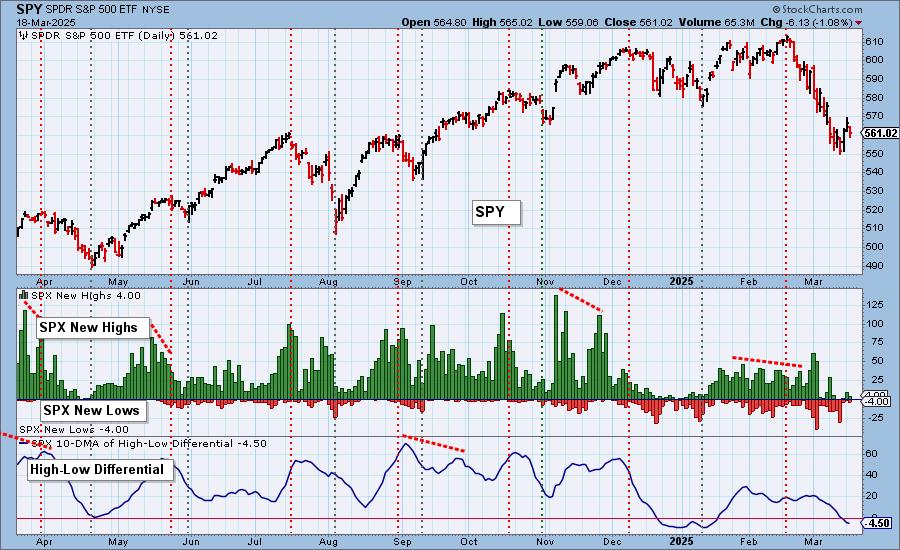
S&P 500 New 52-Week Highs/Lows: New Highs were lower as we would expect. We did see an expansion in New Lows but not a significant number. The High-Low Differential still looks very bearish below the zero line.
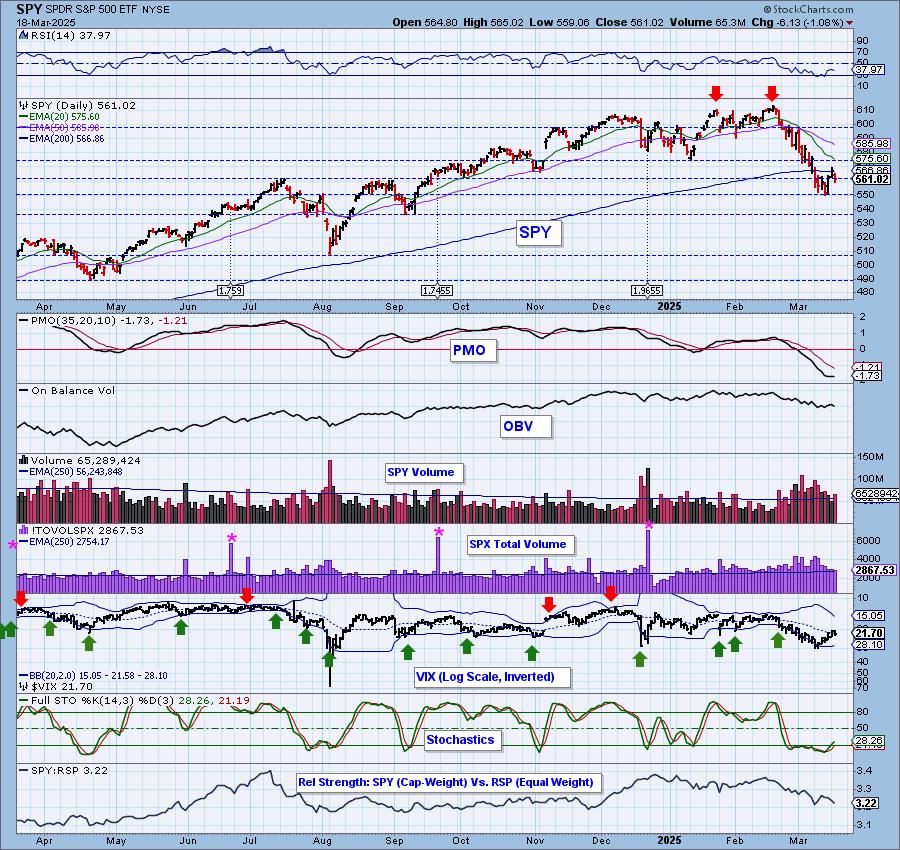
Climax* Analysis: Today there were no climax readings.
*A climax is a one-day event when market action generates very high readings in, primarily, breadth and volume indicators. We also include the VIX, watching for it to penetrate outside the Bollinger Band envelope. The vertical dotted lines mark climax days -- red for downside climaxes, and green for upside. Climaxes are at their core exhaustion events; however, at price pivots they may be initiating a change of trend.
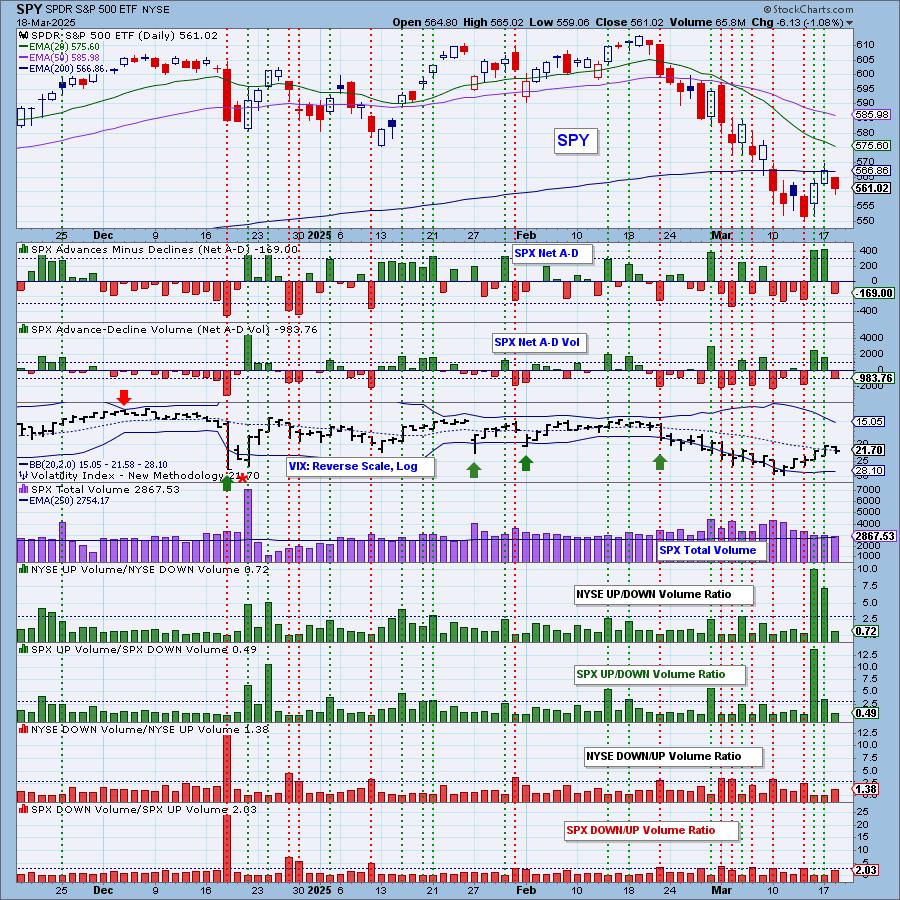
Short-Term Market Indicators: The short-term market trend is DOWN and the condition is NEUTRAL.
Swenlin Trading Oscillators (STOs) are both rising and are in positive territory now. Participation was hit today, but didn't decline a great deal. We lost a few rising PMOs. Not bad for an over 1% decline.
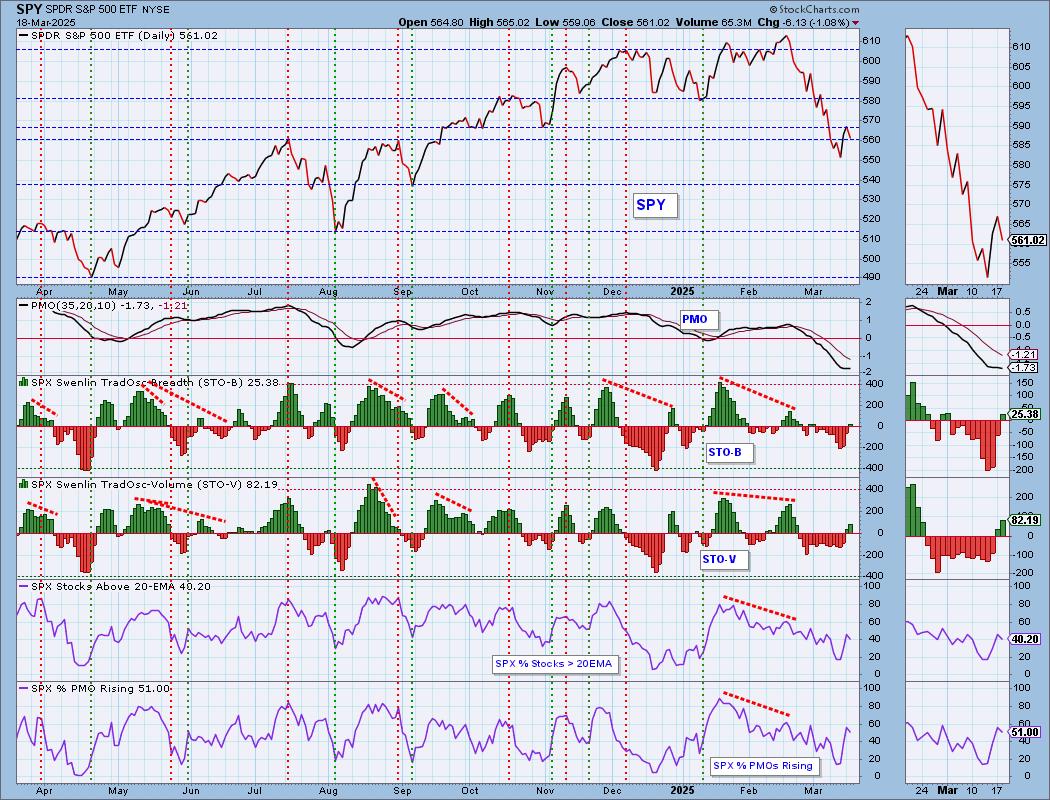
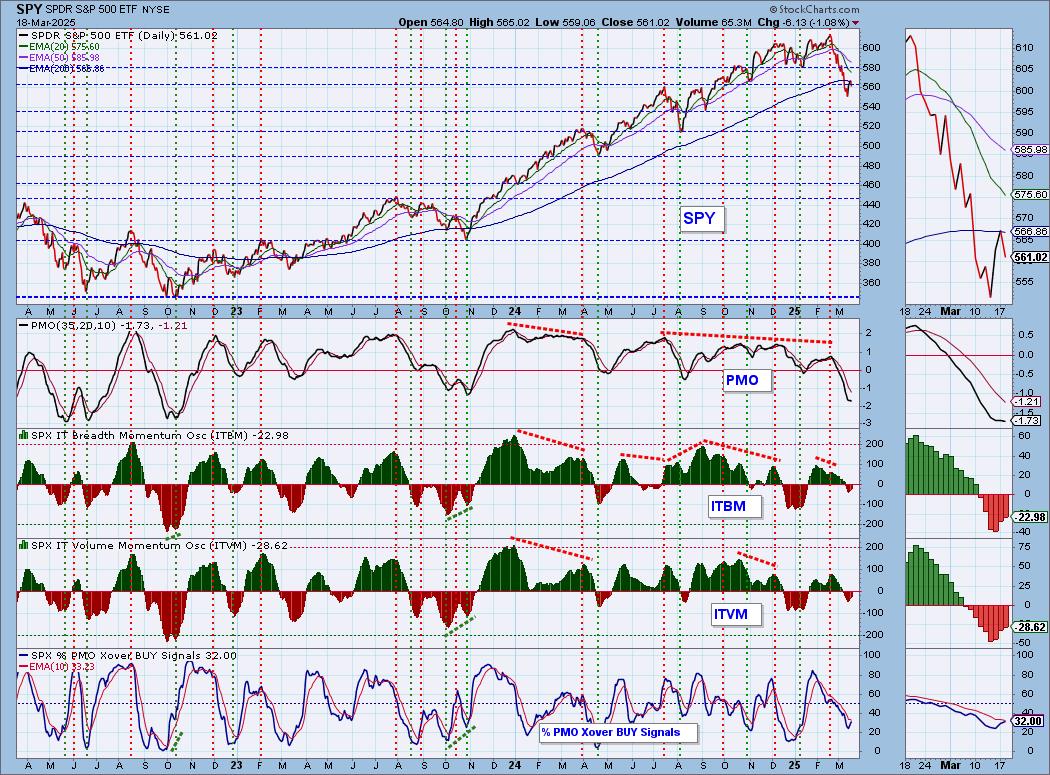
Intermediate-Term Market Indicators: The intermediate-term market trend is DOWN and the condition is NEUTRAL.
The ITBM and ITVM are still rising despite today's decline. We got a few more PMO BUY Signals. %PMO Xover BUY Signals is getting very close to moving above its signal line.
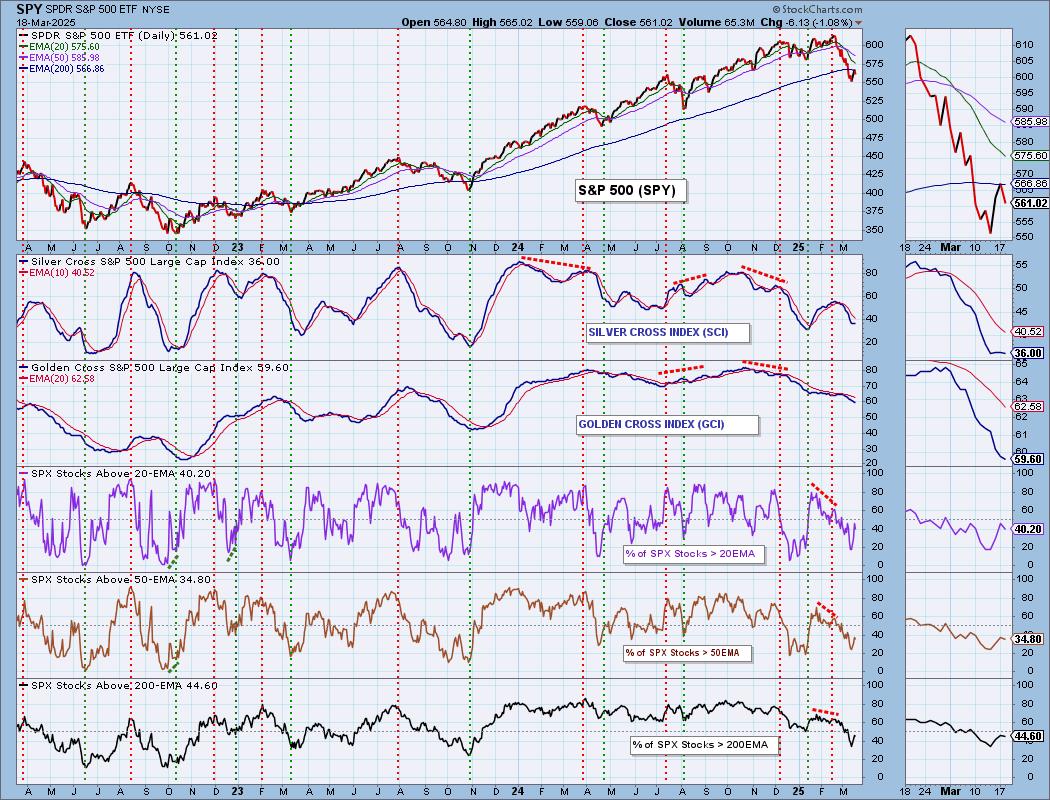
PARTICIPATION CHART (S&P 500): The following chart objectively shows the depth and trend of participation for the SPX in two time frames.
- Intermediate-Term - the Silver Cross Index (SCI) shows the percentage of SPX stocks on IT Trend Model BUY signals (20-EMA > 50-EMA). The opposite of the Silver Cross is a "Dark Cross" -- those stocks are, at the very least, in a correction.
- Long-Term - the Golden Cross Index (GCI) shows the percentage of SPX stocks on LT Trend Model BUY signals (50-EMA > 200-EMA). The opposite of a Golden Cross is the "Death Cross" -- those stocks are in a bear market.
The market bias is BEARISH in the intermediate- and long-term timeframes.
We still have declining trends on participation, but we do note that we didn't lose a great deal of stocks above key moving averages on today's decline. The Silver Cross Index wants to turn back up, but remains below its signal line so the IT Bias is BEARISH. The Golden Cross Index is still in decline. It is below its signal line so the LT Bias is BEARISH.
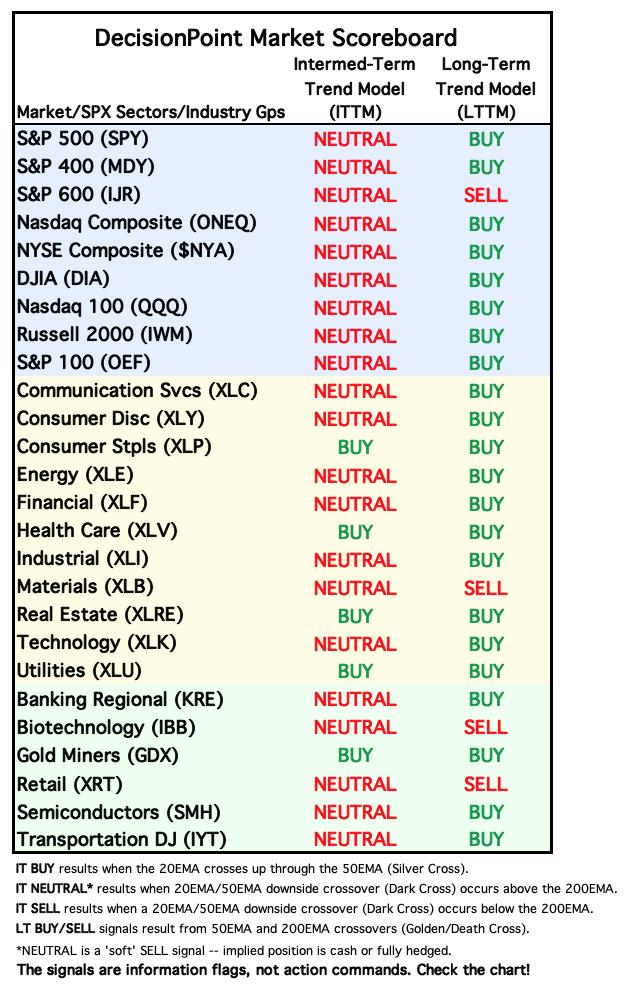
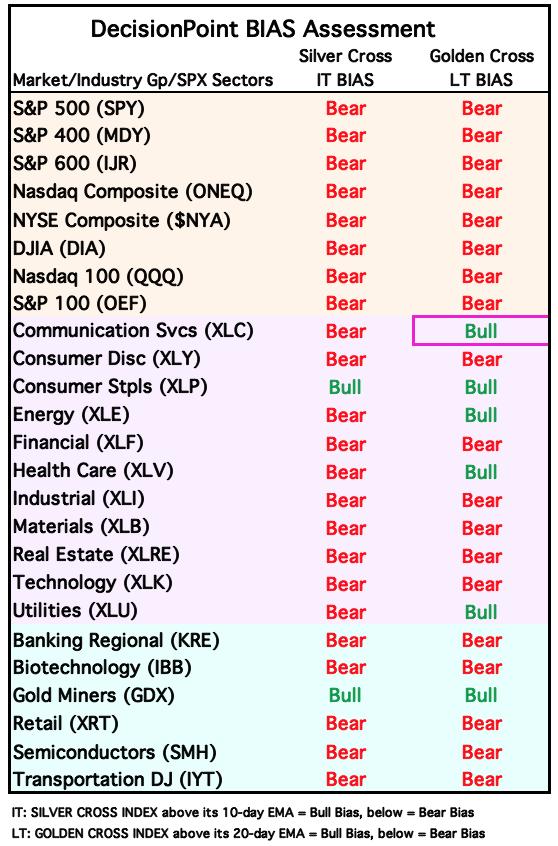
BIAS Assessment: The following table expresses the current BIAS of various price indexes based upon the relationship of the Silver Cross Index to its 10-day EMA (intermediate-term), and of the Golden Cross Index to its 20-day EMA (long-term). When the Index is above the EMA it is bullish, and it is bearish when the Index is below the EMA. The BIAS does not imply that any particular action should be taken. It is information to be used in the decision process.
The items with highlighted borders indicate that the BIAS changed today.
*****************************************************************************************************
CONCLUSION: Yesterday's upside exhaustion climax did fulfill with a decline today, but as we noted yesterday, we are looking for more churn not necessarily a strong resumption of the rally. The STOs and ITBM/ITVM are still on the rise which bodes well for a rally resumption. We also didn't see the bottom drop out today after the initial decline. However, we are on the lookout for a Bear Market now so we aren't thinking a rally will be lasting, it could turn into a bull trap so proceed with caution. Tomorrow we get the FOMC interest rate decision. It is expected that no rate changes will occur, but language could be an issue depending on Chairman Powell's remarks.
Erin is 20% long, 0% short. (This is intended as information, not a recommendation.)
*****************************************************************************************************
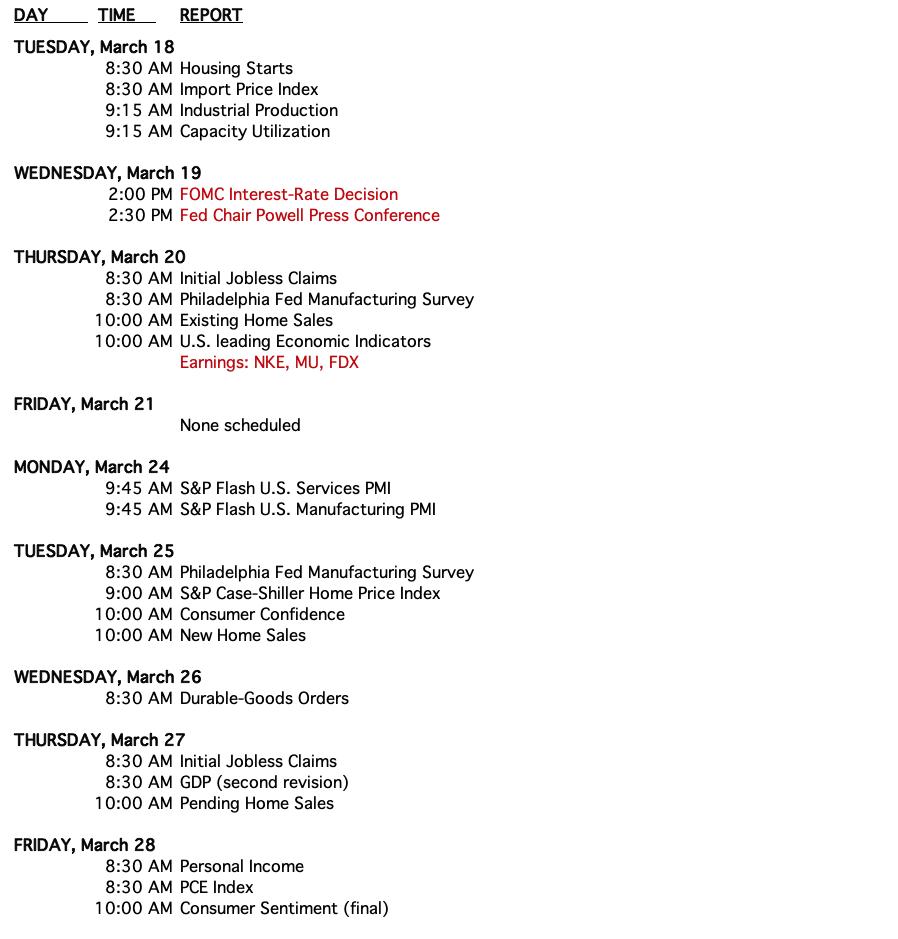
CALENDAR
Have you subscribed the DecisionPoint Diamonds yet? DP does the work for you by providing handpicked stocks/ETFs from exclusive DP scans! Add it with a discount! Contact support@decisionpoint.com for more information!
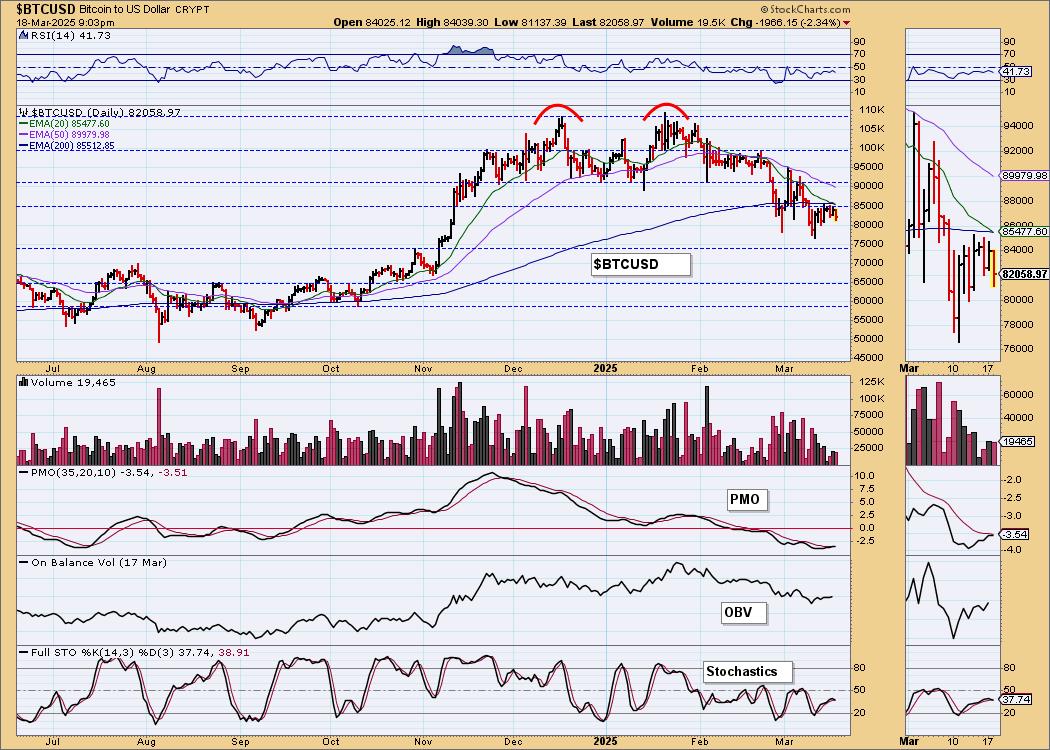
BITCOIN
Price is holding onto the declining trend out of the bearish double top. The PMO is still making its way toward a Crossover BUY Signal, but we have Stochastics turning down. In the thumbnail we can see that the short-term rising trend was broken with today's decline. We are bearish despite the PMO. The PMO is reading very negative so a rise is only suggesting some diminishing weakness. Price action however is bearish.
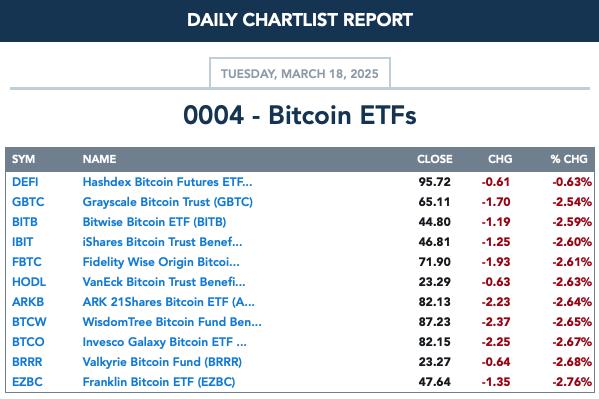
BITCOIN ETFs
INTEREST RATES
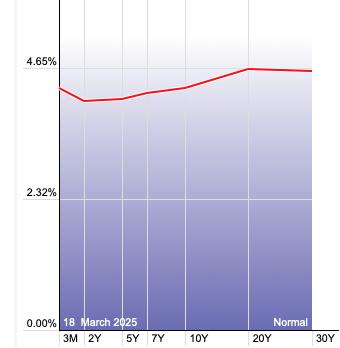
Looking in the thumbnail we can see that rising trends are vulnerable. We should be on the lookout for rates to begin falling again.
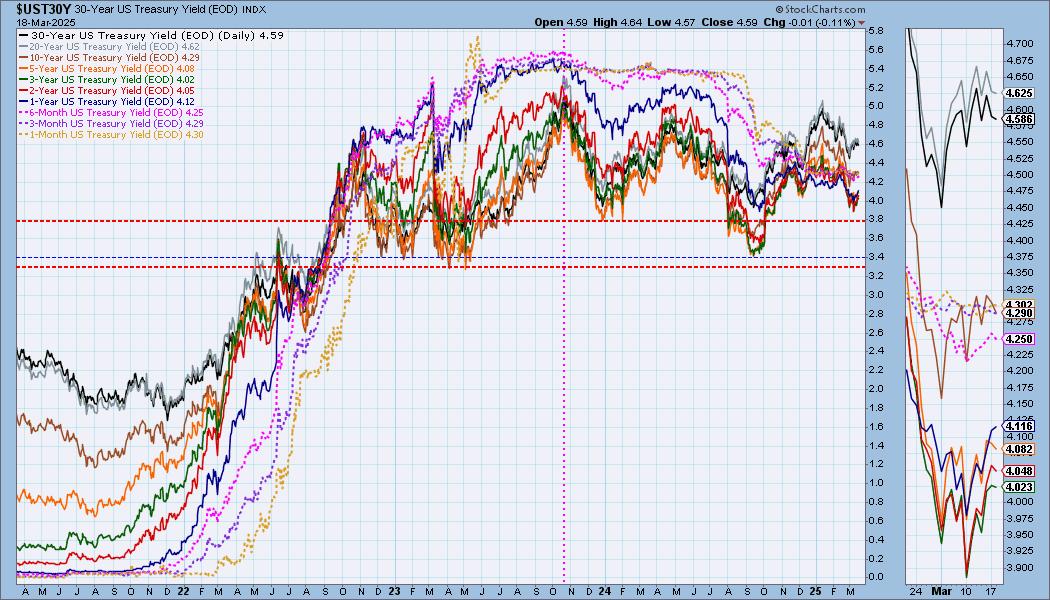
The Yield Curve Chart from StockCharts.com shows us the inversions taking place. The red line should move higher from left to right. Inversions are occurring where it moves downward.
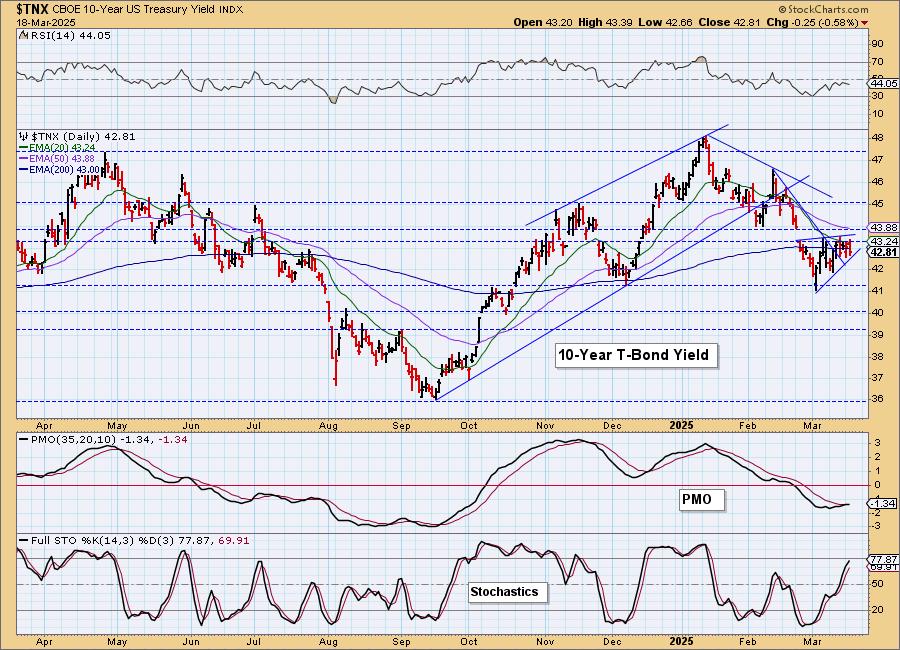
10-YEAR T-BOND YIELD
We have a short-term rising trend that is holding up for now. However, it forms the bottom of a bearish rising wedge which suggests a breakdown, not a breakout. The PMO tells us that it isn't out of the question that $TNX will advance higher. Stochastics are also very positive. Still, overhead resistance looks very strong.
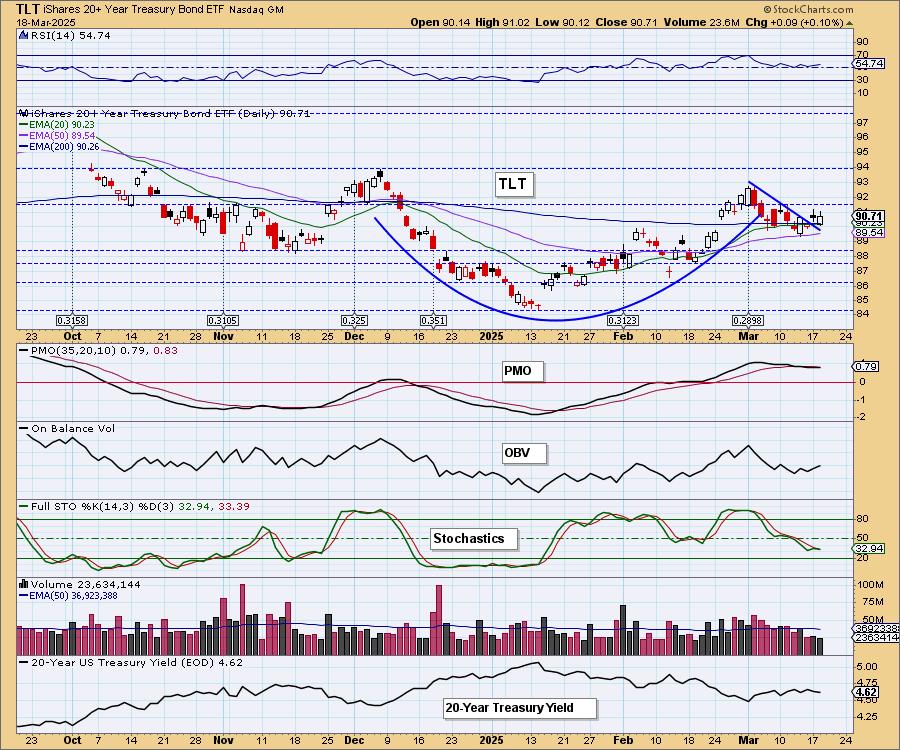
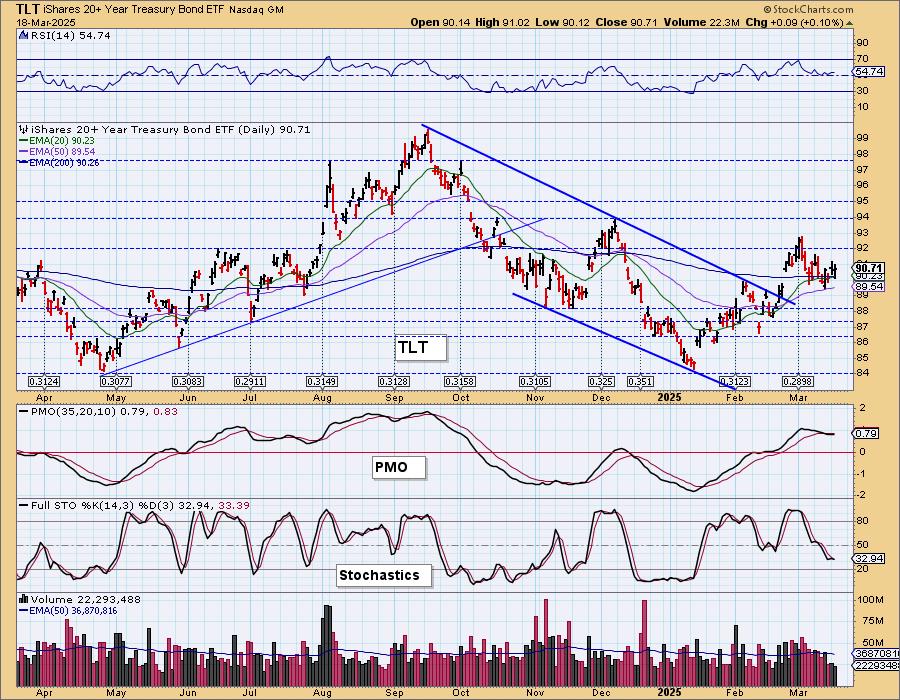
BONDS (TLT)
IT Trend Model: BUY as of 2/25/2025
LT Trend Model: SELL as of 12/13/2024
TLT Daily Chart: The indicators are still reading bearish for TLT, but we see a bullish cup with handle pattern that does imply we'll see more upside on Bonds. Still, Stochastics have turned over in negative territory so we should proceed with caution.
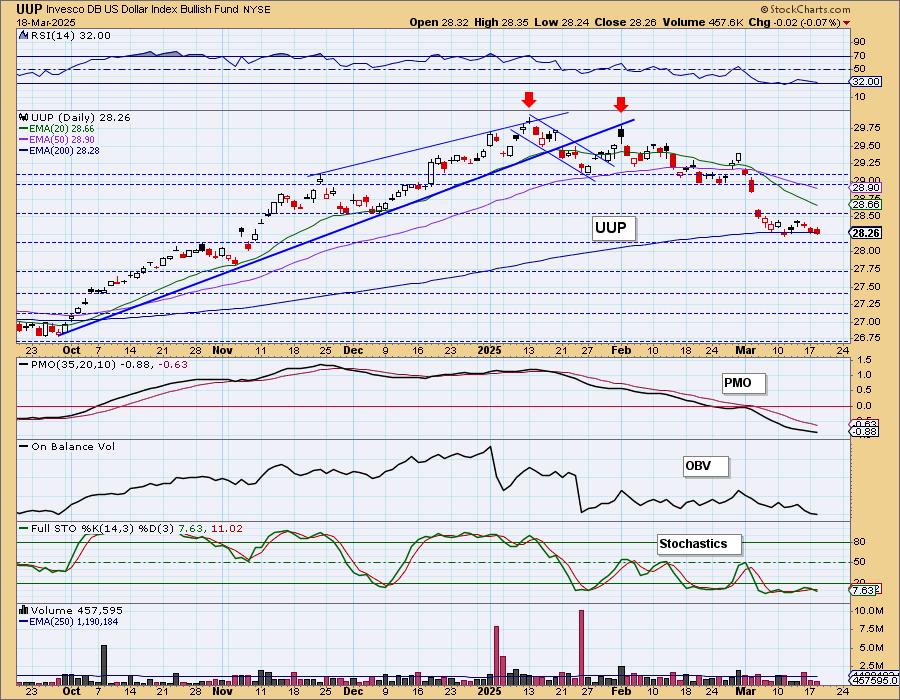
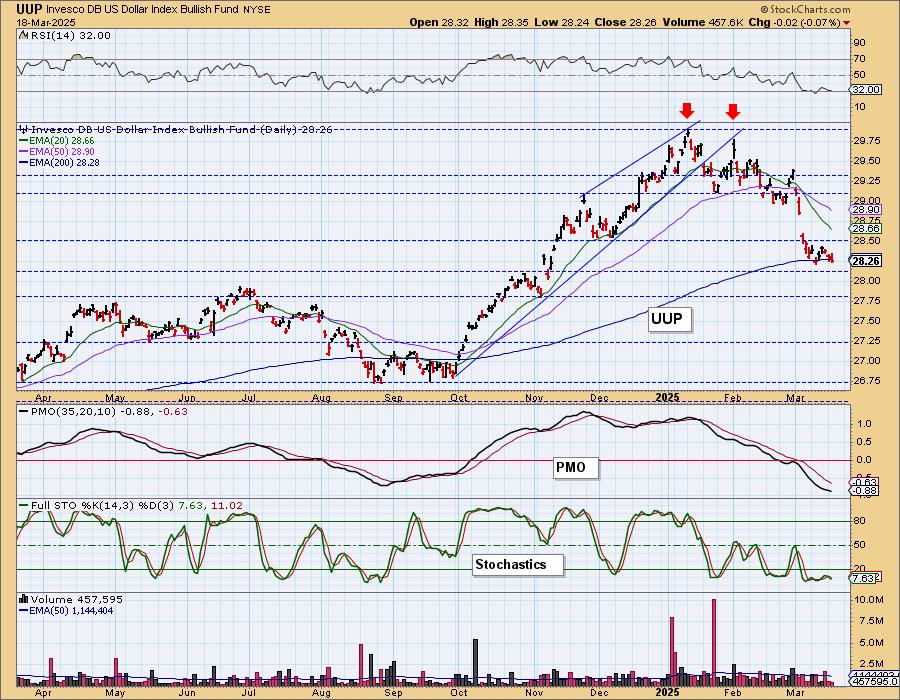
DOLLAR (UUP)
IT Trend Model: NEUTRAL as of 3/5/2025
LT Trend Model: BUY as of 5/25/2023
UUP Daily Chart: Yesterday's comments still apply:
"The Dollar reached support at the 200-day EMA and horizontal support at the October high. It isn't really going anywhere. Indicators are bearish with the PMO declining and Stochastics topping below 20. This support level is very vulnerable. We suspect we'll see some more sideways movement on the Dollar before a likely breakdown."
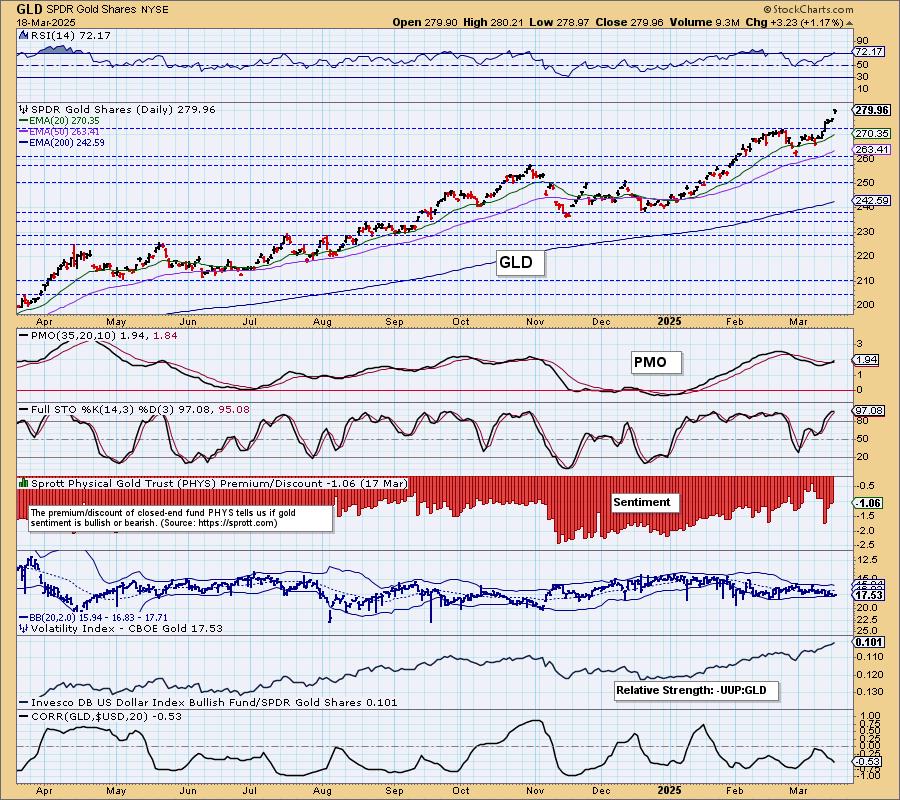
GOLD
IT Trend Model: BUY as of 1/10/2025
LT Trend Model: BUY as of 10/20/2023
GLD Daily Chart: Gold leapt higher as the Dollar lost ground today. It was up far higher than the Dollar was down so we have quite a few buyers coming in as investors worry about the market's direction and the economy as a whole. Everything is going right on the chart so we would expect higher prices to continue.
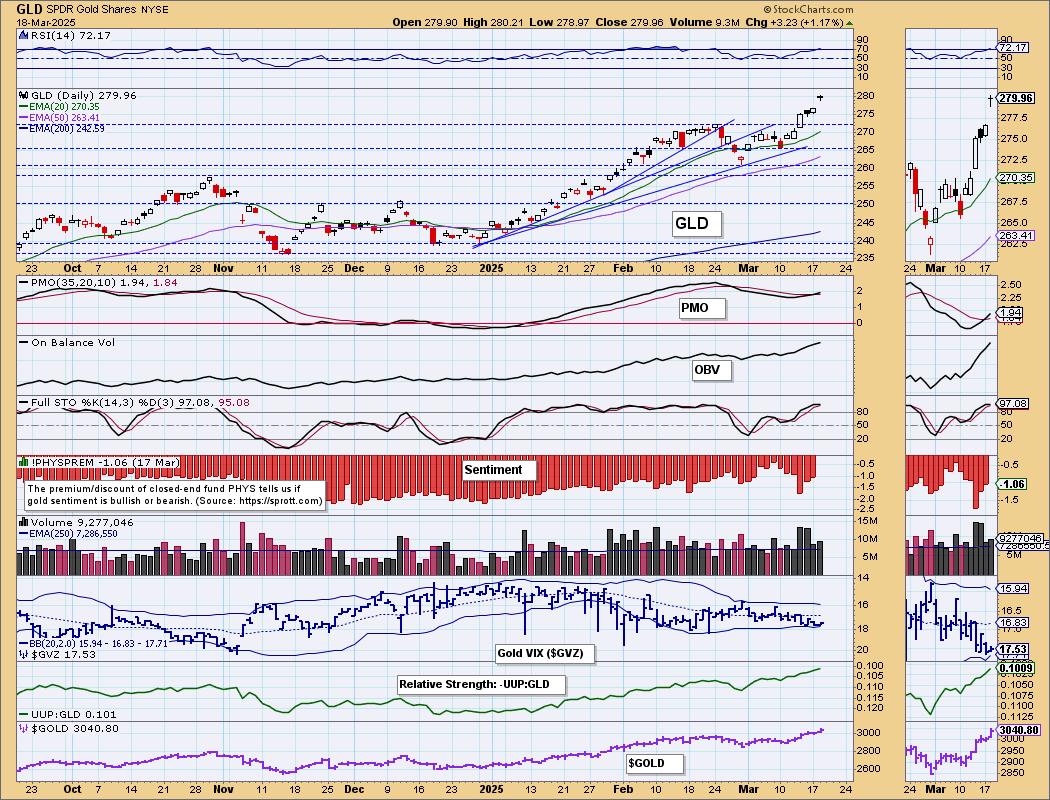
The correlation between Gold and the Dollar is moving toward its natural inverse relationship. With the Dollar looking weak, this correlation will continue to work in Gold's favor.
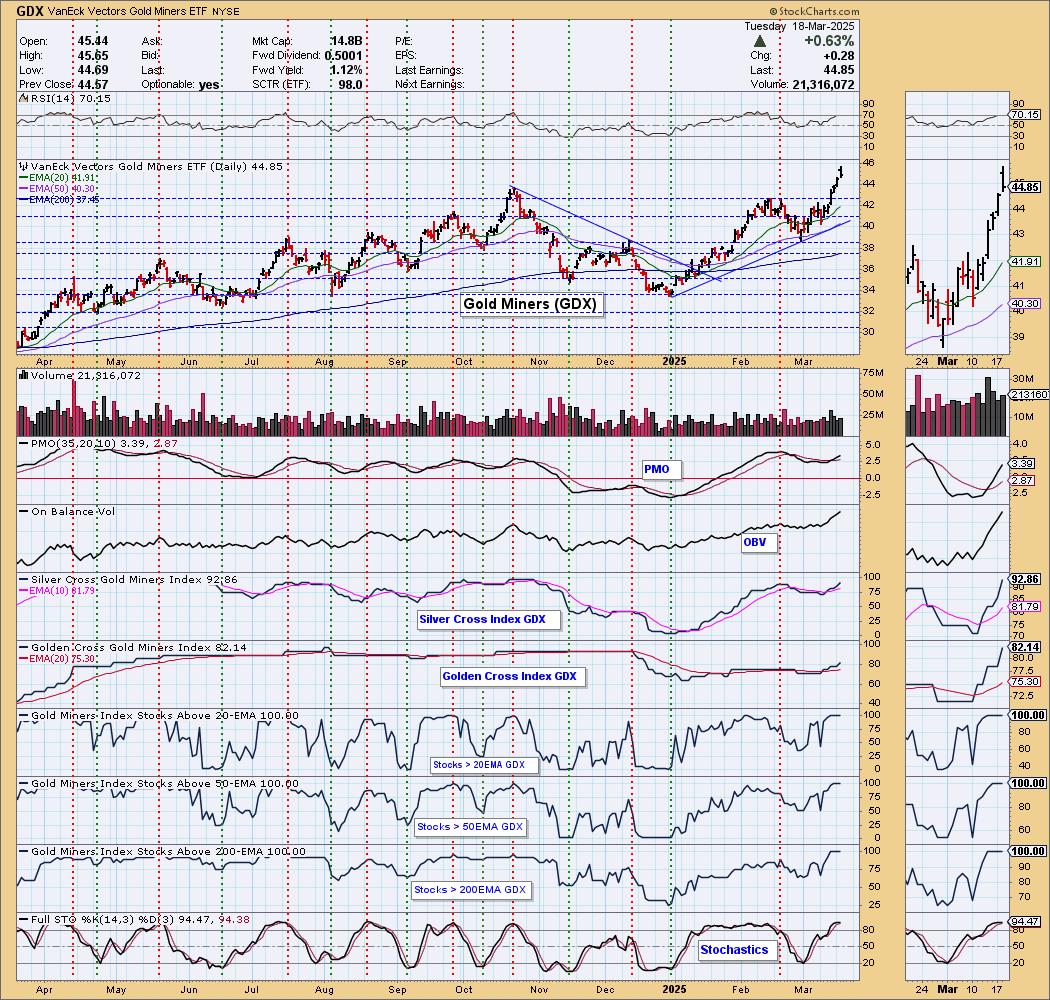
GOLD MINERS (GDX) Daily Chart: With Gold powering higher, Gold Miners are enjoying quite a rally and given the positive outlook for Gold, that should continue. Clearly participation is overbought with 100% readings and a Silver Cross Index near 100%. These conditions could easily persist given the strong bull market miners are in. It appears there is even more upside ahead for Gold Miners.
CRUDE OIL (USO)
IT Trend Model: NEUTRAL as of 2/27/2025
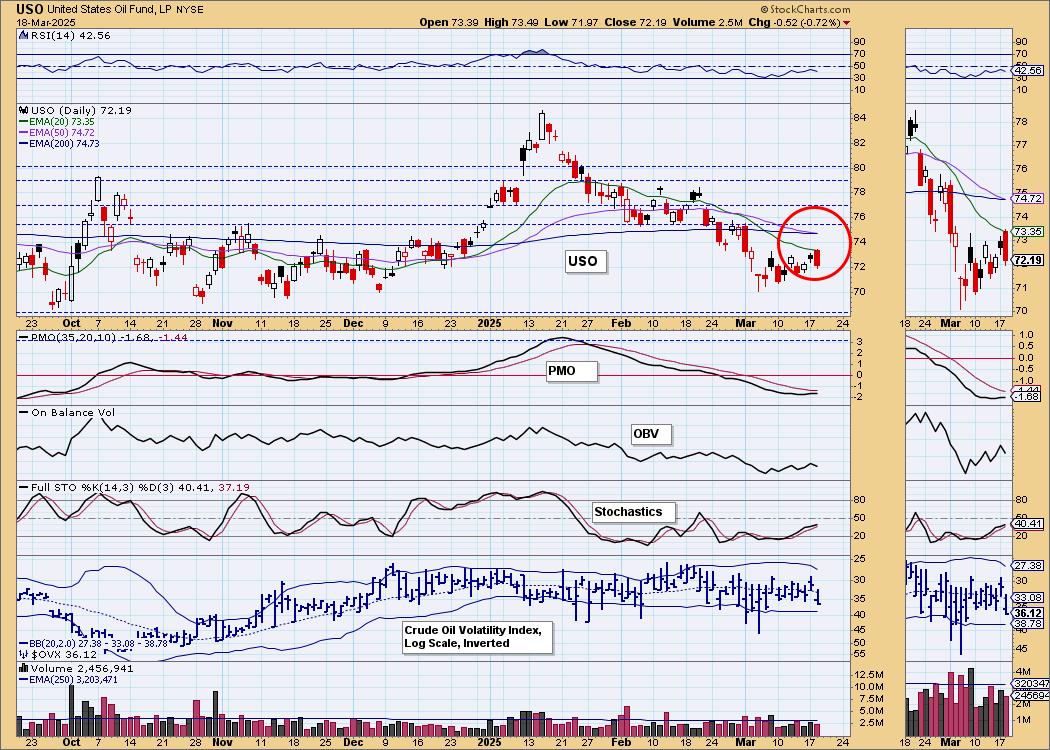
LT Trend Model: SELL as of 3/18/2025
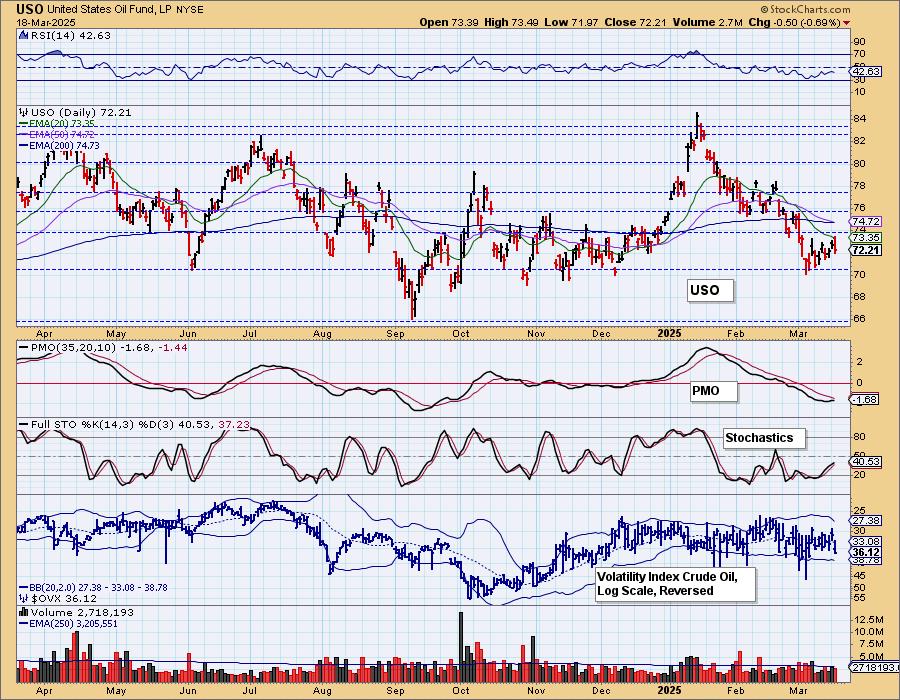
USO Daily Chart: Today the Crude Oil ETF (USO) 50-day EMA crossed down through the 200-day EMA (Death Cross), generating an LT Trend Model SELL Signal. This is not a very compelling signal because USO has been in a trading range for about three years, so the moving averages have drifted very close together, and signal changes are easier to come by. We do have a short-term rising trend, but today saw a bearish engulfing candlestick that does imply we'll see a decline tomorrow. Price is bouncing off support and the PMO is rising so we could see a little more upside near-term in spite of today's Death Cross.
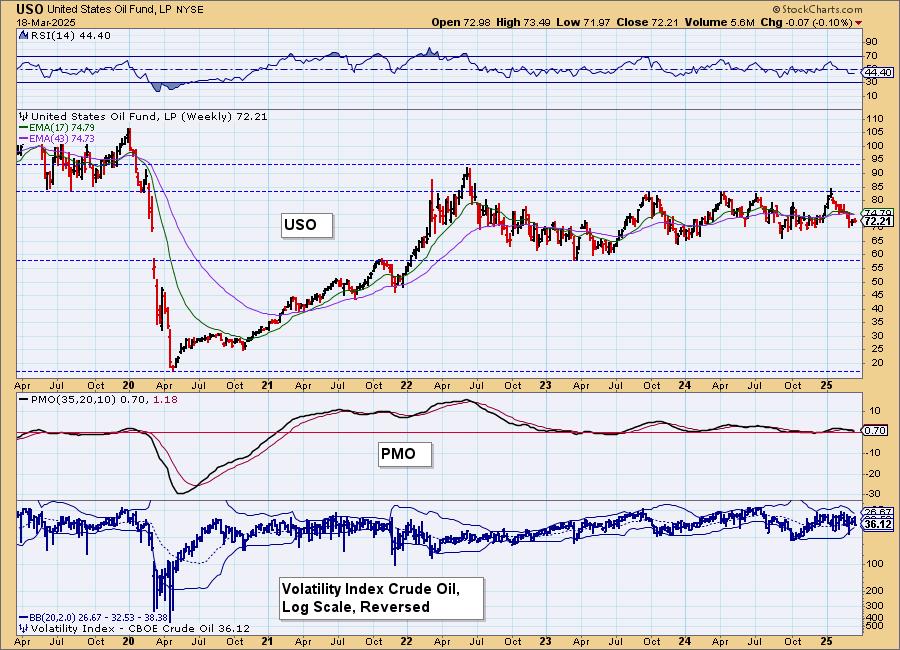
USO Weekly Chart: Here you can see the long-term trading range that Crude is in. It is near lows that could lead to an upside move to the top of the trading range, but the weekly PMO is on a new Crossover SELL Signal so we don't think it will make it back to the top of the range yet.
Good Luck & Good Trading!
Erin Swenlin and Carl Swenlin
Technical Analysis is a windsock, not a crystal ball. --Carl Swenlin
(c) Copyright 2025 DecisionPoint.com
Disclaimer: This blog is for educational purposes only and should not be construed as financial advice. The ideas and strategies should never be used without first assessing your own personal and financial situation, or without consulting a financial professional. Any opinions expressed herein are solely those of the author, and do not in any way represent the views or opinions of any other person or entity.
DecisionPoint is not a registered investment advisor. Investment and trading decisions are solely your responsibility. DecisionPoint newsletters, blogs or website materials should NOT be interpreted as a recommendation or solicitation to buy or sell any security or to take any specific action.
NOTE: The signal status reported herein is based upon mechanical trading model signals, specifically, the DecisionPoint Trend Model. They define the implied bias of the price index based upon moving average relationships, but they do not necessarily call for a specific action. They are information flags that should prompt chart review. Further, they do not call for continuous buying or selling during the life of the signal. For example, a BUY signal will probably (but not necessarily) return the best results if action is taken soon after the signal is generated. Additional opportunities for buying may be found as price zigzags higher, but the trader must look for optimum entry points. Conversely, exit points to preserve gains (or minimize losses) may be evident before the model mechanically closes the signal.
Helpful DecisionPoint Links:
DecisionPoint Alert Chart List
DecisionPoint Golden Cross/Silver Cross Index Chart List
DecisionPoint Sector Chart List
Price Momentum Oscillator (PMO)