
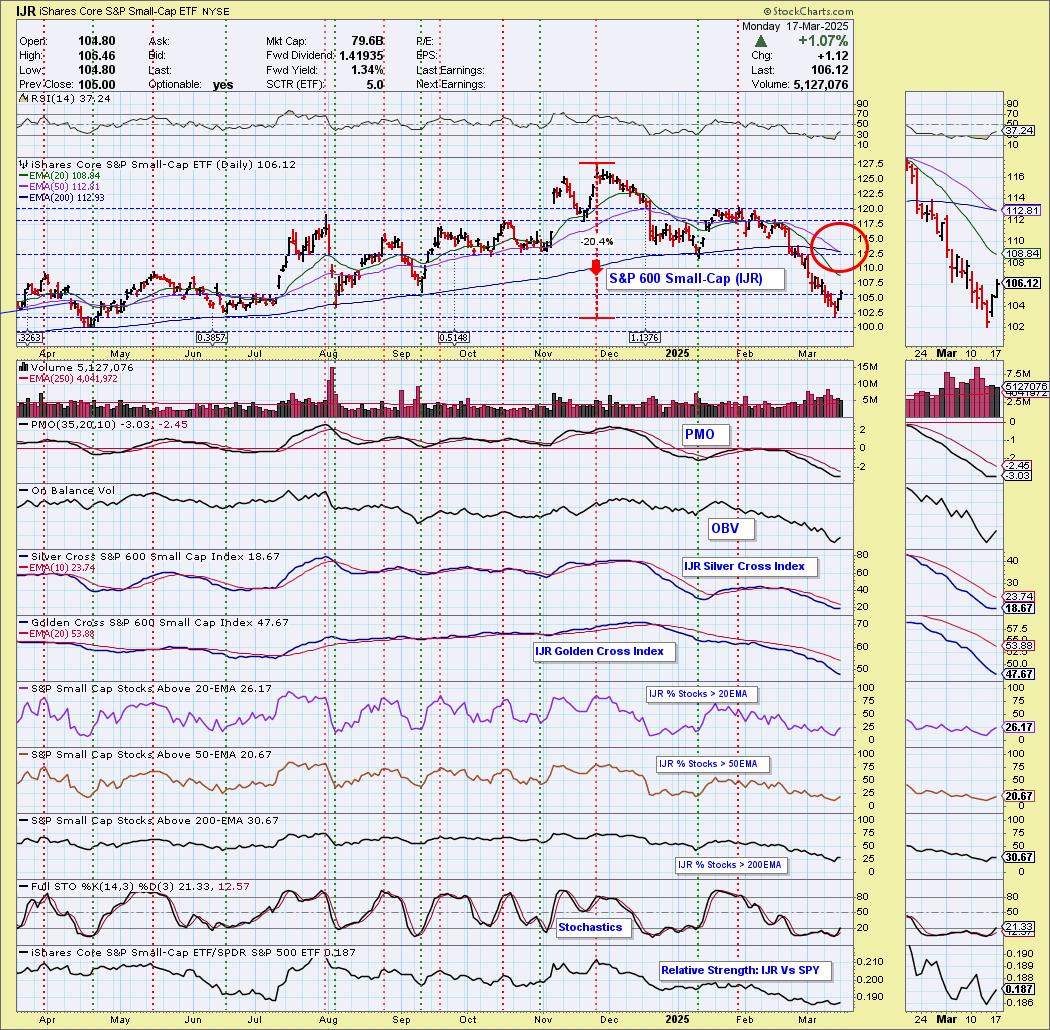
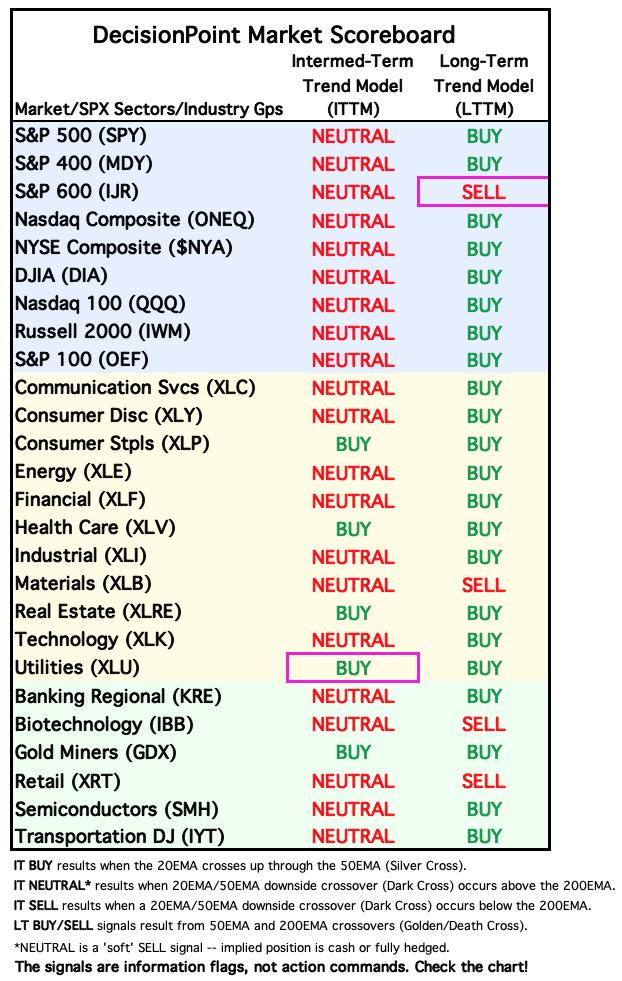
Today the S&P 600 Small-Cap ETF (IJR) 50-day EMA crossed down through the 200-day EMA (Death Cross), generating an LT Trend Model SELL Signal. From the top to the recent low we have an over 20% decline which puts IJR in a bear market. This does look like a good bounce off support, but we would caution that this could just be a short bear market rally. Despite the rally today, participation remains very bearish. The Silver Cross Index does look like it wants to turn up but it is at a very low 19% reading. There is a lot of work to do to crawl out from under this bear market environment.
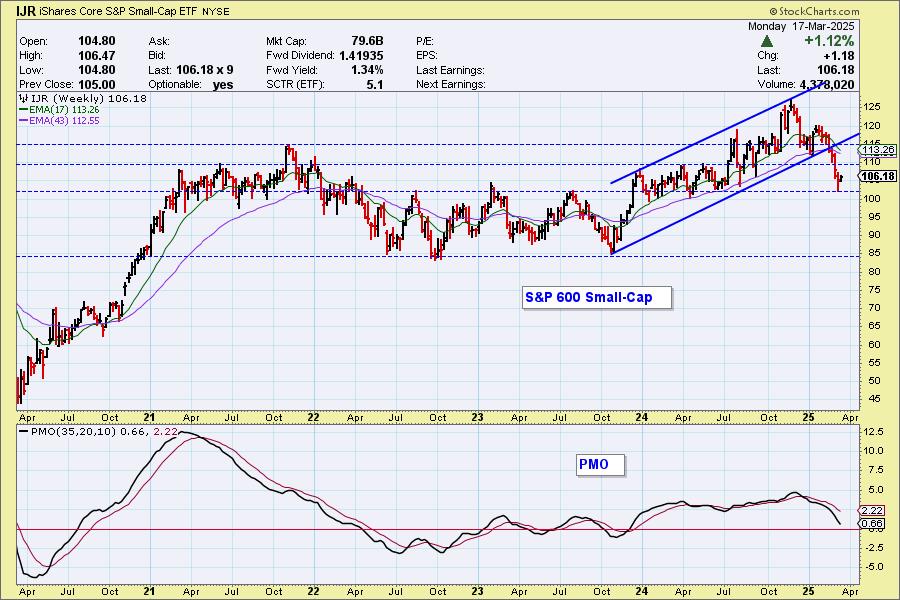
On the weekly chart IJR seems to have found decent long-term horizontal support. The weekly PMO certainly doesn't look bullish as it heads to the zero line. This level of support isn't as sturdy as it may seem.
__________
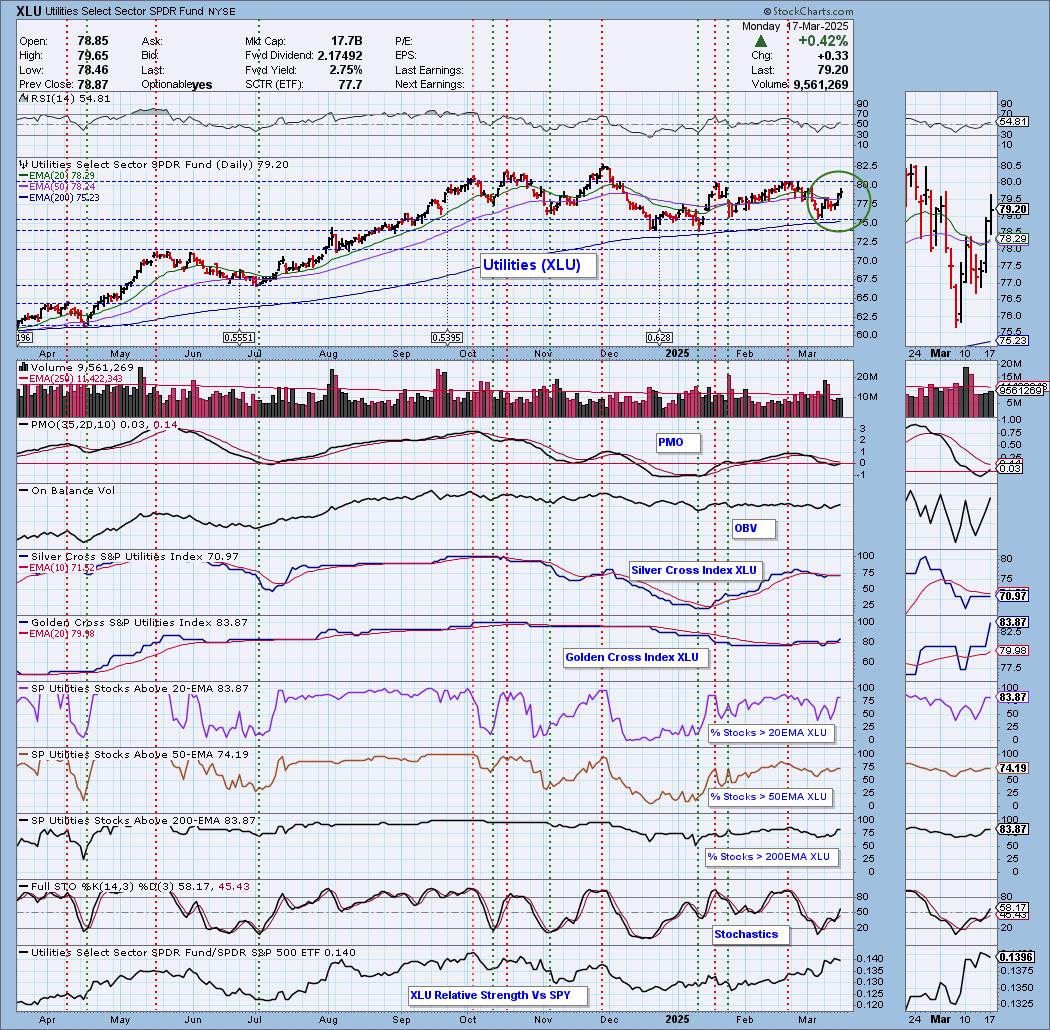
Also today, the Utilities Sector ETF (XLU) 20-day EMA crossed up through the 50-day EMA (Silver Cross), generating an IT Trend Model BUY Signal. XLU is basically in a trading range. There is a good chance we'll see a breakout given today's signal and the improvements under the hood. The PMO just crossed above the zero line and participation is strong. The Golden Cross Index is rising. The Silver Cross Index looks ready to bottom.
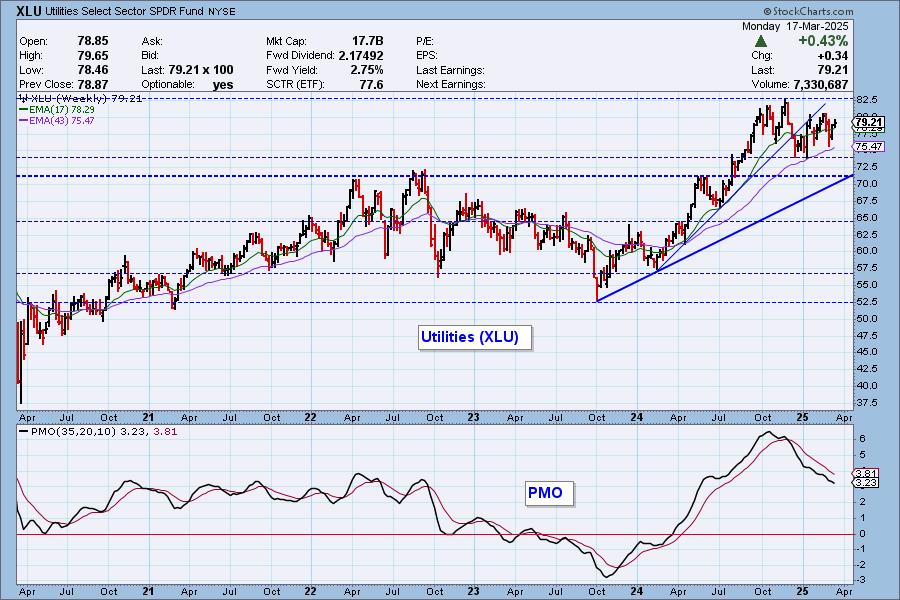
The weekly chart shows XLU in a consolidation range since lsat July. It sets up a bull flag. A bullish outcome is certainly indicated in spite of the declining weekly PMO.
The DecisionPoint Alert Weekly Wrap presents an end-of-week assessment of the trend and condition of the Stock Market, the U.S. Dollar, Gold, Crude Oil, and Bonds. The DecisionPoint Alert daily report (Monday through Thursday) is abbreviated and gives updates on the Weekly Wrap assessments.
Watch the latest episode of DecisionPoint on our YouTube channel here!
MARKET/INDUSTRY GROUP/SECTOR INDEXES
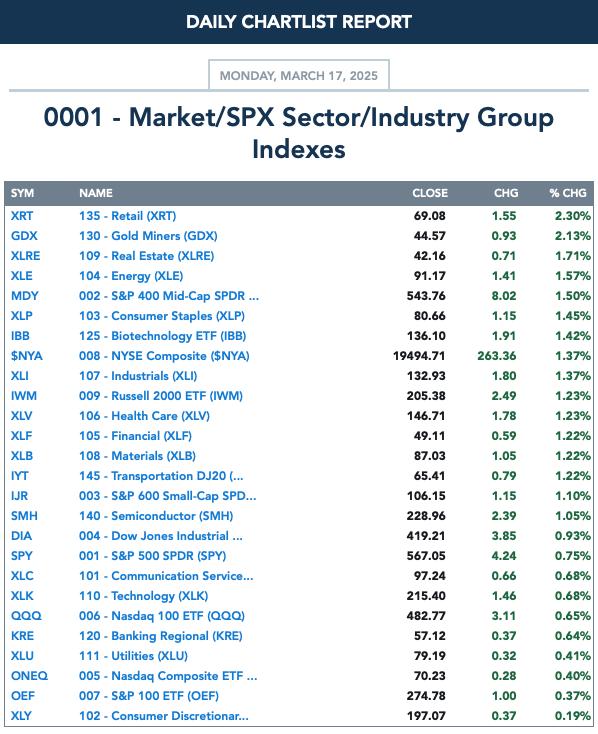
CLICK HERE for Carl's annotated Market Index, Sector, and Industry Group charts.
THE MARKET (S&P 500)
IT Trend Model: NEUTRAL as of 3/4/2025
LT Trend Model: BUY as of 3/29/2023
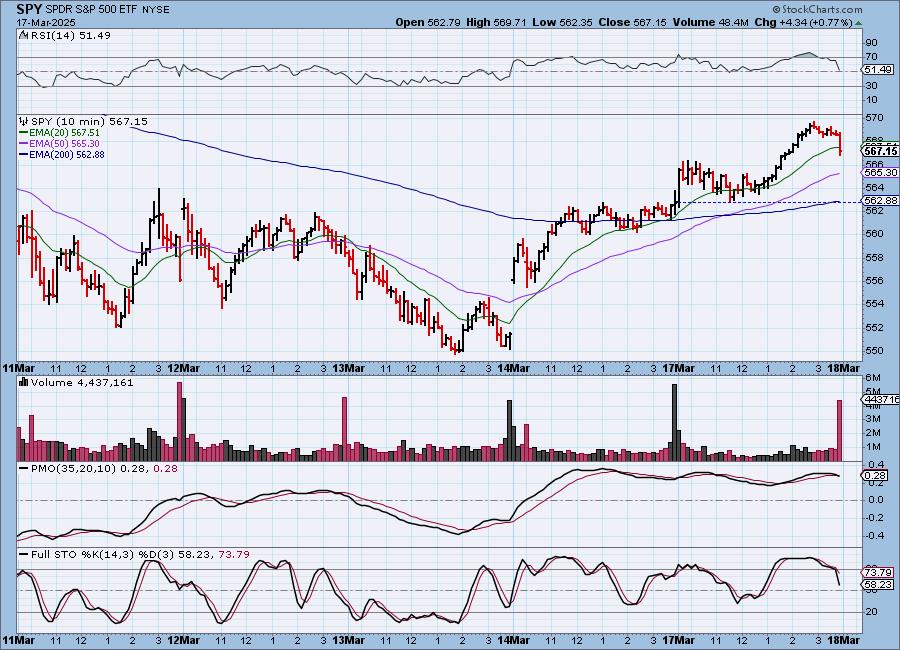
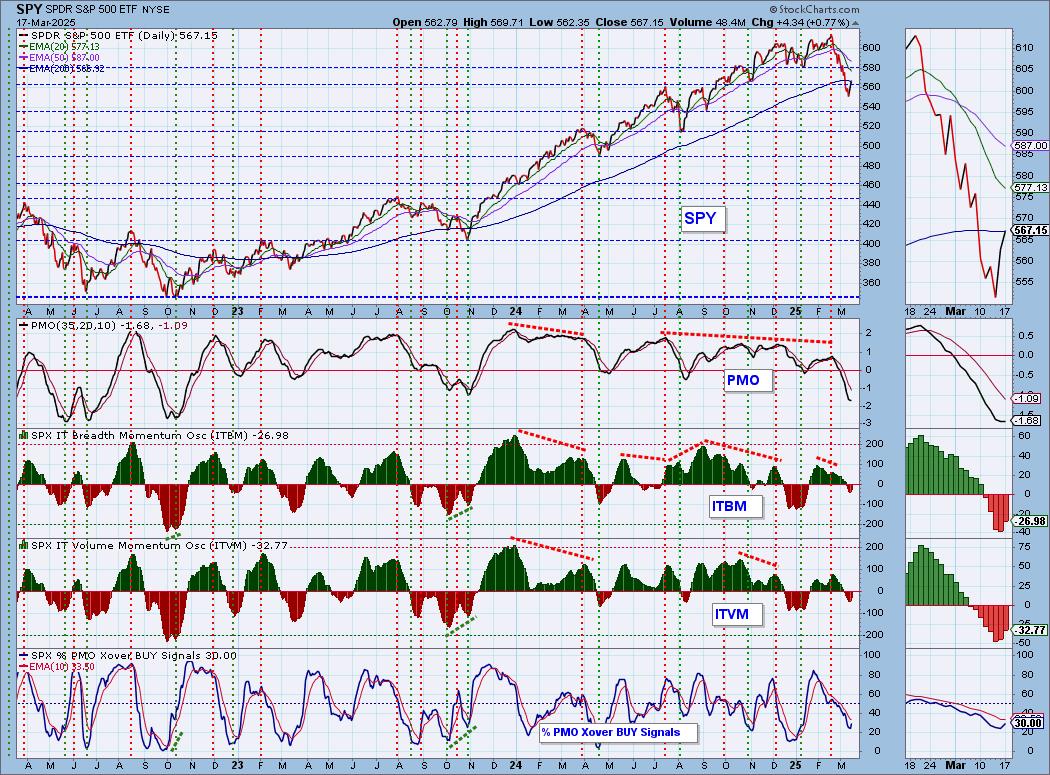
SPY 10-Minute Chart: The rally looked suspicious after the open as price trended lower, but after lunch the buying resumed in earnest. The finish of trading was negative setting up a 10-minute PMO SELL Signal.
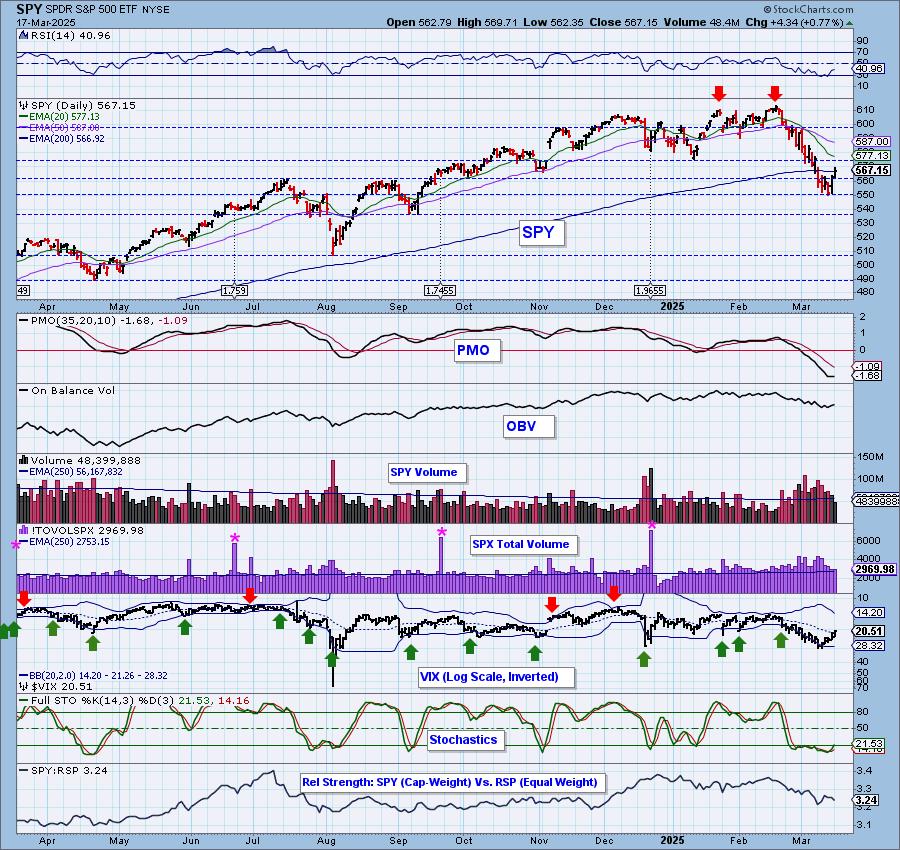
SPY Daily Chart: Price is headed to the less accelerated declining tops trendline. Today it managed to close above the 200-day EMA and horizontal resistance at the November low. This is a good start, but we'd like the PMO to turn up. It held the same reading today as on Friday.
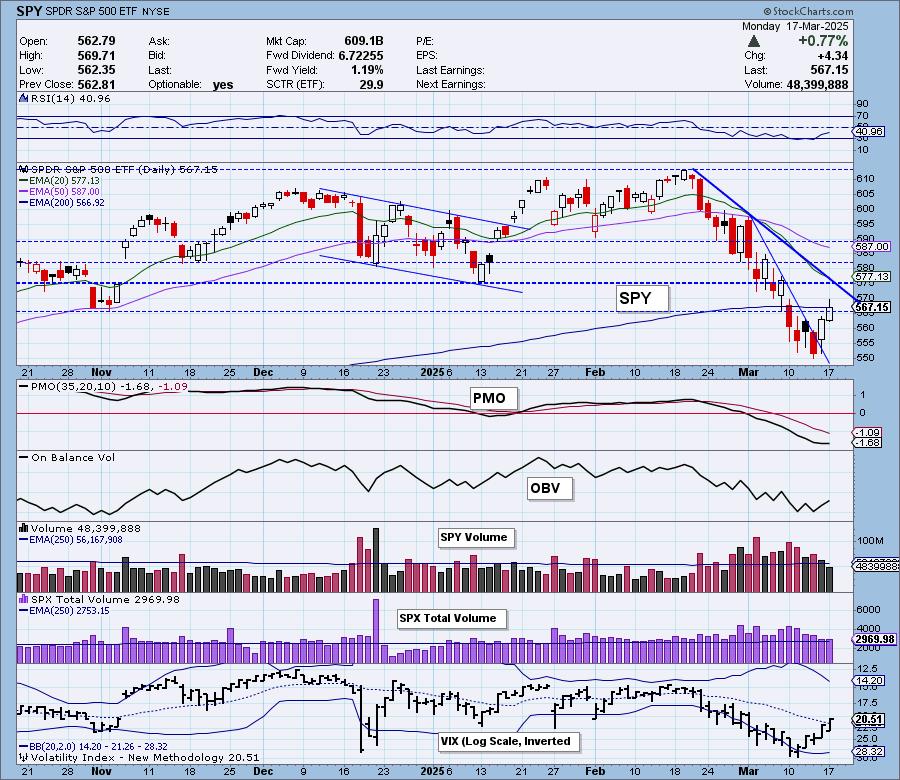
The VIX has now gotten above its moving average on our inverted scale and that does imply we have some internal strength behind the current rally. Stochastics are rising and finally got back above 20 so some strength is beginning to slowly return to the market.

Here is the latest recording from 3/17. Click HERE to get to our video list.:
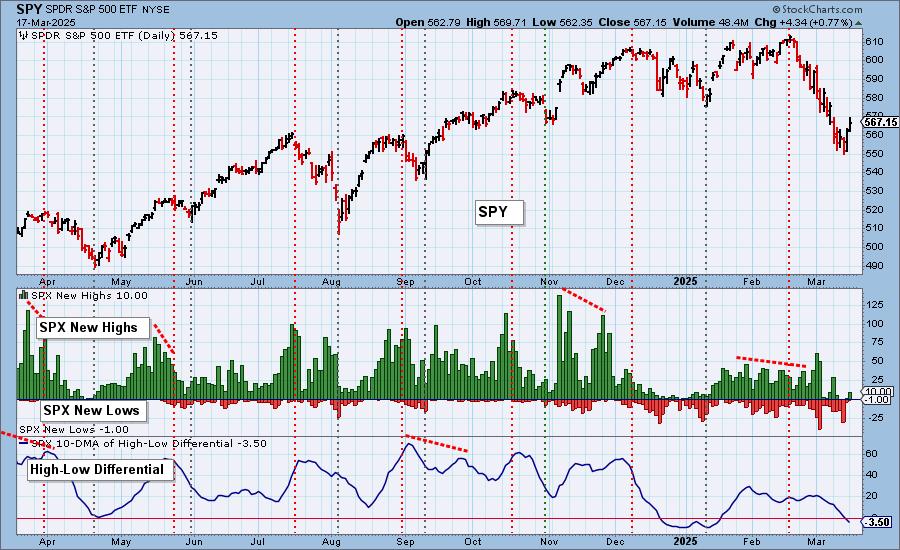
S&P 500 New 52-Week Highs/Lows: New Highs did expand on today's rally and we saw fewer New Lows. New Highs are still in a declining trend so they are confirming the decline. The High-Low Differential is also confirming the decline as it has just dropped below the zero line. We need to see more New Highs to lose that declining trend.
Climax* Analysis: Today there were unanimous climax readings on the four relevant indicators, giving us an upside exhaustion climax. SPX Total Volume was solid and confirming. We should note that Friday's NYSE UP/DOWN Volume Ratio was what Marty Zweig (Winning On Wall Street) referred to as a 9:1 Up Day (it was almost a 10:1 Up Day), which is an extremely bullish sign. The exhaustion climax does not necessarily mean that the rally is over, but we may be in for some churn.
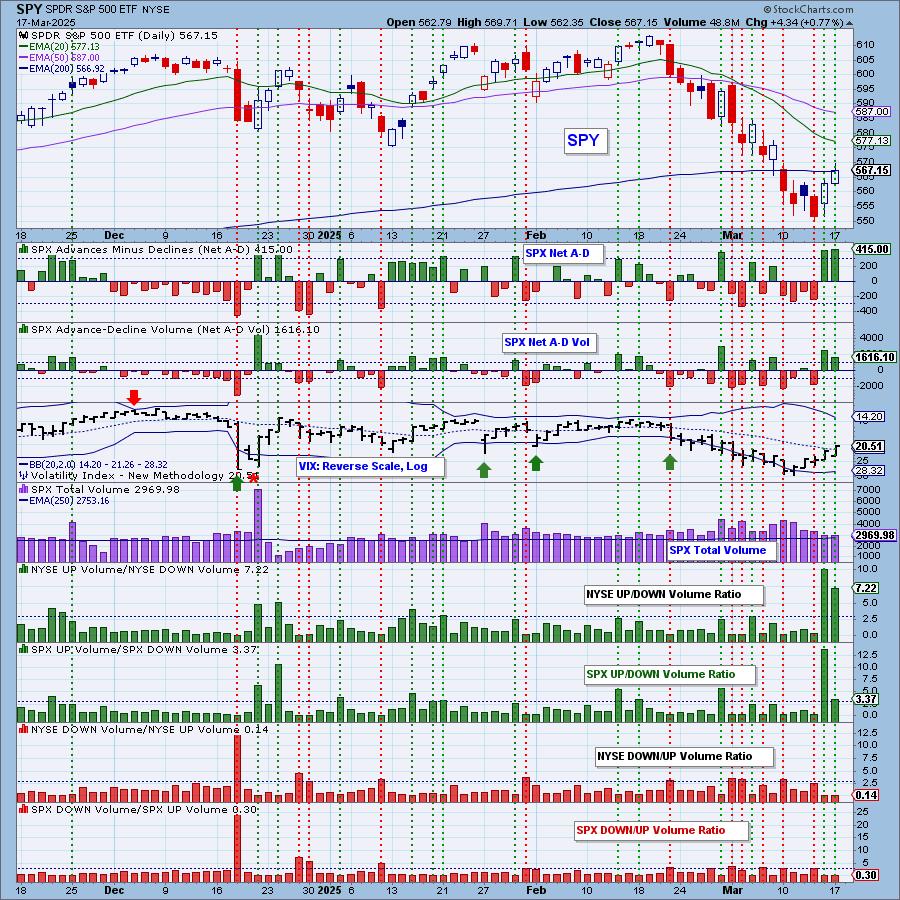
*A climax is a one-day event when market action generates very high readings in, primarily, breadth and volume indicators. We also include the VIX, watching for it to penetrate outside the Bollinger Band envelope. The vertical dotted lines mark climax days -- red for downside climaxes, and green for upside. Climaxes are at their core exhaustion events; however, at price pivots they may be initiating a change of trend.
Short-Term Market Indicators: The short-term market trend is DOWN and the condition is NEUTRAL.
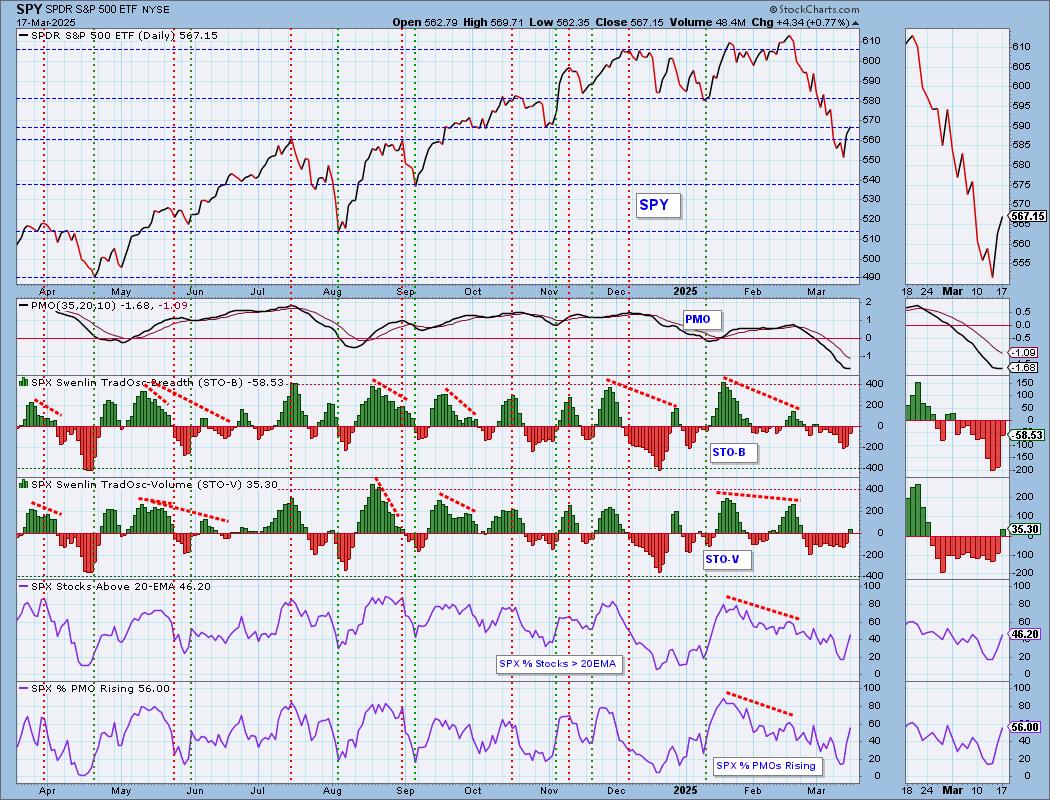
Swenlin Trading Oscillators (STOs) rose again with the STO-V hitting positive territory. The STO-V has been mostly directionless so this is welcome. We'll see if it can maintain a move upward. The STO-B has definitely switched gears, but is still in negative territory. We saw an excellent expansion in participation today. We saw more rising PMOs that put that indicator above our bullish 50% threshold.
Intermediate-Term Market Indicators: The intermediate-term market trend is DOWN and the condition is NEUTRAL.
Both the ITBM and ITVM are rising now, confirming the rising STOs. %PMO Xover BUY Signals saw an upside reversal as more PMO BUY Signals were logged today.
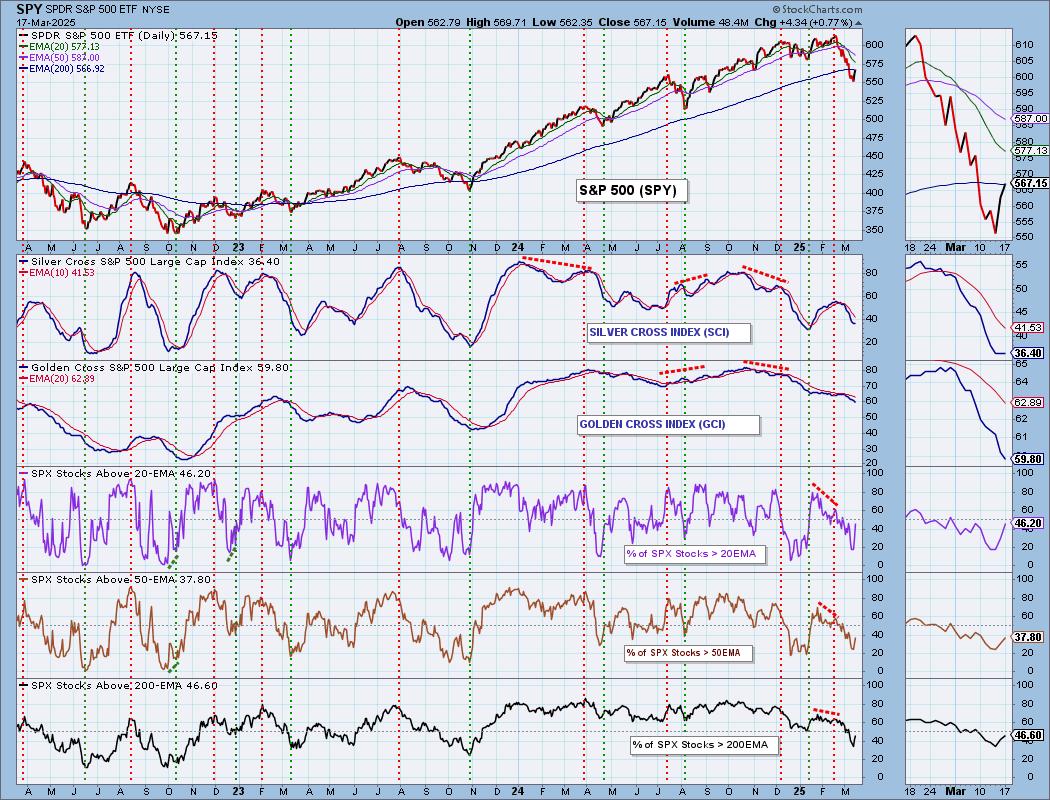
PARTICIPATION CHART (S&P 500): The following chart objectively shows the depth and trend of participation for the SPX in two time frames.
- Intermediate-Term - the Silver Cross Index (SCI) shows the percentage of SPX stocks on IT Trend Model BUY signals (20-EMA > 50-EMA). The opposite of the Silver Cross is a "Dark Cross" -- those stocks are, at the very least, in a correction.
- Long-Term - the Golden Cross Index (GCI) shows the percentage of SPX stocks on LT Trend Model BUY signals (50-EMA > 200-EMA). The opposite of a Golden Cross is the "Death Cross" -- those stocks are in a bear market.
The market bias is BEARISH in the intermediate- and long-term timeframes.
Participation of stocks above key moving averages did jump higher today, but it hasn't really broken the declining trends they are all in. Still, this was good to see if we want to get a lasting rally. The Silver Cross Index has decelerated its decline and looks ready to bottom. The Golden Cross Index is bearish in its decline, but it is still reading above our bullish 50% threshold. Both the Silver and Golden Cross Indexes are below their signal lines so the IT and LT Biases remain BEARISH.
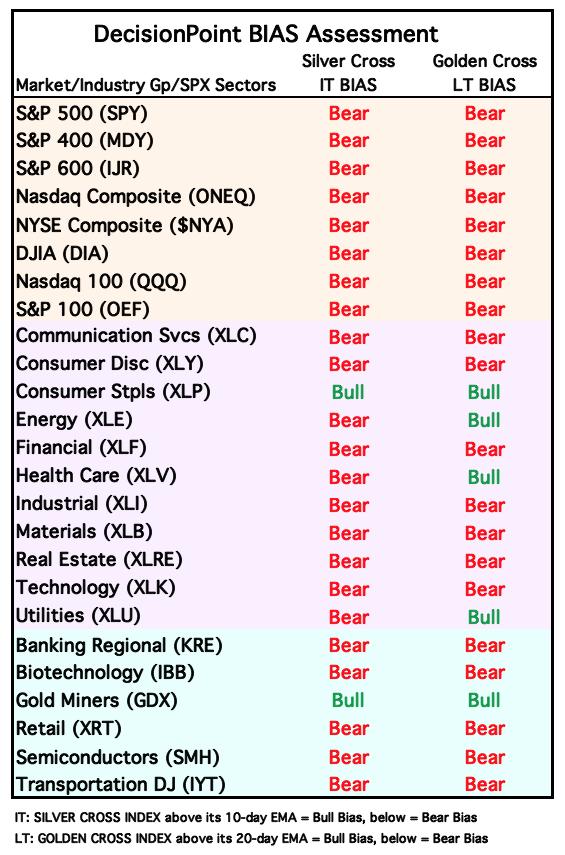
BIAS Assessment: The following table expresses the current BIAS of various price indexes based upon the relationship of the Silver Cross Index to its 10-day EMA (intermediate-term), and of the Golden Cross Index to its 20-day EMA (long-term). When the Index is above the EMA it is bullish, and it is bearish when the Index is below the EMA. The BIAS does not imply that any particular action should be taken. It is information to be used in the decision process.
The items with highlighted borders indicate that the BIAS changed today.
*****************************************************************************************************
CONCLUSION: The indicators are showing good improvement with participation expanding again. The STOs and ITBM/ITVM are rising in concert. We'd like to get the PMO rising again, but it did stop declining today. The one hiccup today is the new upside exhaustion climax. We aren't so sure that it will play out with a decline primarily because indicators are showing good improvement. Price got over resistance today as well. What we could prepare for is churn, directionless price movement should this rally not see followthrough tomorrow.
Erin is 20% long, 0% short. (This is intended as information, not a recommendation.)
*****************************************************************************************************
CALENDAR

Have you subscribed the DecisionPoint Diamonds yet? DP does the work for you by providing handpicked stocks/ETFs from exclusive DP scans! Add it with a discount! Contact support@decisionpoint.com for more information!
BITCOIN
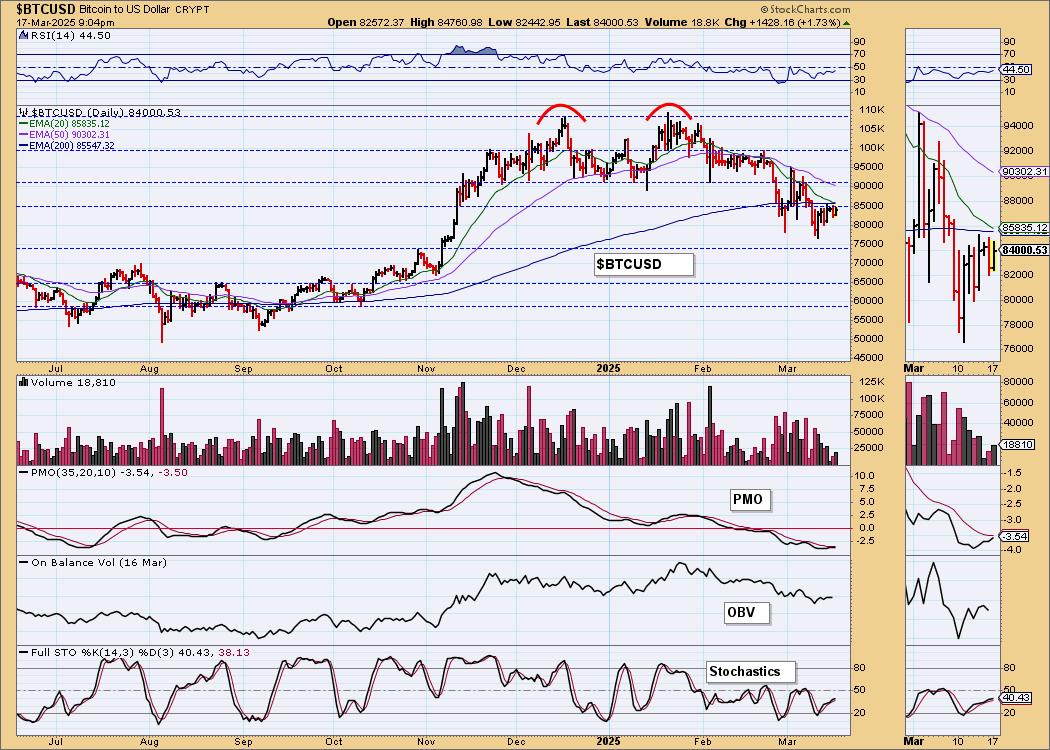
Price rounded off on a double top formation. The minimum downside target of the pattern was reached, but we still have a declining trend to deal with. Price looks a bit iffy sitting under the 200-day EMA. The PMO is rising again along with Stochastics so we'll look for a possible breakout, but we aren't that bullish overall. When the declining trend is broken, then we'll be ready to look for a good rebound on Bitcoin.
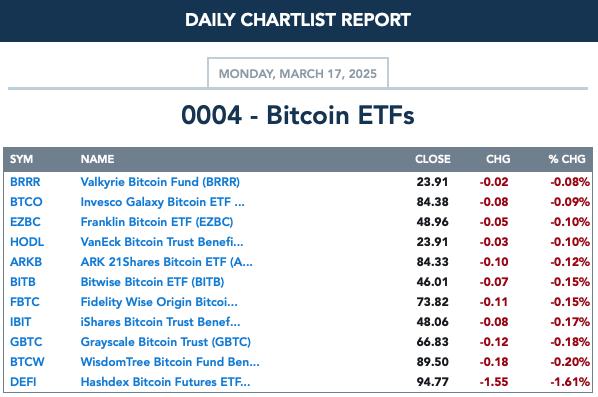
BITCOIN ETFs
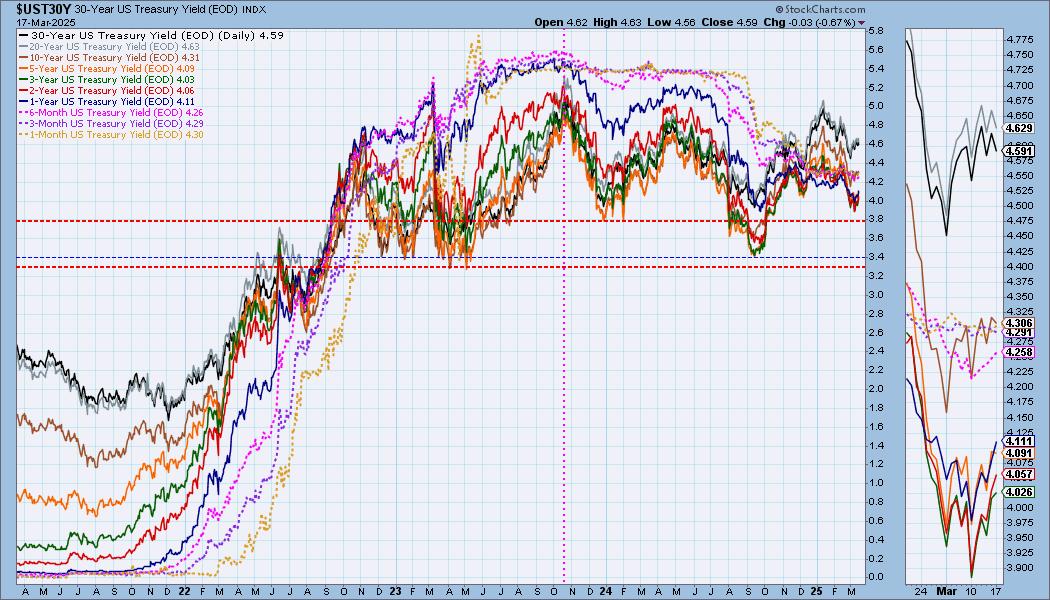
INTEREST RATES
We still see short-term rising trends in the thumbnail and that could keep yields moving higher, but they do seem to be losing steam as they near a test of declining trends.
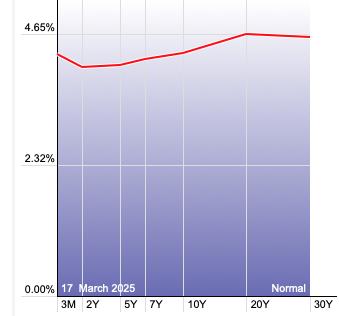
The Yield Curve Chart from StockCharts.com shows us the inversions taking place. The red line should move higher from left to right. Inversions are occurring where it moves downward.
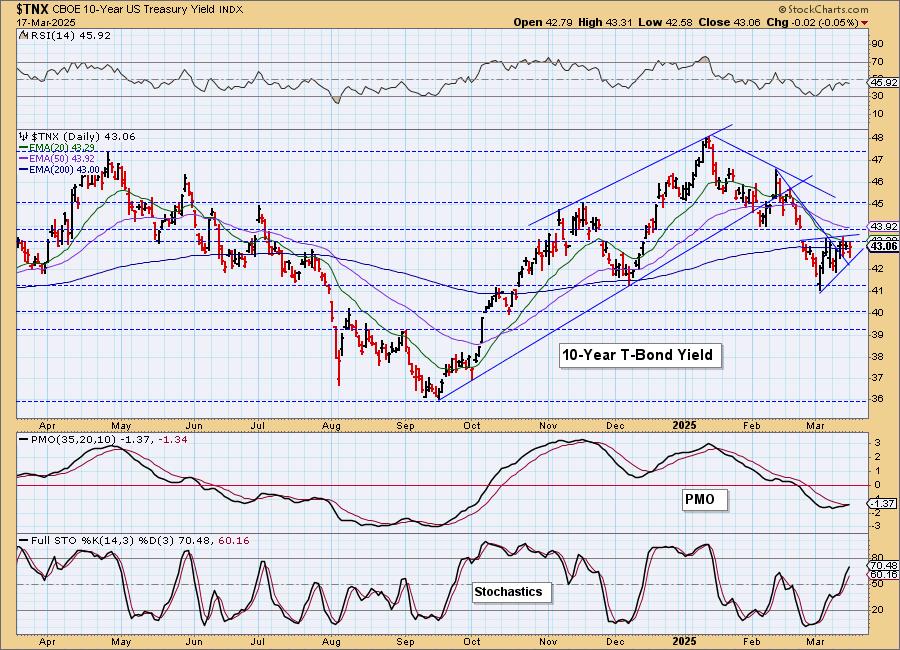
10-YEAR T-BOND YIELD
We're starting to see a reverse flag with the flag being a bearish rising wedge. Still, the PMO is rising toward a Crossover BUY Signal and Stochastics are rising strongly. This resistance level is very strong and with bearish patterns materializing we have to consider the possibility of a downside reversal in spite of the indicators.
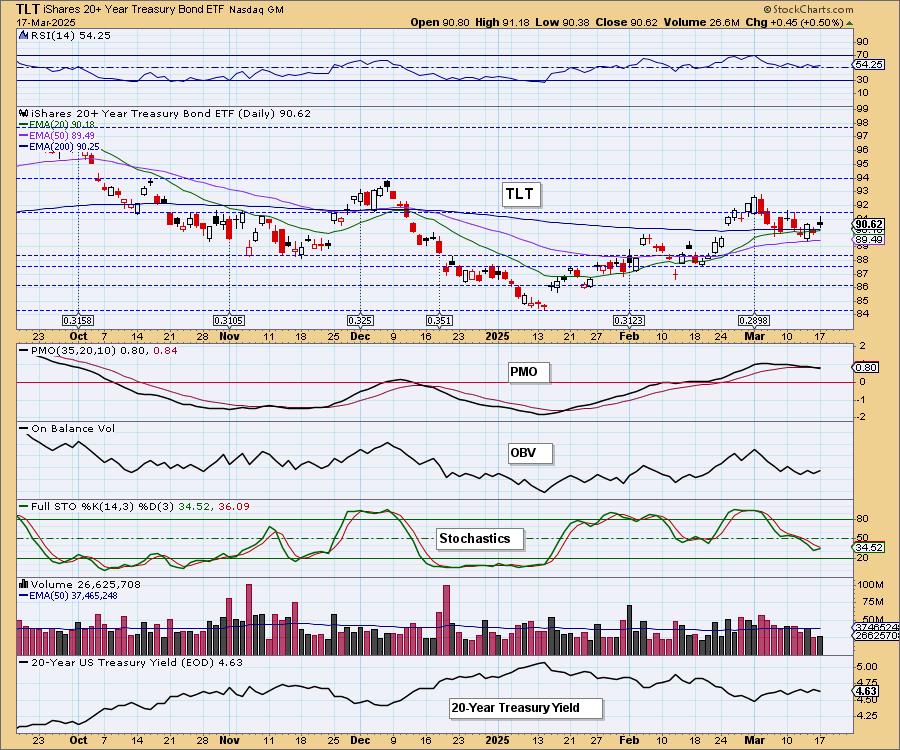
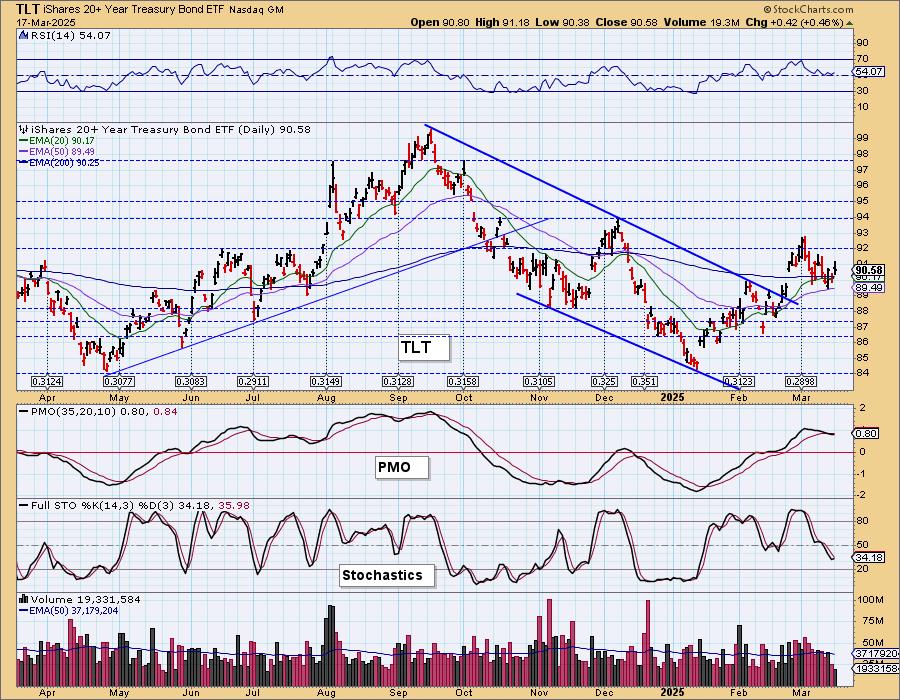
BONDS (TLT)
IT Trend Model: BUY as of 2/25/2025
LT Trend Model: SELL as of 12/13/2024
TLT Daily Chart: Bearish patterns are developing on the 10-year yield and the 20-year yield seems to have resistance as well. We see a bullish cup with handle pattern on TLT. Today's break of the short-term declining trend was encouraging. Stochastics are rising again so even though the PMO is falling, we think there is a good chance at an upside reversal here.
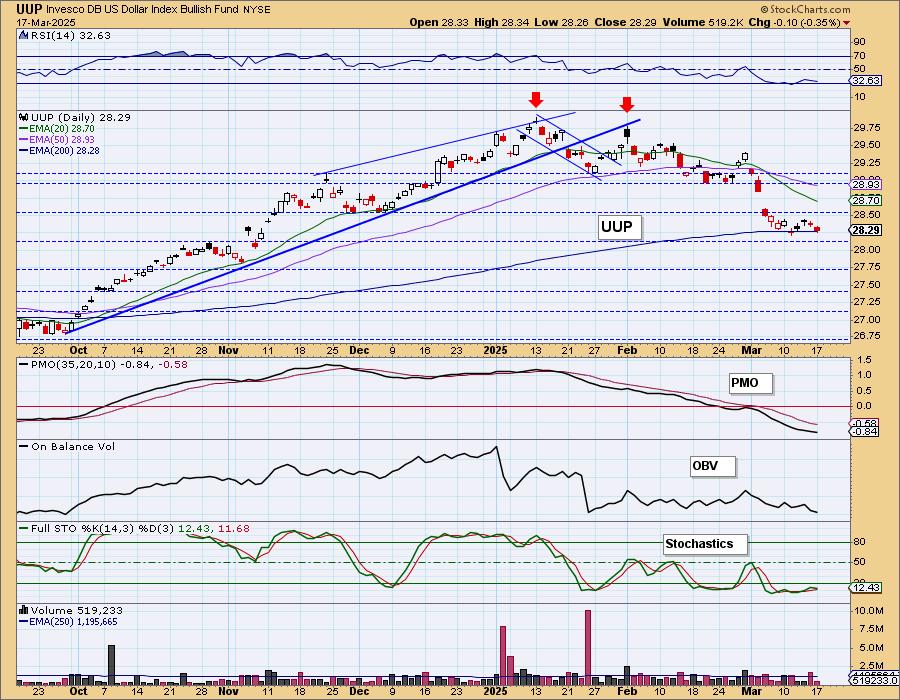
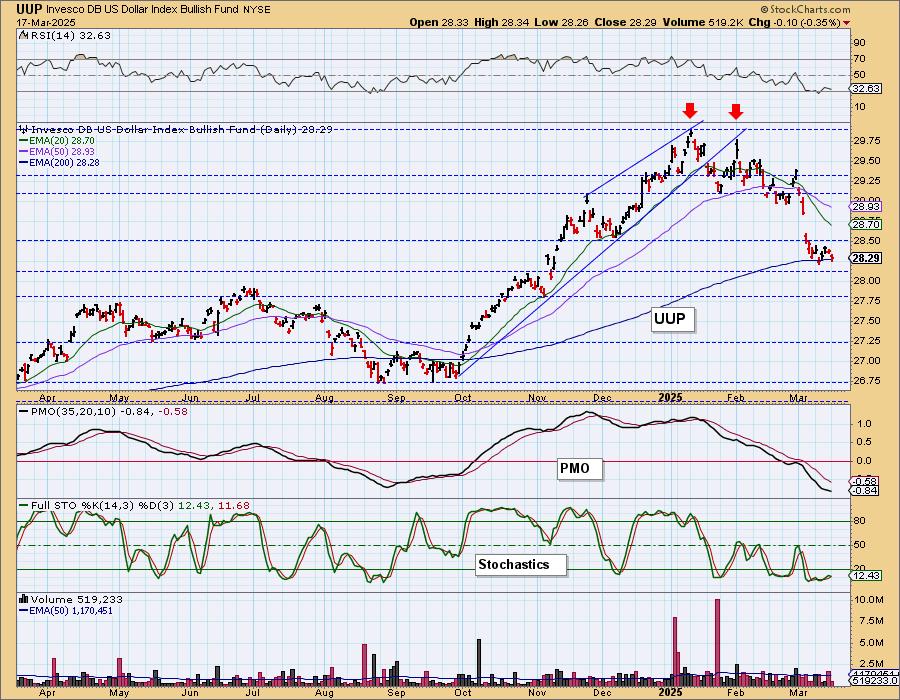
DOLLAR (UUP)
IT Trend Model: NEUTRAL as of 3/5/2025
LT Trend Model: BUY as of 5/25/2023
UUP Daily Chart: The Dollar reached support at the 200-day EMA and horizontal support at the October high. It isn't really going anywhere. Indicators are bearish with the PMO declining and Stochastics topping below 20. This support level is very vulnerable. We suspect we'll see some more sideways movement on the Dollar before a likely breakdown.
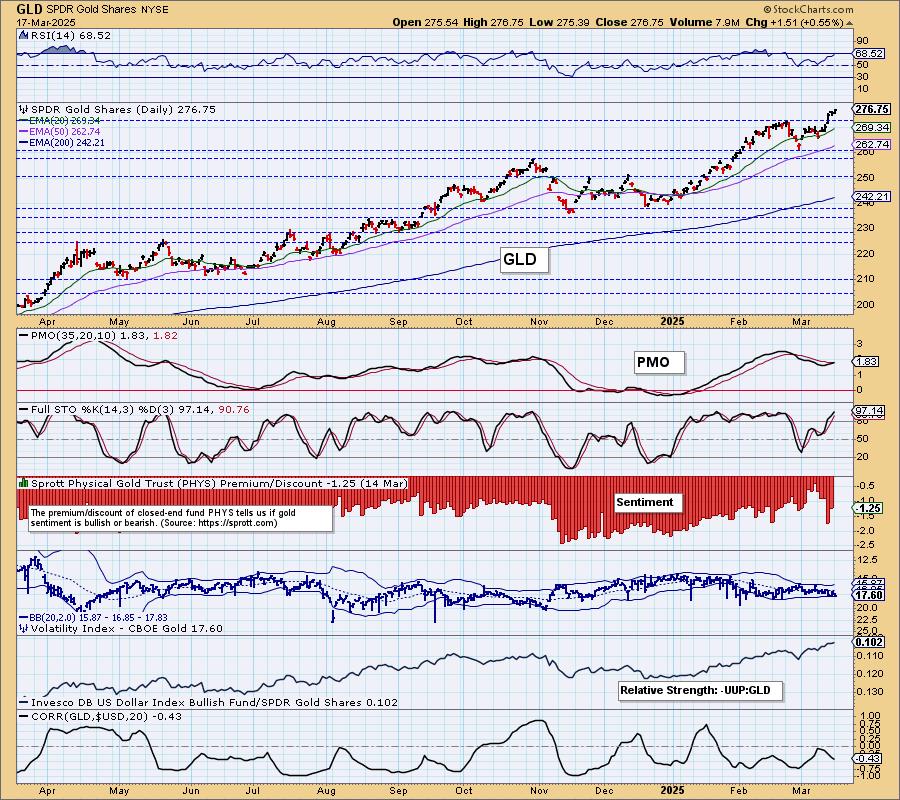
GOLD
IT Trend Model: BUY as of 1/10/2025
LT Trend Model: BUY as of 10/20/2023
GLD Daily Chart: Gold set another all-time high today and doesn't look ready to cool. The PMO just gave us a Crossover BUY Signal. The relative strength line to the Dollar is rising as it finds buyers on top of favorable conditions by the Dollar's lack of a rising trend.
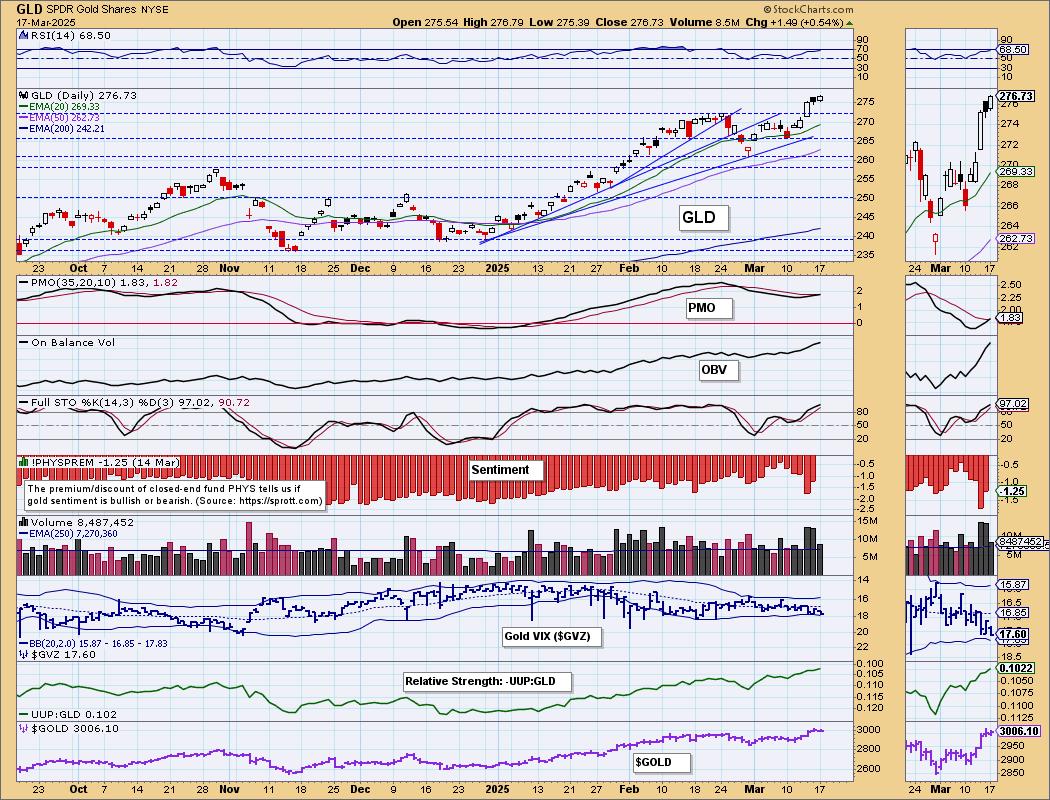
Discounts did expand and we like this as it keeps investors from being too bullish on the metal. It is strange that investors are showing more bearishness but that could be that many are looking for a pullback. We aren't yet.
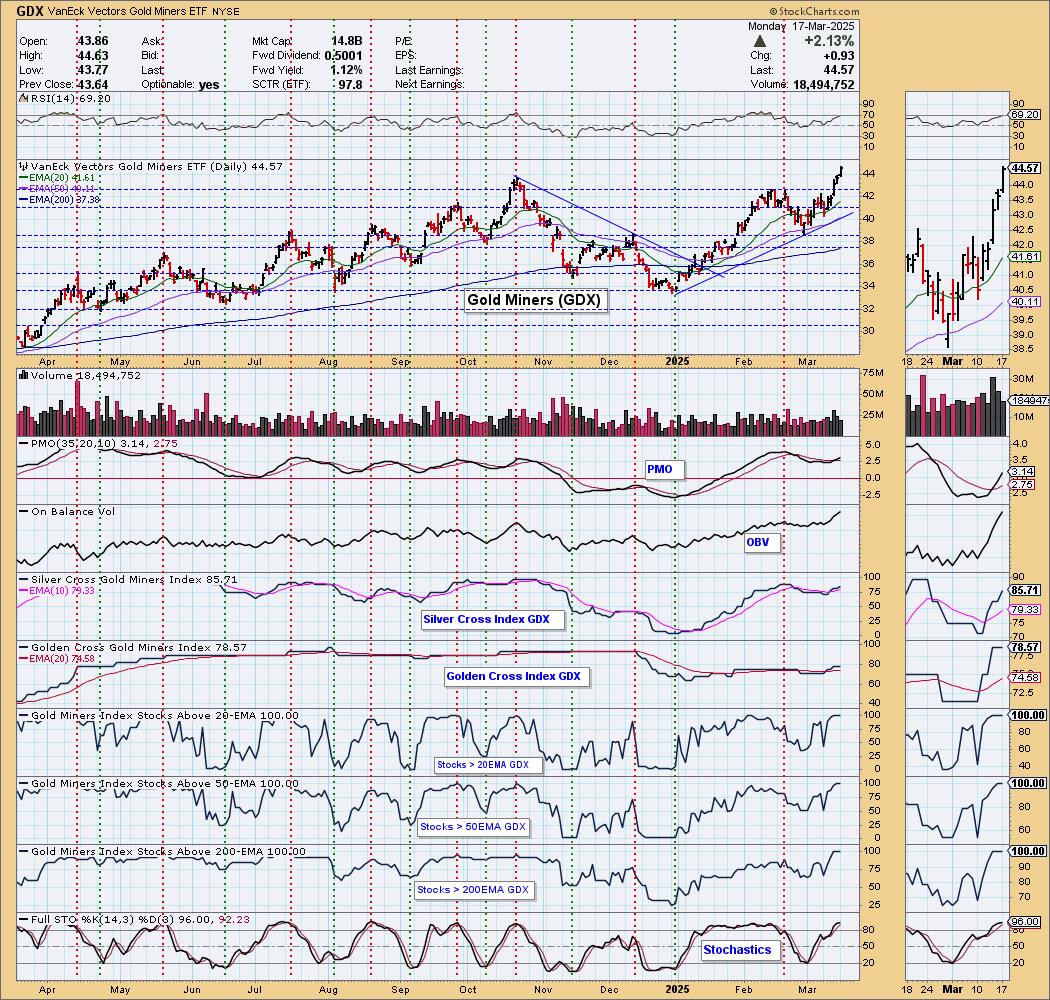
GOLD MINERS (GDX) Daily Chart: GDX obliterated the prior bearish double top and is likely to continue to head higher as the market rebounds and Gold hits more all-time highs. We've heard that junior gold miners are not seeing the same expansion, but maybe their time is coming. Participation is at 100%. Stochastics are rising and the PMO is rising on a Crossover BUY Signal. There is likely more upside to go.
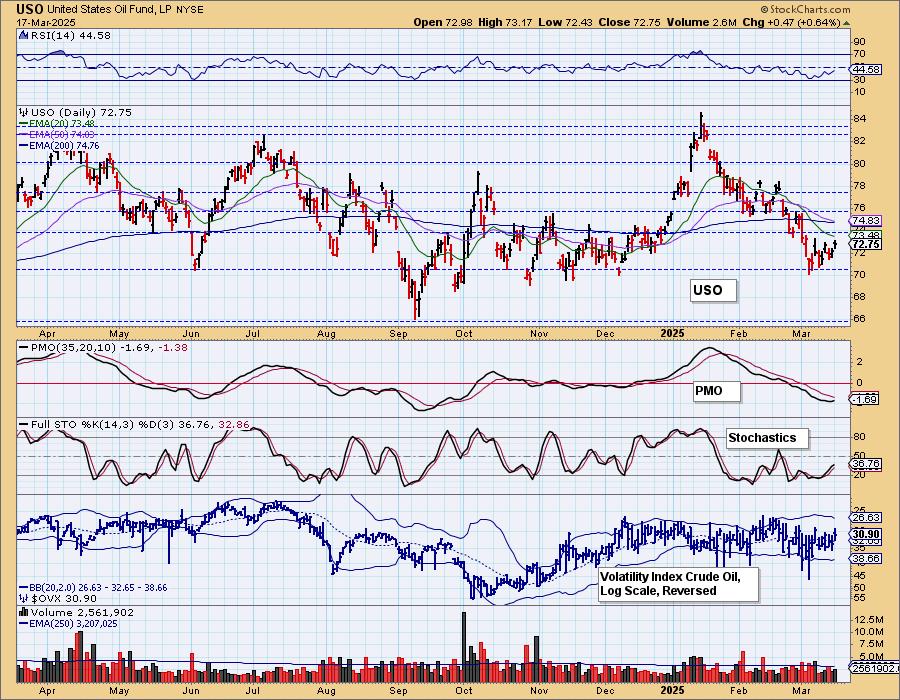
CRUDE OIL (USO)
IT Trend Model: NEUTRAL as of 2/27/2025
LT Trend Model: BUY as of 1/10/2025
USO Daily Chart: Crude is making a nice upside reversal but we see this as a reverse flag which is bearish. The PMO did technically turn up and Stochastics are technically rising, but both indicators are lukewarm at best. We could see a bit more upside, but we don't think it will last much longer.
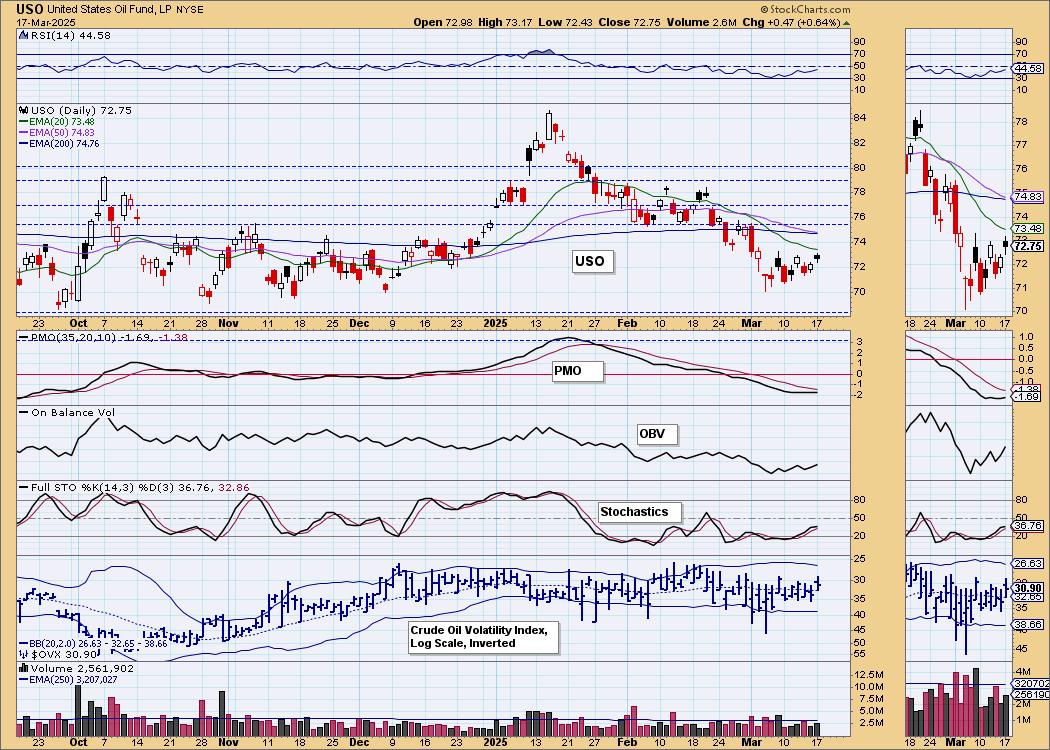
It is bouncing off strong support, but we suspect this rally will fizzle out at near-term resistance.
Good Luck & Good Trading!
Erin Swenlin and Carl Swenlin
Technical Analysis is a windsock, not a crystal ball. --Carl Swenlin
(c) Copyright 2025 DecisionPoint.com
Disclaimer: This blog is for educational purposes only and should not be construed as financial advice. The ideas and strategies should never be used without first assessing your own personal and financial situation, or without consulting a financial professional. Any opinions expressed herein are solely those of the author, and do not in any way represent the views or opinions of any other person or entity.
DecisionPoint is not a registered investment advisor. Investment and trading decisions are solely your responsibility. DecisionPoint newsletters, blogs or website materials should NOT be interpreted as a recommendation or solicitation to buy or sell any security or to take any specific action.
NOTE: The signal status reported herein is based upon mechanical trading model signals, specifically, the DecisionPoint Trend Model. They define the implied bias of the price index based upon moving average relationships, but they do not necessarily call for a specific action. They are information flags that should prompt chart review. Further, they do not call for continuous buying or selling during the life of the signal. For example, a BUY signal will probably (but not necessarily) return the best results if action is taken soon after the signal is generated. Additional opportunities for buying may be found as price zigzags higher, but the trader must look for optimum entry points. Conversely, exit points to preserve gains (or minimize losses) may be evident before the model mechanically closes the signal.
Helpful DecisionPoint Links:
DecisionPoint Alert Chart List
DecisionPoint Golden Cross/Silver Cross Index Chart List
DecisionPoint Sector Chart List
Price Momentum Oscillator (PMO)