
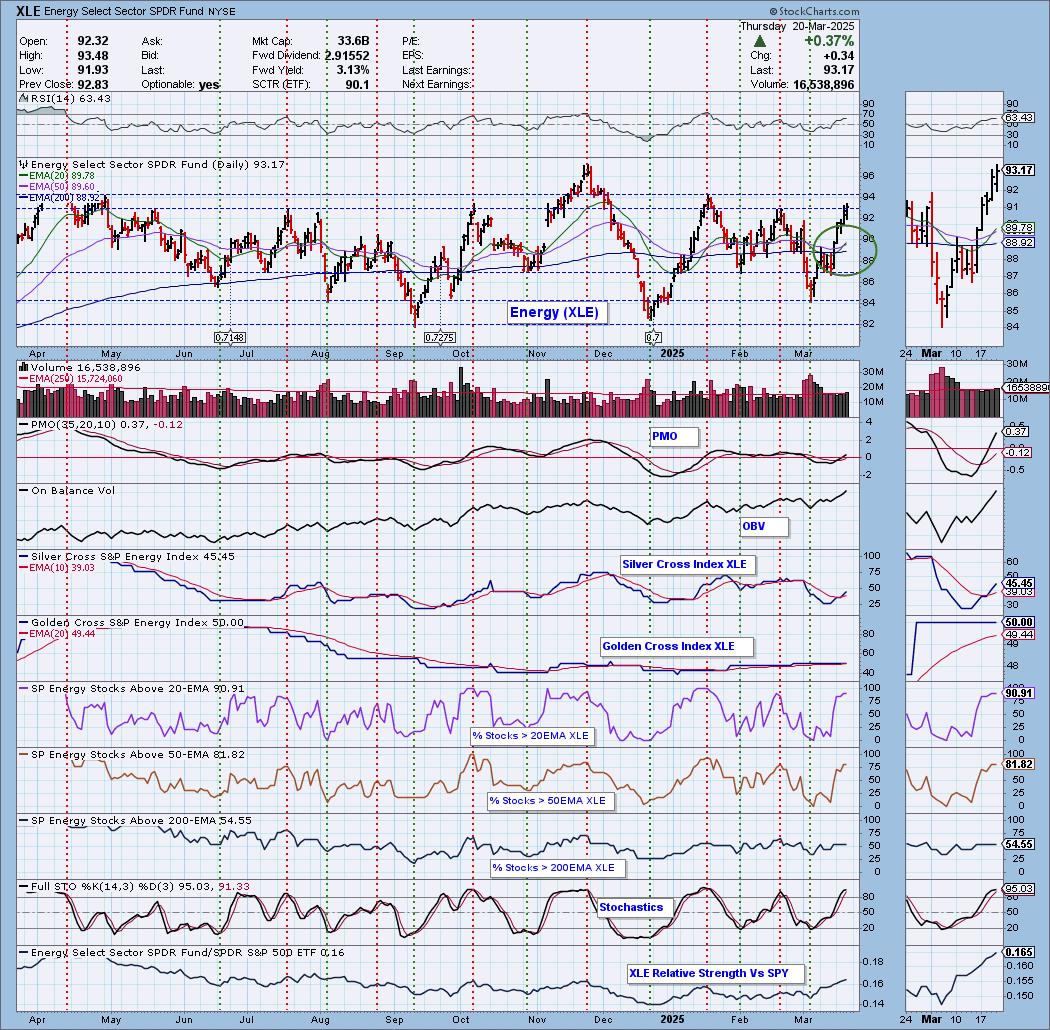
Today the Energy Sector ETF (XLE) 20-day EMA crossed up through the 50-day EMA (Silver Cross), generating an IT Trend Model BUY Signal. It is essentially in a trading range and it is near the top so this signal may be arriving late. It is a signal that doesn't carry that much weight as the EMAs have been moving sideways with price. Participation is still very strong and both Stochastics and the PMO are configured very positively so it has a good chance of challenging the November top.
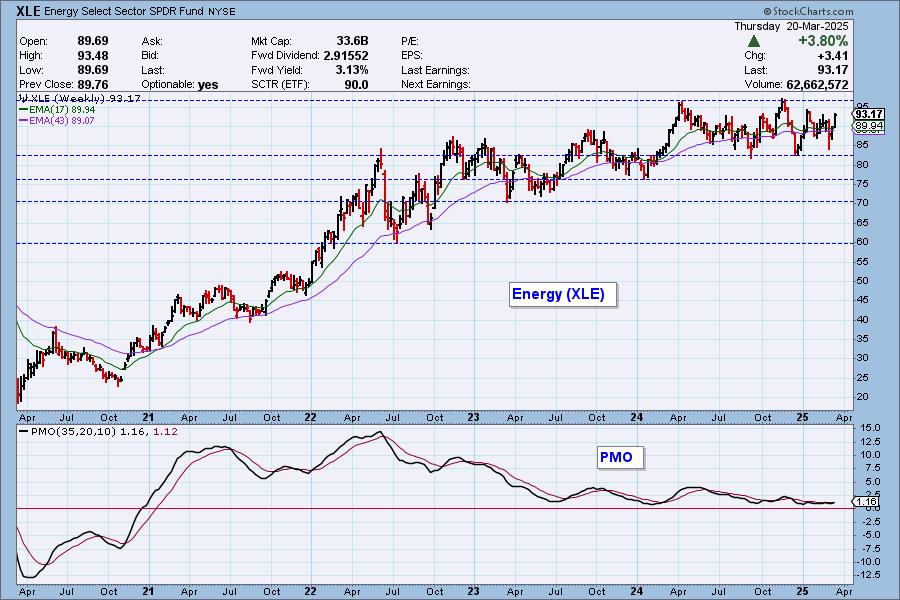
The weekly chart shows that XLE has been in a trading range for about a year, and it is really uclear how the trading range will resolve. The weekly PMO is flat due to the trading range, but it did technically cross above its signal line.
The DecisionPoint Alert Weekly Wrap presents an end-of-week assessment of the trend and condition of the Stock Market, the U.S. Dollar, Gold, Crude Oil, and Bonds. The DecisionPoint Alert daily report (Monday through Thursday) is abbreviated and gives updates on the Weekly Wrap assessments.
Watch the latest episode of DecisionPoint on our YouTube channel here!
MARKET/INDUSTRY GROUP/SECTOR INDEXES
CLICK HERE for Carl's annotated Market Index, Sector, and Industry Group charts.
THE MARKET (S&P 500)
IT Trend Model: NEUTRAL as of 3/4/2025
LT Trend Model: BUY as of 3/29/2023
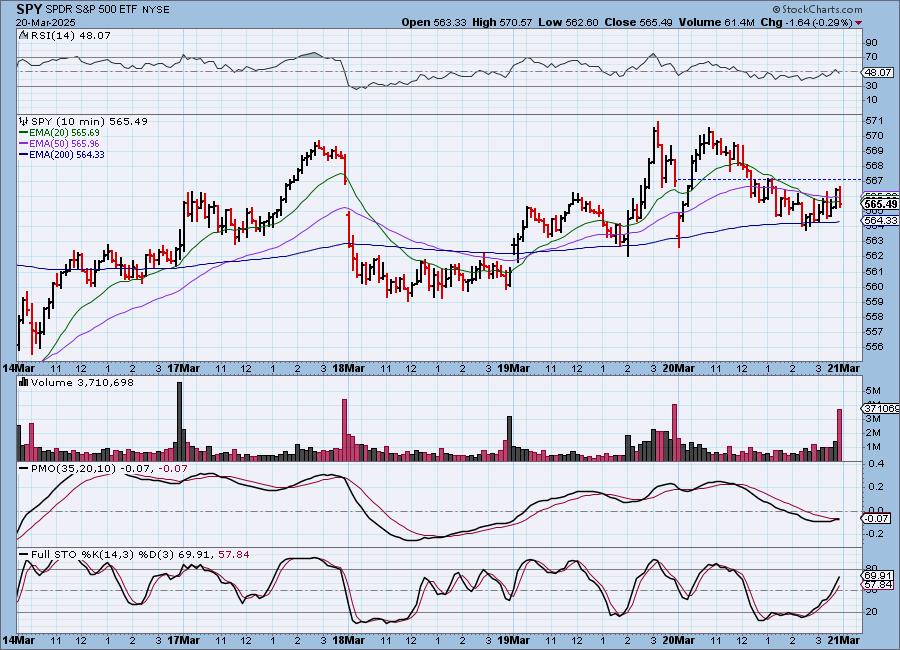
SPY 10-Minute Chart: Price started down on the opening gap, but quickly recovered. That was followed by a declining trend. Price did make an upside reversal to finish the day, but it wasn't enough to get a positive close. The 10-minute PMO does look encouraging for tomorrow's open.
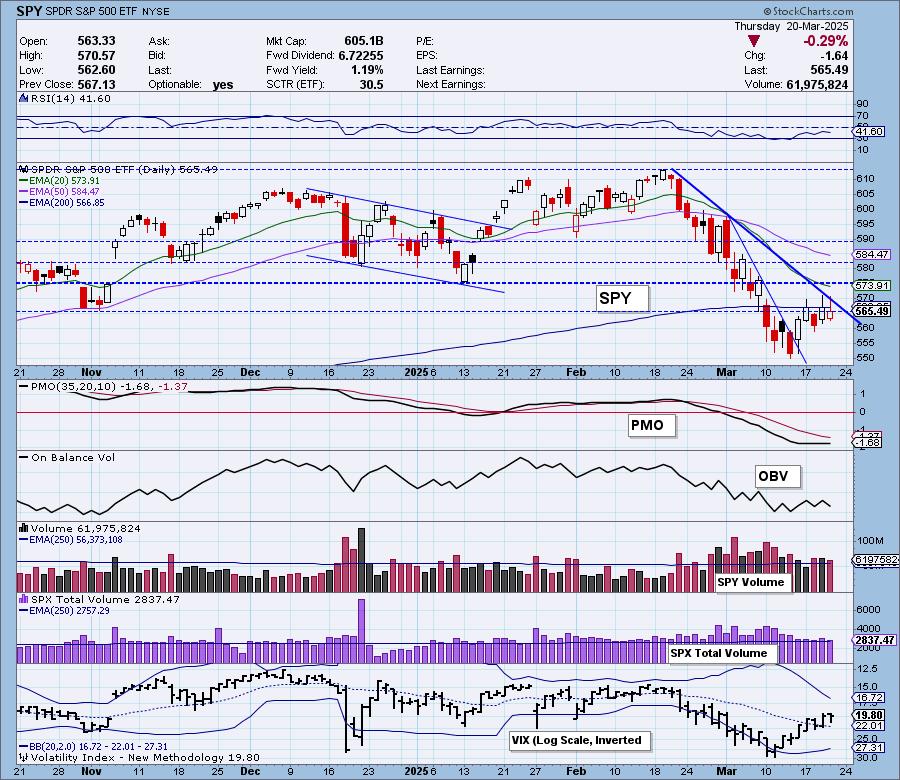
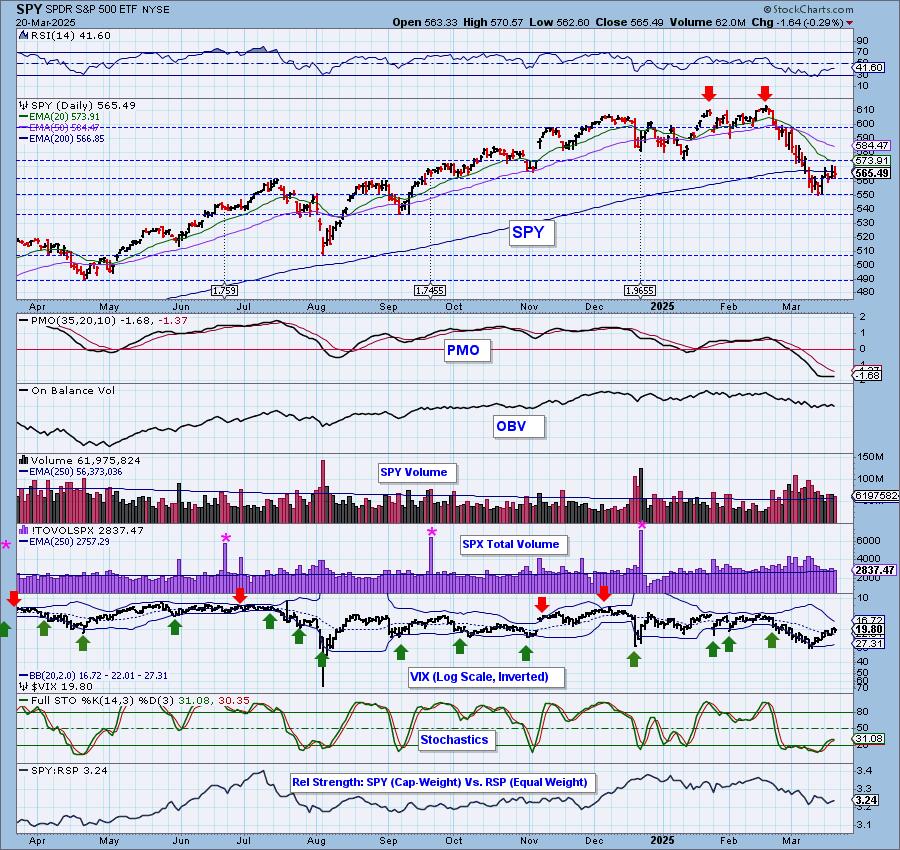
SPY Daily Chart: We have a bearish reverse flag on the daily chart that is reminiscent of a bear market rally. The PMO did technically rise today, but it doesn't look so encouraging.
The VIX is holding above its moving average on the inverted scale which does imply there is some internal strength. Stochastics are flattening out, but are still technically rising. They are in negative territory still so we can't really say that they are pointing out internal strength yet.

Here is the latest recording from 3/17. Click HERE to get to our video list.:
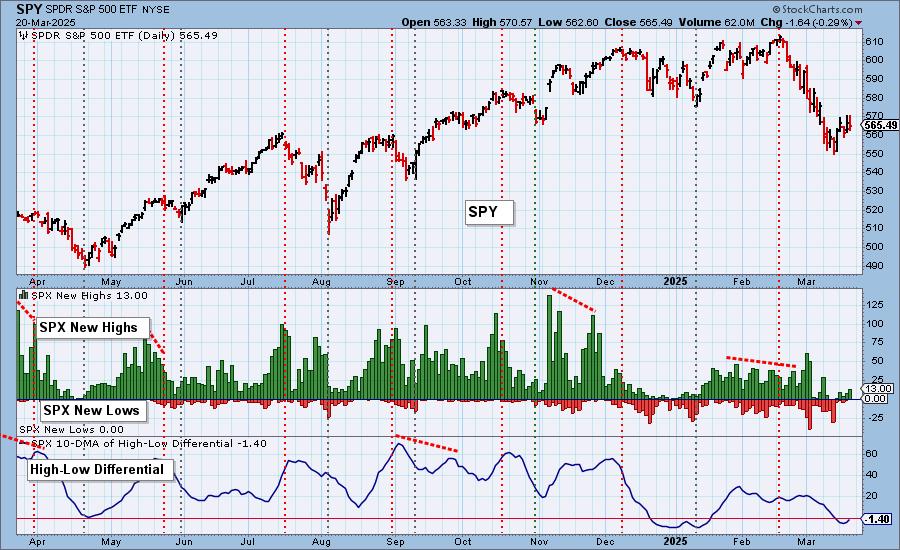
S&P 500 New 52-Week Highs/Lows: New Highs expanded on the decline and we saw no New Lows which is positive. The High-Low Differential is rising out of oversold territory. It rarely spends much time below the zero line.
Climax* Analysis: There were no climax readings today.
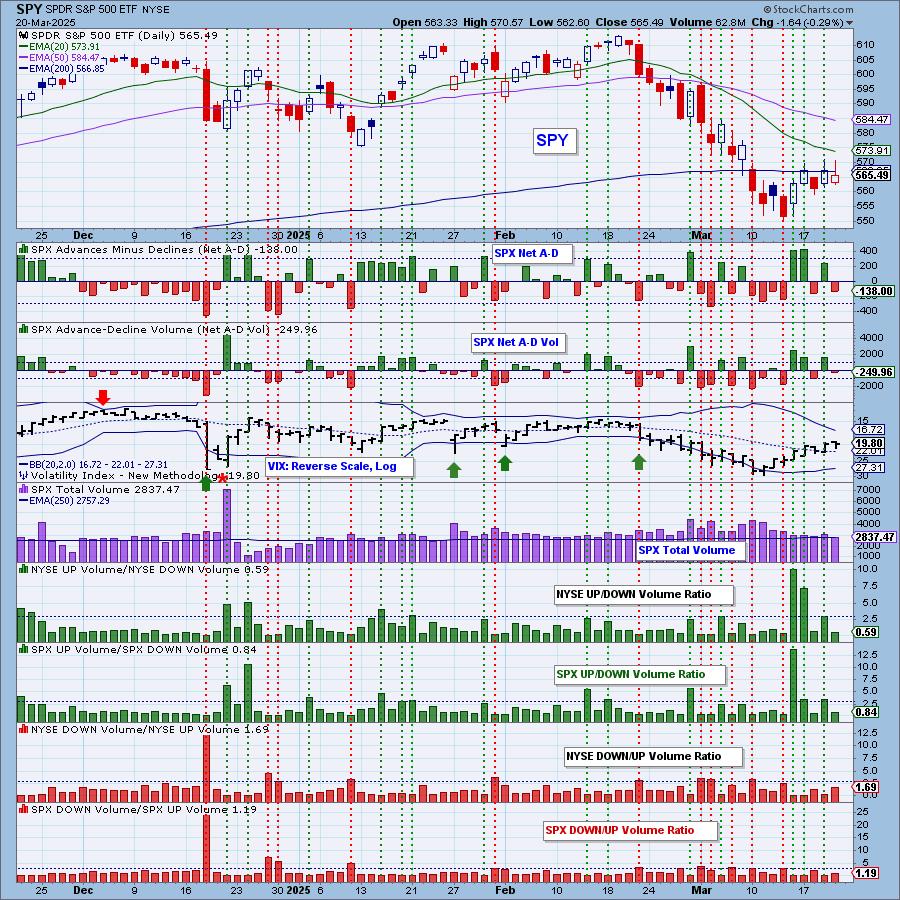
*A climax is a one-day event when market action generates very high readings in, primarily, breadth and volume indicators. We also include the VIX, watching for it to penetrate outside the Bollinger Band envelope. The vertical dotted lines mark climax days -- red for downside climaxes, and green for upside. Climaxes are at their core exhaustion events; however, at price pivots they may be initiating a change of trend.
Short-Term Market Indicators: The short-term market trend is DOWN and the condition is OVERBOUGHT.
We would say that both the Swenlin Trading Oscillators (STOs) are now in overbought territory and vulnerable to a reversal. They are still rising which is positive. Participation was little changed and we only lost a few rising PMOs.
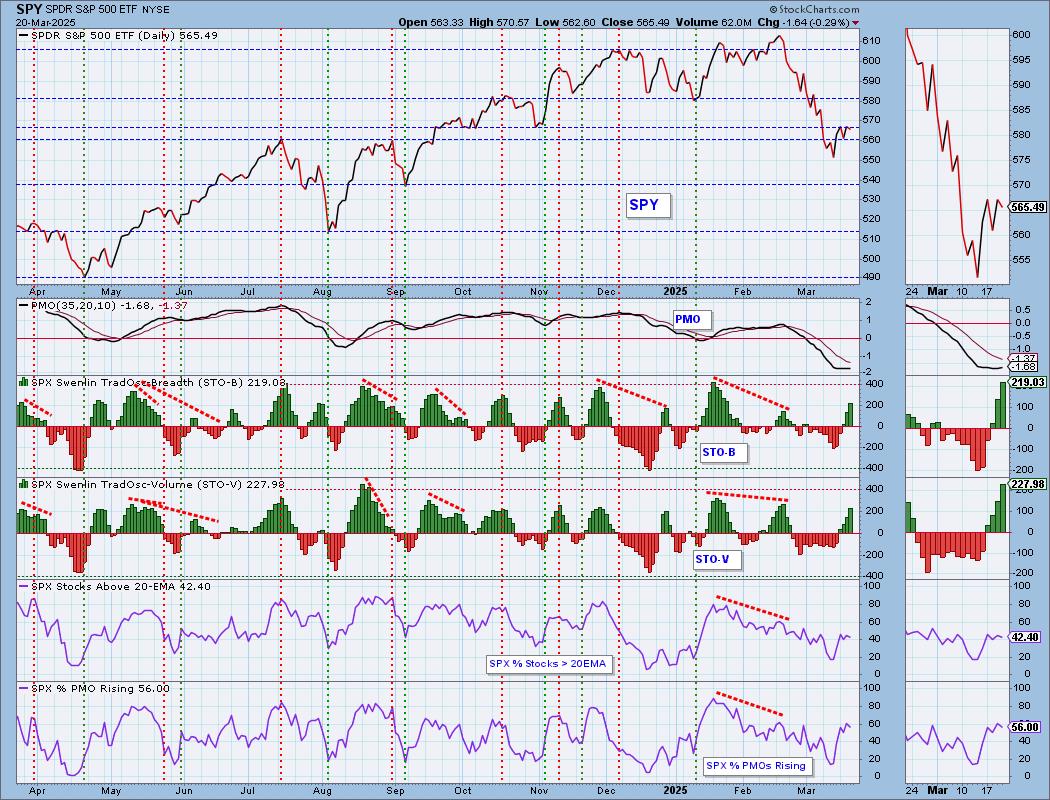
Intermediate-Term Market Indicators: The intermediate-term market trend is DOWN and the condition is NEUTRAL.
The ITBM and ITVM are rising but remain in negative territory. We are seeing more PMO BUY Signals which makes sense since we still have 56% of PMOs rising right now. It is likely to continue to expand.
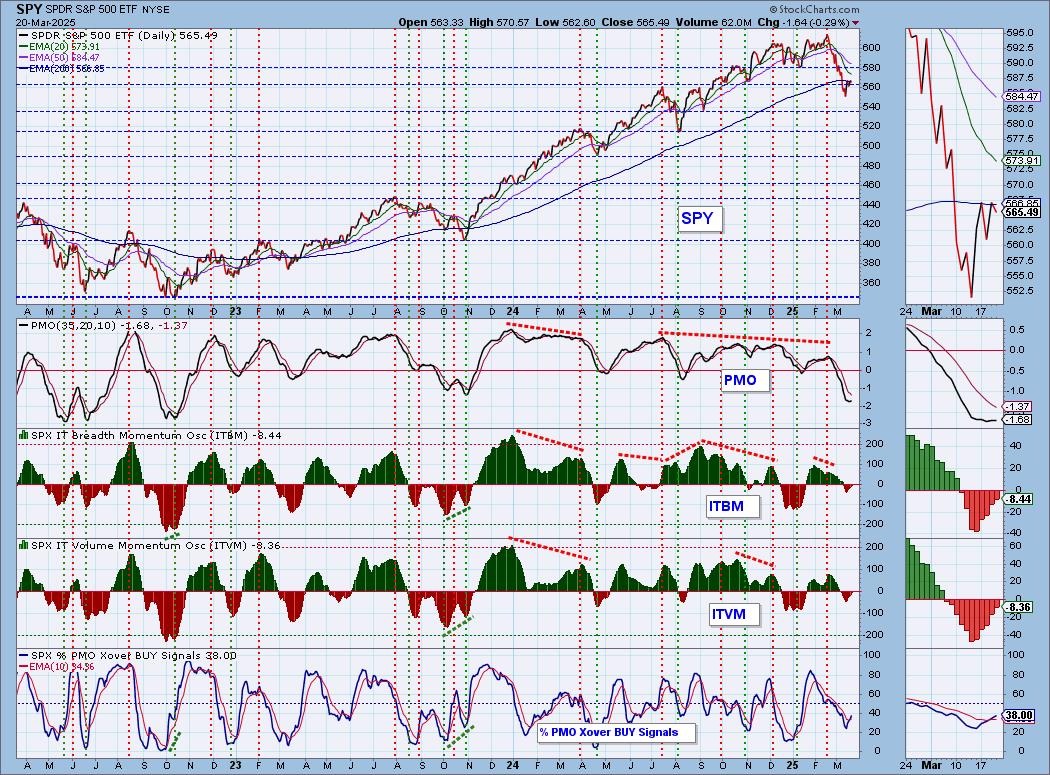
PARTICIPATION CHART (S&P 500): The following chart objectively shows the depth and trend of participation for the SPX in two time frames.
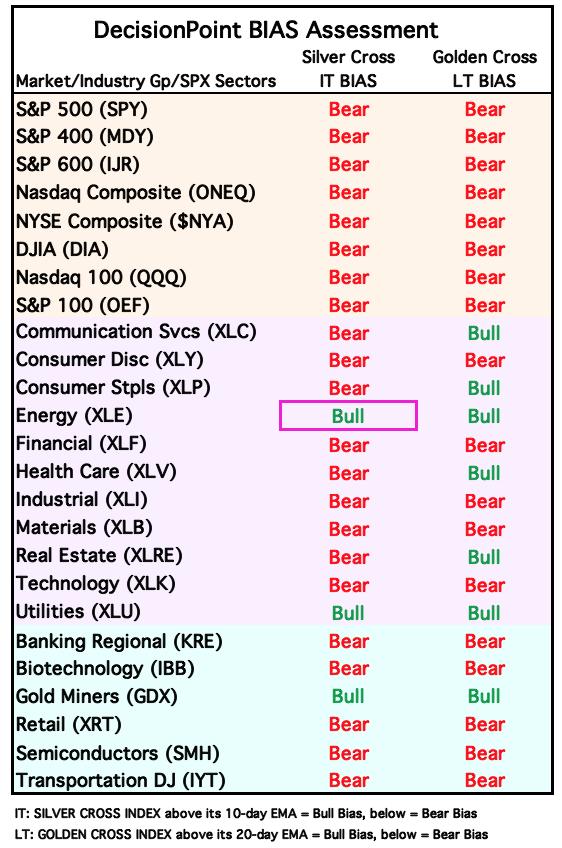
- Intermediate-Term - the Silver Cross Index (SCI) shows the percentage of SPX stocks on IT Trend Model BUY signals (20-EMA > 50-EMA). The opposite of the Silver Cross is a "Dark Cross" -- those stocks are, at the very least, in a correction.
- Long-Term - the Golden Cross Index (GCI) shows the percentage of SPX stocks on LT Trend Model BUY signals (50-EMA > 200-EMA). The opposite of a Golden Cross is the "Death Cross" -- those stocks are in a bear market.
The market bias is BEARISH in the intermediate- and long-term timeframes.
Participation is flattening out, not really rising, but not really falling. We do need to see some expansion in these numbers if the rally is to continue. The Silver Cross Index is trying to turn up. It could continue a little bit higher given there are still more stocks above their 50-day EMAs versus stocks with Silver Crosses. Price needs to stay above the 50-day EMA to keep a Silver Cross intact. It is below its signal line so the IT Bias is BEARISH. The Golden Cross Index topped below its signal line. It likely to continue moving lower given we have only 45% above their 200-day EMA versus 59% having Golden Crosses. The Golden Cross Index is below its signal line to the LT Bias is BEARISH.
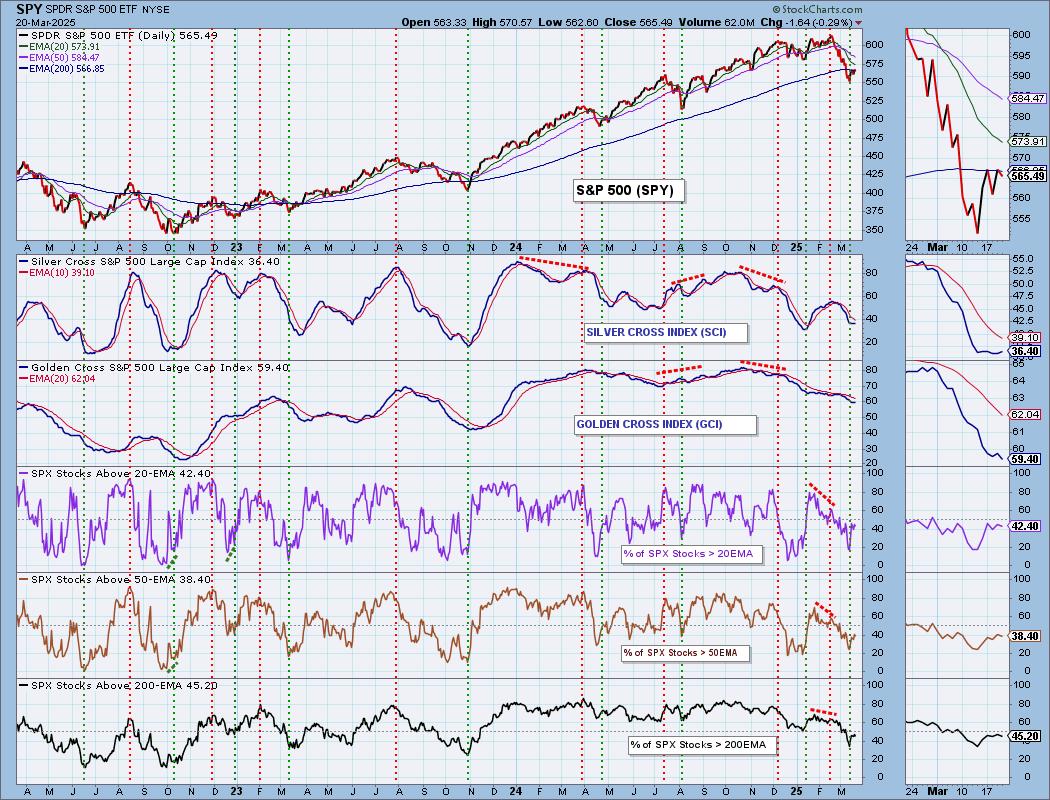
BIAS Assessment: The following table expresses the current BIAS of various price indexes based upon the relationship of the Silver Cross Index to its 10-day EMA (intermediate-term), and of the Golden Cross Index to its 20-day EMA (long-term). When the Index is above the EMA it is bullish, and it is bearish when the Index is below the EMA. The BIAS does not imply that any particular action should be taken. It is information to be used in the decision process.
The items with highlighted borders indicate that the BIAS changed today.
*****************************************************************************************************
CONCLUSION: We are in the midst of churn as the market decides if it has the energy and internals to continue to rally higher. We are still thinking that this could be a bear market rally. Downward price pressures of tariffs and the geopolitical/economic environment haven't gone anywhere. The market is still technically overvalued. Participation is stagnating now and the STOs are overbought. Price is still struggling to break the declining trend of this big decline. We see the possibility of more upside given indicators are rising, but we would caution against counting on this rally to get back to new all-time highs. Tomorrow is triple witching options expiration so we should expect high volume with the possibility of low volatility. Short squeezes could mean a positive close.
Erin is 20% long, 0% short. (This is intended as information, not a recommendation.)
*****************************************************************************************************
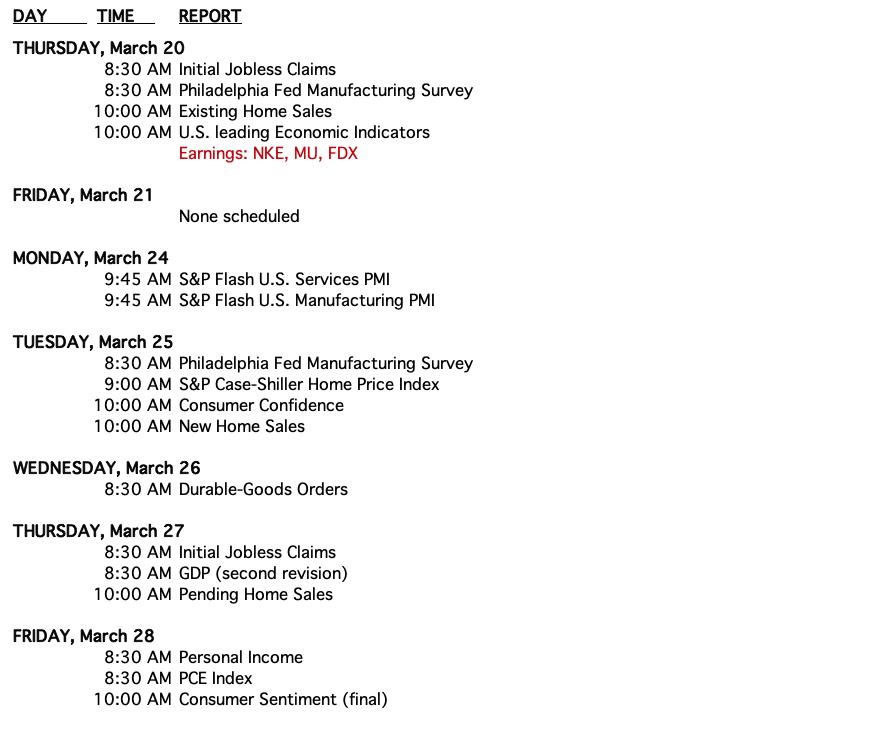
CALENDAR
Have you subscribed the DecisionPoint Diamonds yet? DP does the work for you by providing handpicked stocks/ETFs from exclusive DP scans! Add it with a discount! Contact support@decisionpoint.com for more information!
BITCOIN
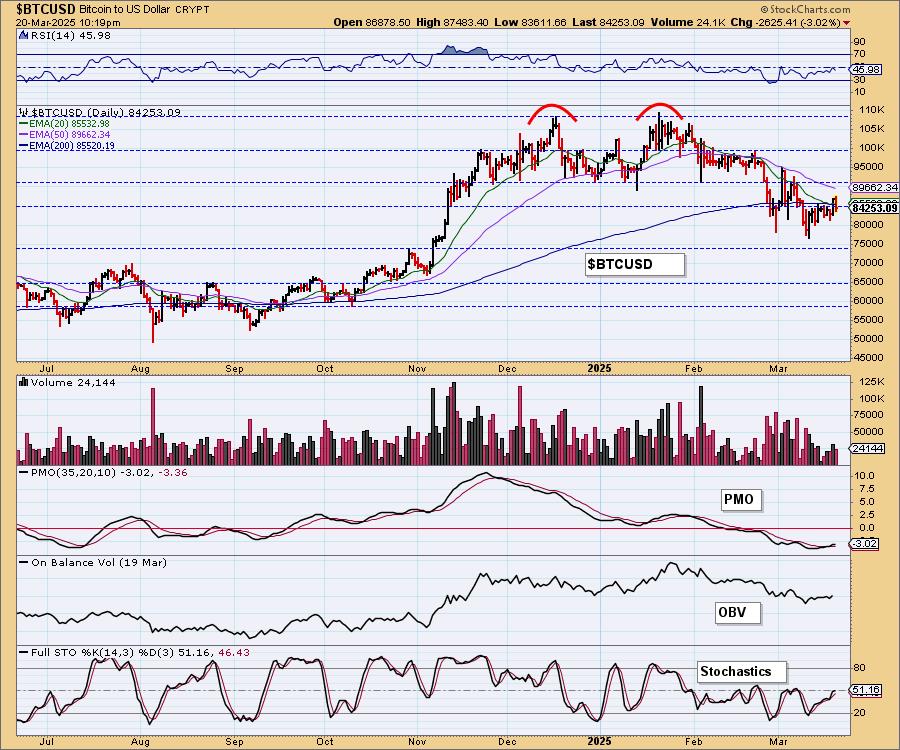
Bitcoin is still holding a declining trend out of the bearish double top so while the PMO is rising on a Crossover BUY Signal, we aren't that optimistic. The PMO is likely signaling diminishing weakness, not new strength. Stochastics did manage to get into positive territory and there is a short-term rising trend. Ultimately, the declining trend needs to be broken before we can get bullish.
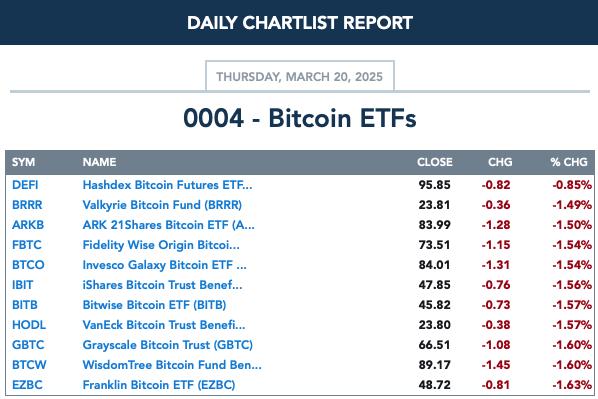
BITCOIN ETFs
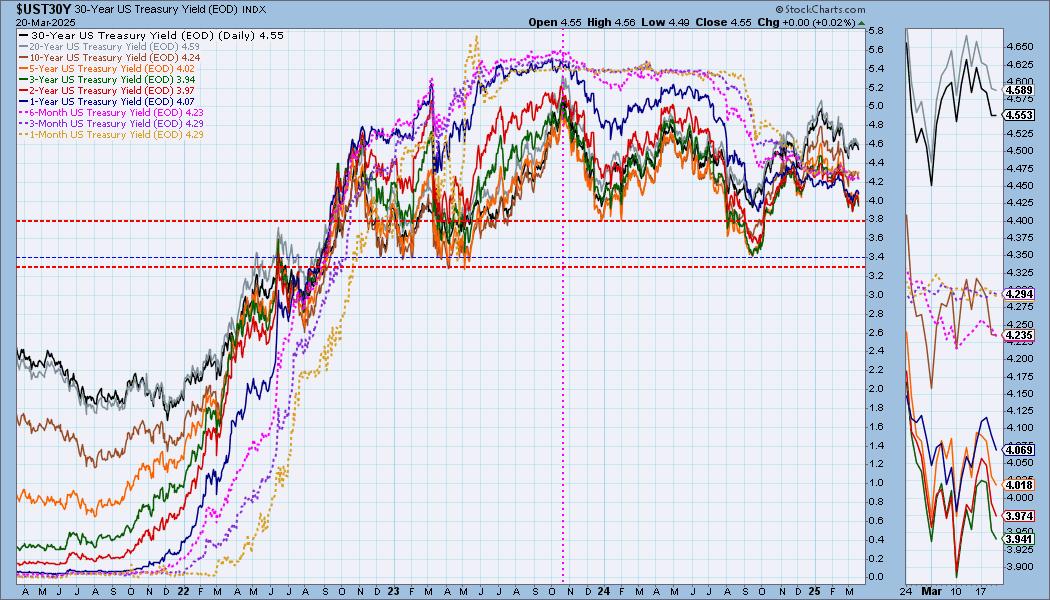
INTEREST RATES
Yields fell again today, keeping declining trends intact. We are looking for support to be reached soon. That is when we'll start looking for an upside reversal. For now, we expect declining trends will continue.
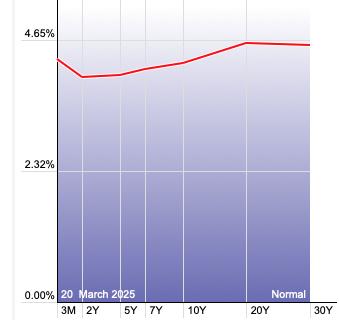
The Yield Curve Chart from StockCharts.com shows us the inversions taking place. The red line should move higher from left to right. Inversions are occurring where it moves downward.
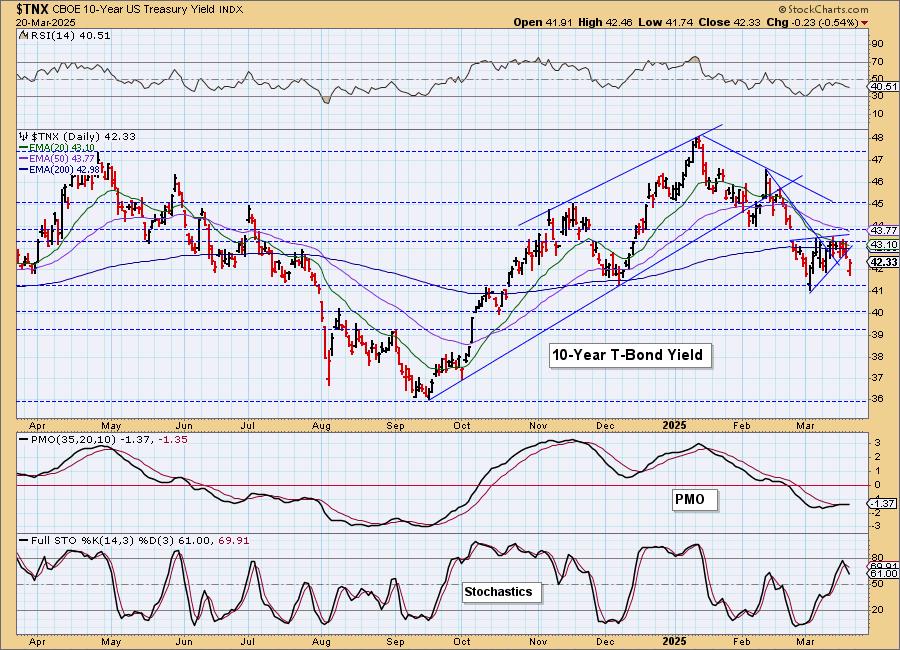
10-YEAR T-BOND YIELD
$TNX dropped heavily today. We had already seen a small breakdown out of the bearish rising wedge, today saw a strong continuation. The PMO has topped and triggered a Crossover SELL Signal below the zero line. Stochastics are dropping quickly so we expect to see more decline.
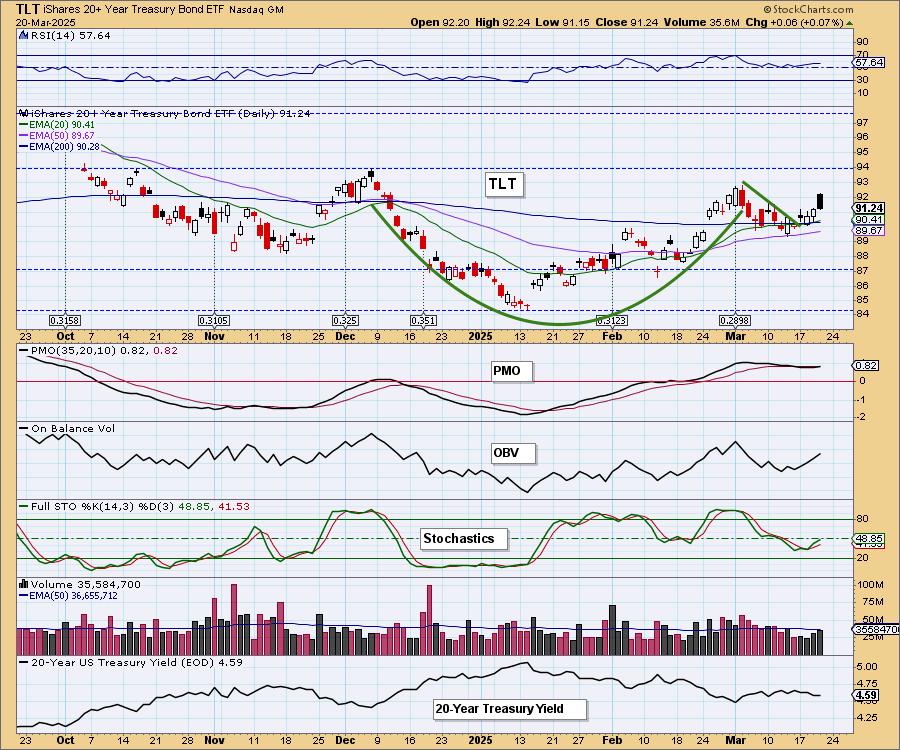
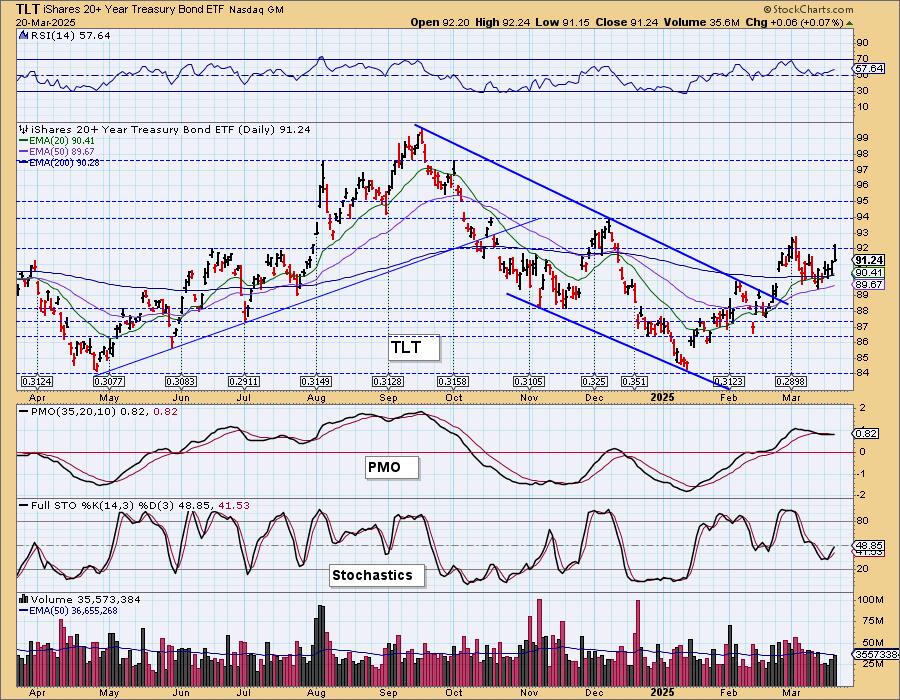
BONDS (TLT)
IT Trend Model: BUY as of 2/25/2025
LT Trend Model: SELL as of 12/13/2024
TLT Daily Chart: The bullish cup with handle is seeing the expected result of more rally. Today we did see a big bearish filled black candlestick so we could get a pause in the rally tomorrow. The PMO is in the process of crossing above its signal line and Stochastics are rising nicely so we do expect this advance to continue.
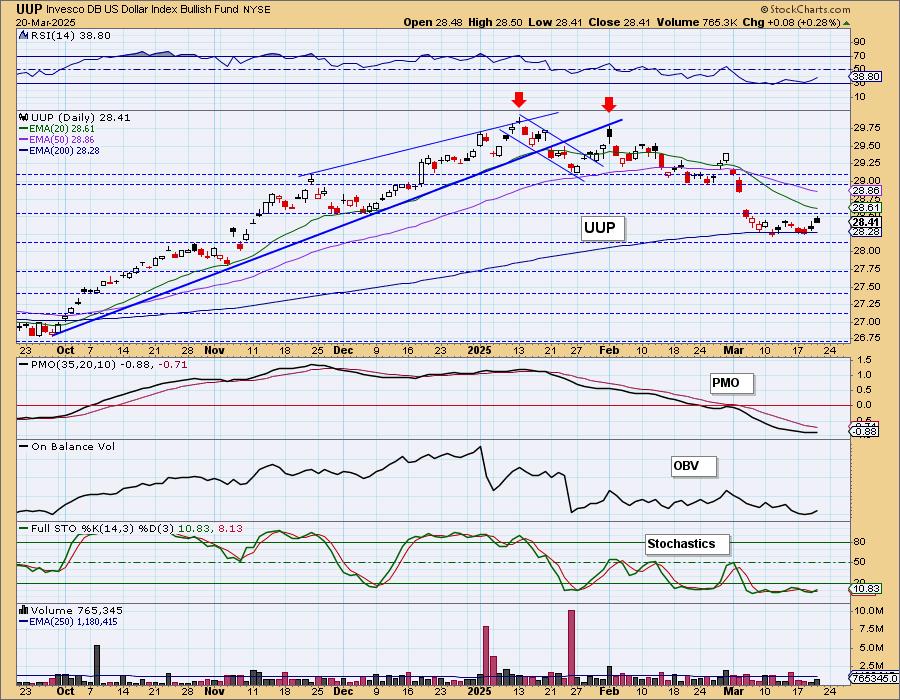
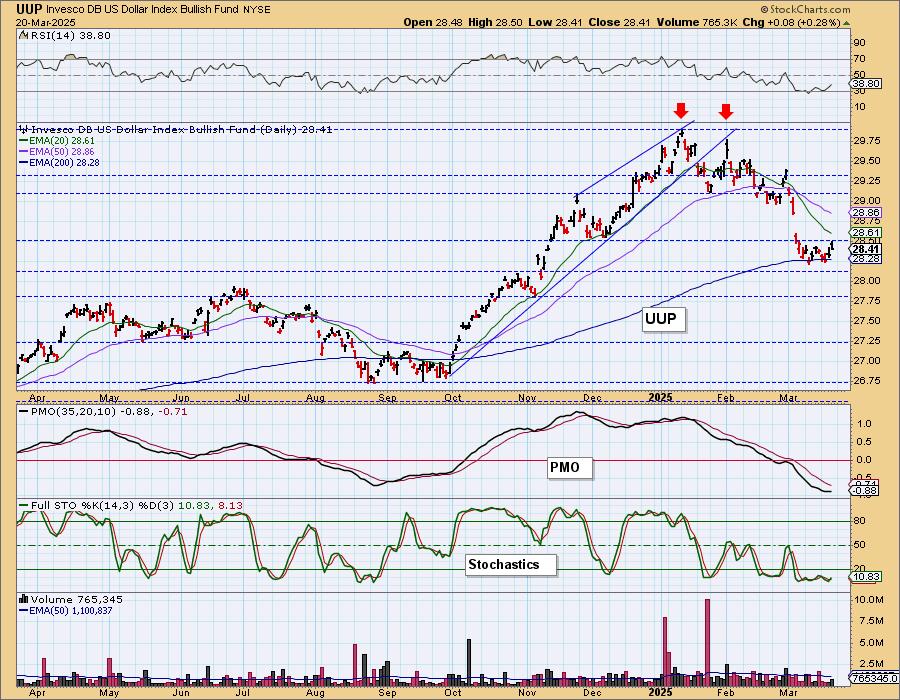
DOLLAR (UUP)
IT Trend Model: NEUTRAL as of 3/5/2025
LT Trend Model: BUY as of 5/25/2023
UUP Daily Chart: The Dollar is looking a little more interesting. It has formed a bullish double bottom in the process of consolidating above the 200-day EMA. It isn't very tall so the minimum upside target wouldn't get us very far, but it does suggest a small breakout ahead. The PMO technically turned up today, but we would chalk this up to diminishing weakness not new strength. We see some upside ahead, but aren't looking for a big rebound. We do have to say though, it has formed an island and typically we'll get a reversal out of those.
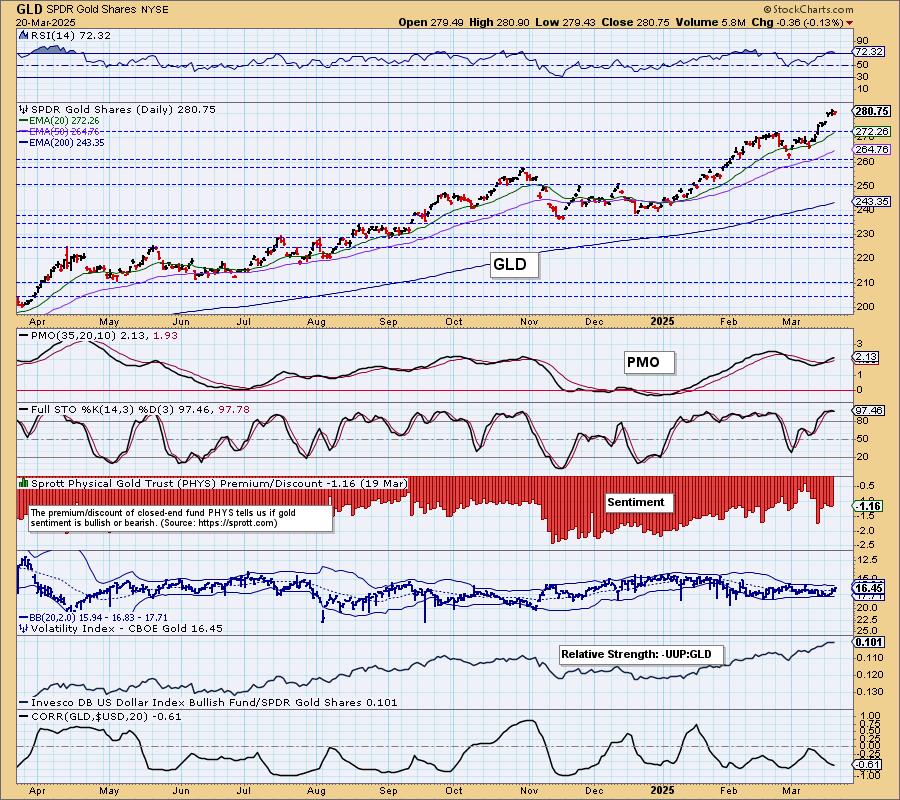
GOLD
IT Trend Model: BUY as of 1/10/2025
LT Trend Model: BUY as of 10/20/2023
GLD Daily Chart: Gold is clearly overbought right now and the Dollar is showing signs of improvement. We think that we will see a pause or possible decline here. Indicators are still strong, but that overbought RSI is what has us looking for a pause since it is overbought. Sideways movement would clear the overbought condition of the RSI.
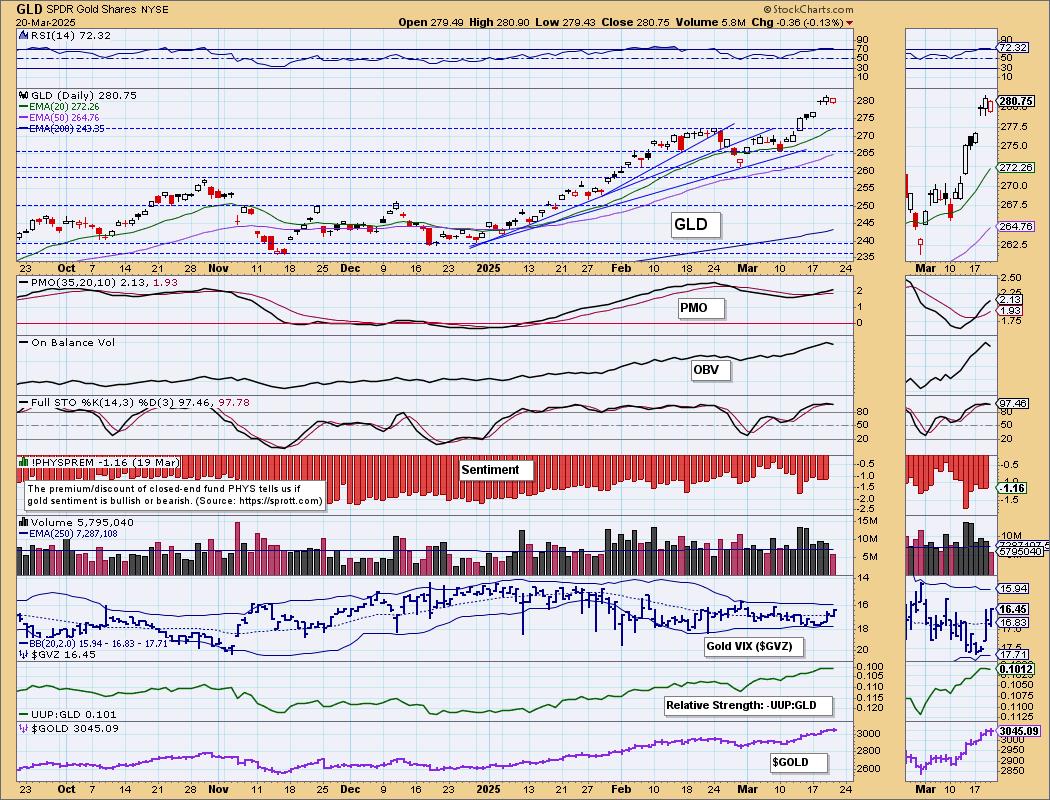
Relative strength is still excellent for Gold against the Dollar so a rising Dollar may not cause a big decline in Gold.
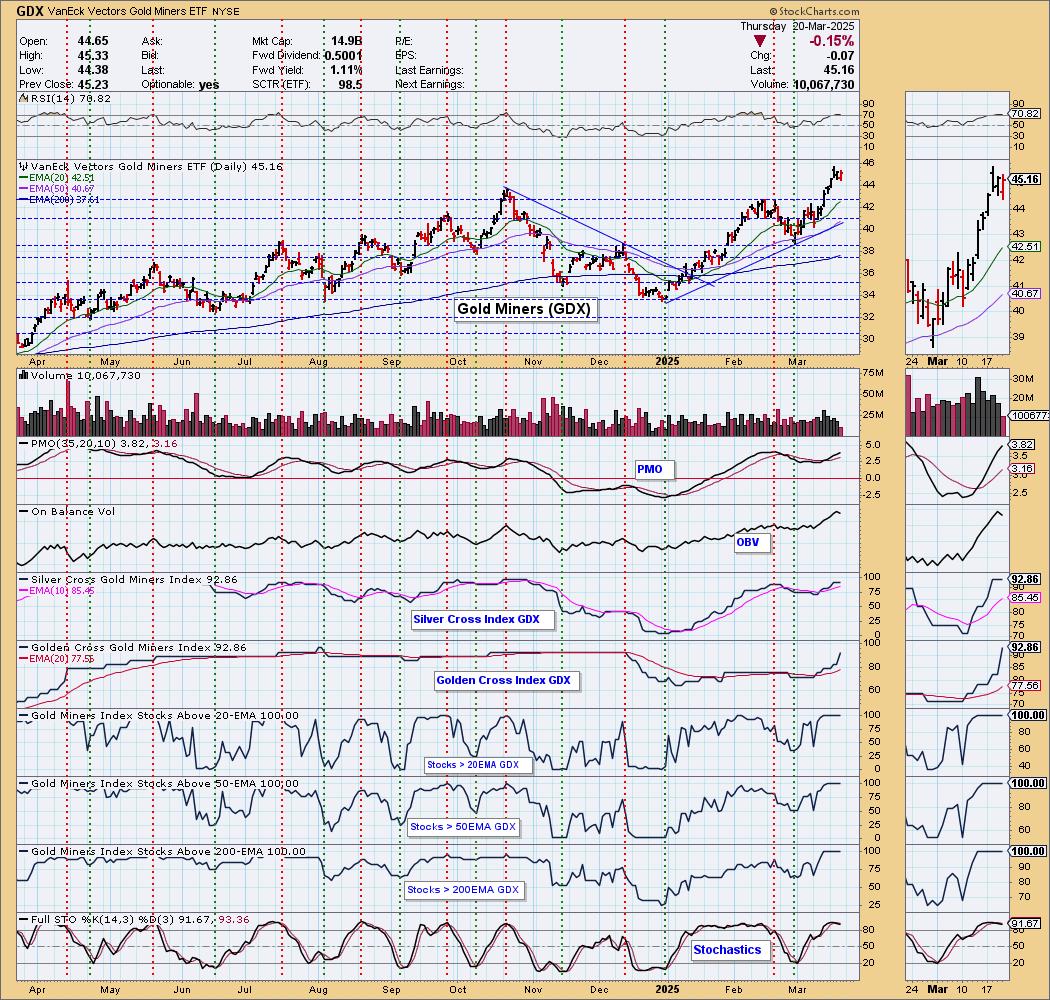
GOLD MINERS (GDX) Daily Chart: With Gold down on the day, Gold Miners pulled back. It does look toppy right now, but with such strong participation readings at 100%, a decline shouldn't be too painful. The RSI is overbought so this top makes sense.
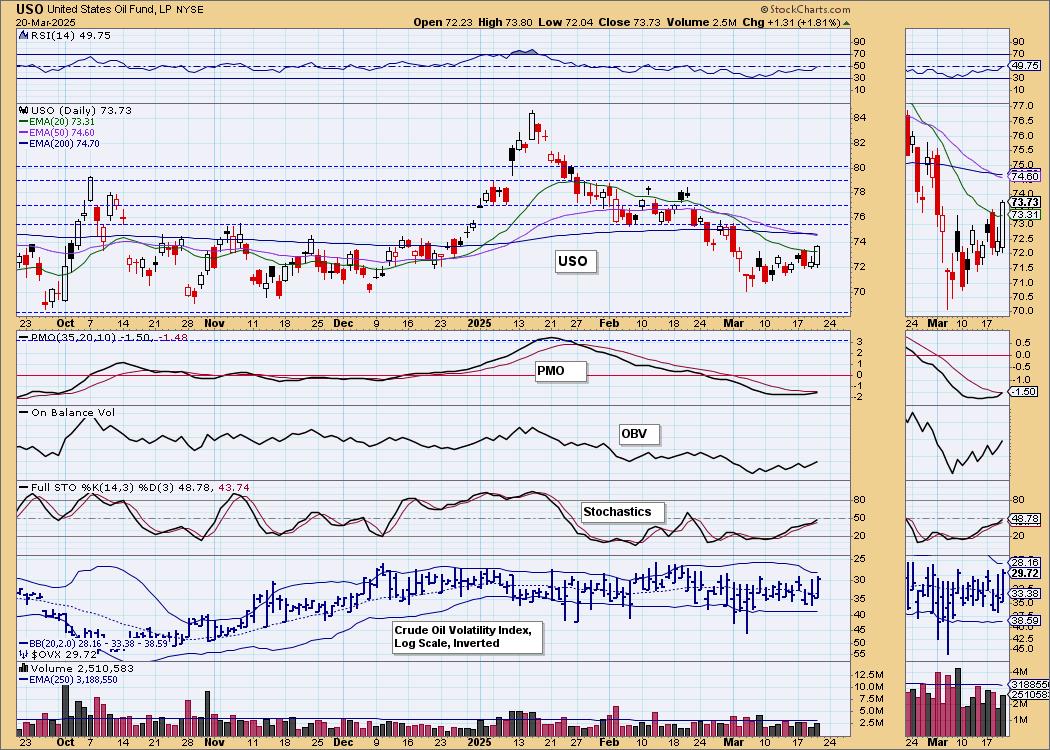
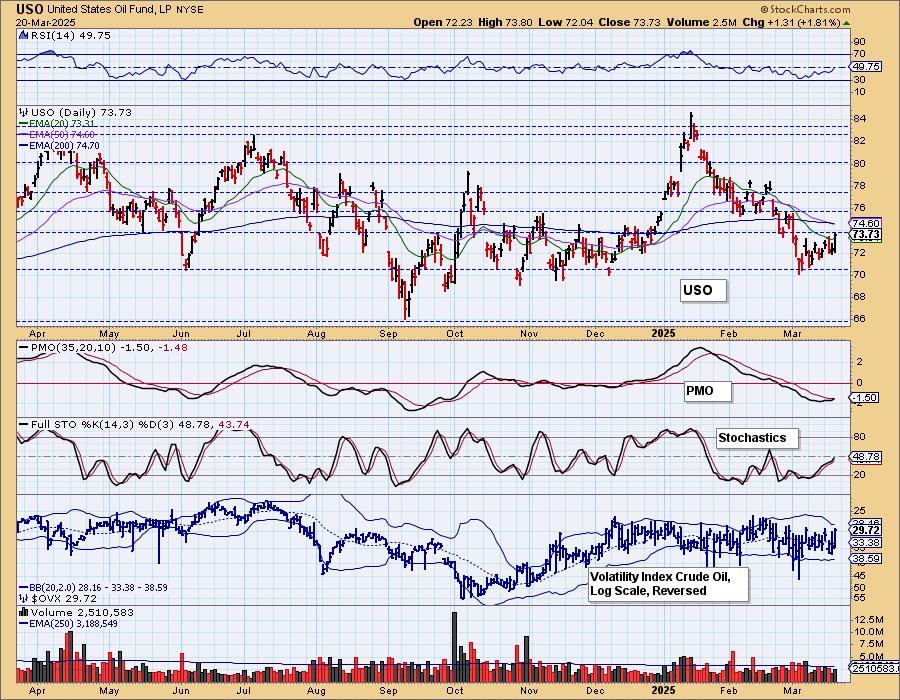
CRUDE OIL (USO)
IT Trend Model: NEUTRAL as of 2/27/2025
LT Trend Model: SELL as of 3/18/2025
USO Daily Chart: Crude Oil is continuing in a short-term rising trend. The PMO is nearing a Crossover BUY Signal, but it is still very negative so it isn't necessarily new strength. Stochastics are rising gently. We see more upside possible for Crude as the declining trend has been broken, but these mediocre indicators tell us this rising trend is vulnerable. The recent Death Cross doesn't help matters. The administration is working hard to bring down Energy costs so downside pressure is being applied. We suspect a decline will occur at the next level of overhead resistance.
Good Luck & Good Trading!
Erin Swenlin and Carl Swenlin
Technical Analysis is a windsock, not a crystal ball. --Carl Swenlin
(c) Copyright 2025 DecisionPoint.com
Disclaimer: This blog is for educational purposes only and should not be construed as financial advice. The ideas and strategies should never be used without first assessing your own personal and financial situation, or without consulting a financial professional. Any opinions expressed herein are solely those of the author, and do not in any way represent the views or opinions of any other person or entity.
DecisionPoint is not a registered investment advisor. Investment and trading decisions are solely your responsibility. DecisionPoint newsletters, blogs or website materials should NOT be interpreted as a recommendation or solicitation to buy or sell any security or to take any specific action.
NOTE: The signal status reported herein is based upon mechanical trading model signals, specifically, the DecisionPoint Trend Model. They define the implied bias of the price index based upon moving average relationships, but they do not necessarily call for a specific action. They are information flags that should prompt chart review. Further, they do not call for continuous buying or selling during the life of the signal. For example, a BUY signal will probably (but not necessarily) return the best results if action is taken soon after the signal is generated. Additional opportunities for buying may be found as price zigzags higher, but the trader must look for optimum entry points. Conversely, exit points to preserve gains (or minimize losses) may be evident before the model mechanically closes the signal.
Helpful DecisionPoint Links:
DecisionPoint Alert Chart List
DecisionPoint Golden Cross/Silver Cross Index Chart List
DecisionPoint Sector Chart List
Price Momentum Oscillator (PMO)