
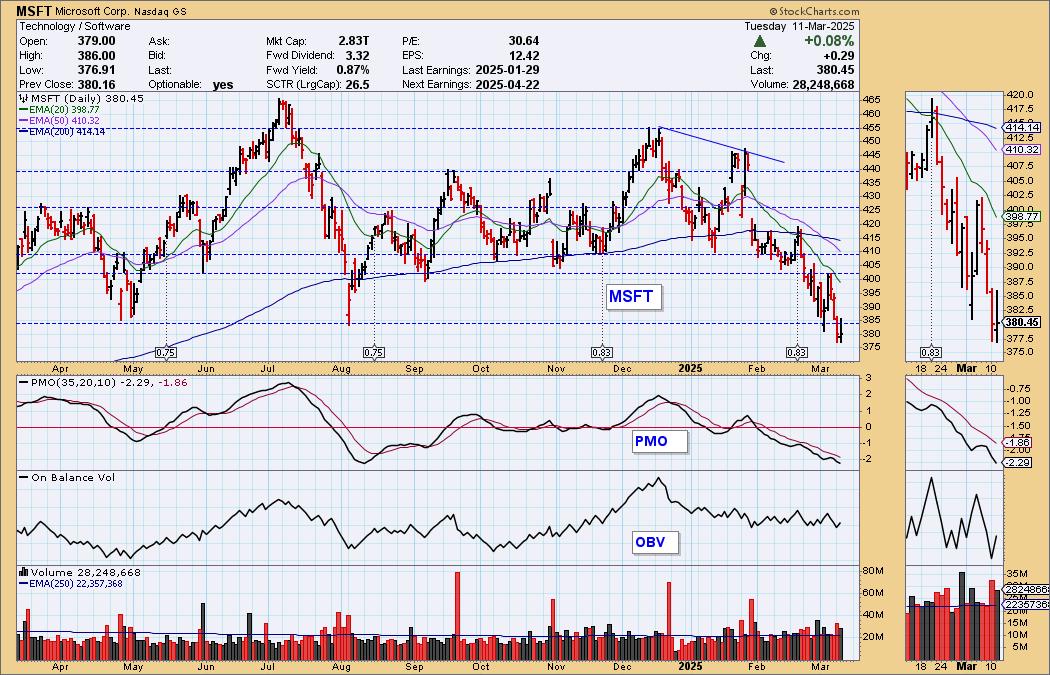
Microsoft (MSFT) has been in a declining trend most of the year. On yesterday's decline it lost significant support. It wasn't able to get back above that line even with a small rally today. The PMO has topped for a second time beneath its signal line well below the zero line. OBV bottoms are moving sideways so this could be seen as a slight positive divergence. It seems MSFT is long overdue for at least a relief rally.
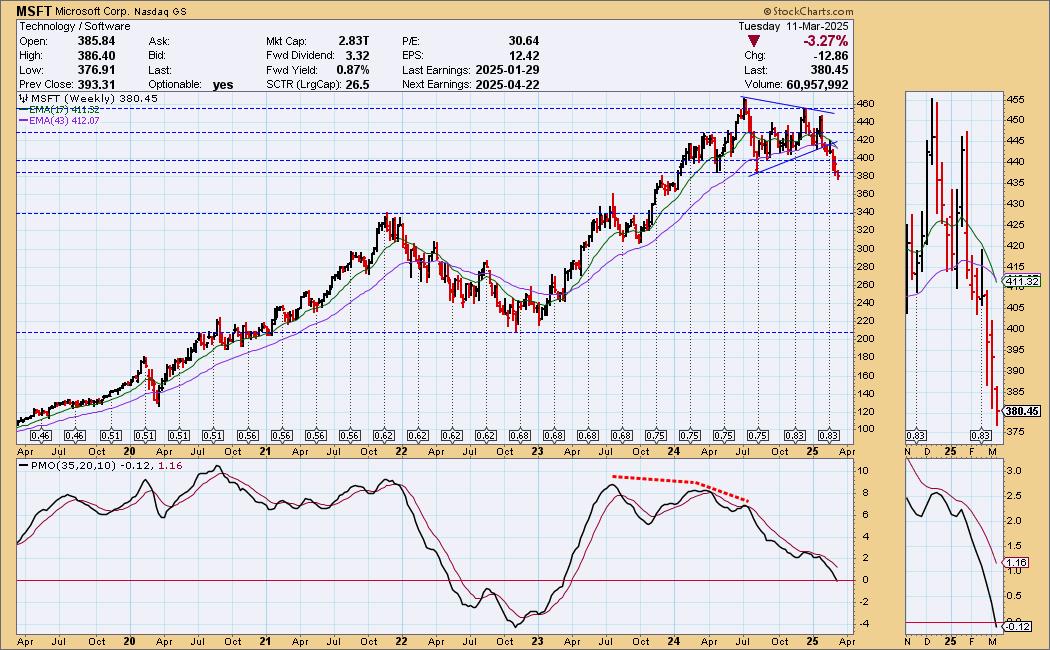
We can really see how significant this level of support was on the weekly chart. Price dropped from the symmetrical triangle formation. Given those are continuation patterns, we should have seen an upside breakout to continue the prior rising trend. The next level of strong support doesn't arriving until 340. The weekly PMO has just entered negative territory.
The DecisionPoint Alert Weekly Wrap presents an end-of-week assessment of the trend and condition of the Stock Market, the U.S. Dollar, Gold, Crude Oil, and Bonds. The DecisionPoint Alert daily report (Monday through Thursday) is abbreviated and gives updates on the Weekly Wrap assessments.
Watch the latest episode of DecisionPoint on our YouTube channel here!
MARKET/INDUSTRY GROUP/SECTOR INDEXES
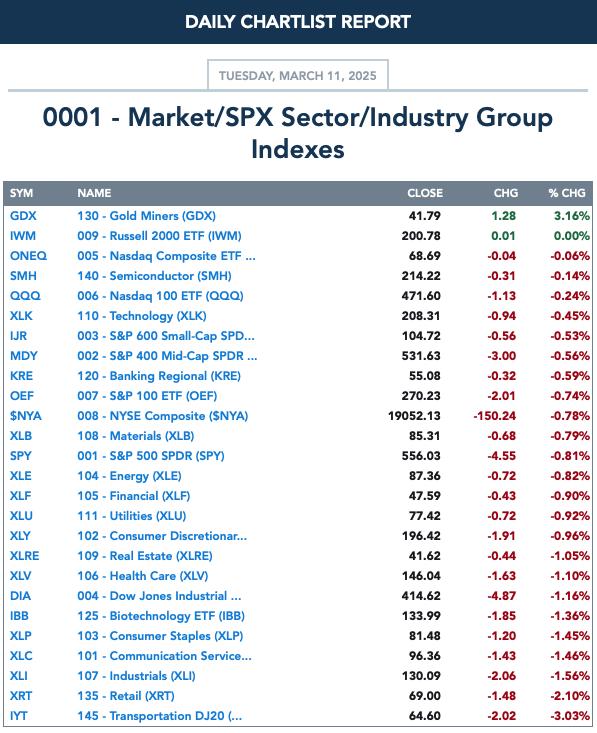
CLICK HERE for Carl's annotated Market Index, Sector, and Industry Group charts.
THE MARKET (S&P 500)
IT Trend Model: NEUTRAL as of 3/4/2025
LT Trend Model: BUY as of 3/29/2023
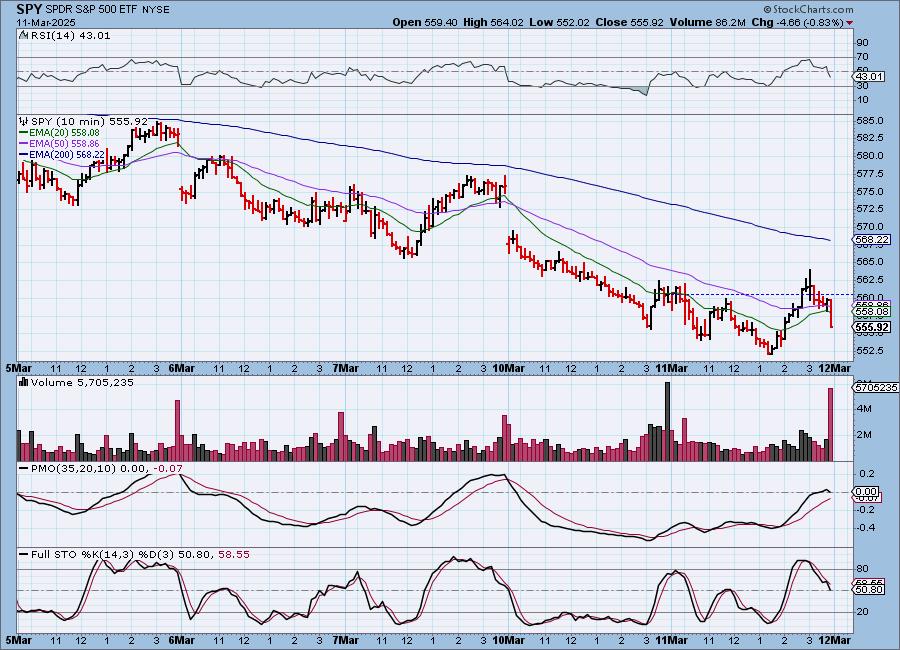
SPY 10-Minute Chart: The market held a declining trend into the lunch hour, but managed to come back to life. Unfortunately the rally could not be sustained and price dropped into negative territory to finish the day. The 10-minute PMO topped and Stochastics are moving lower so we could see some followthrough on this decline tomorrow.
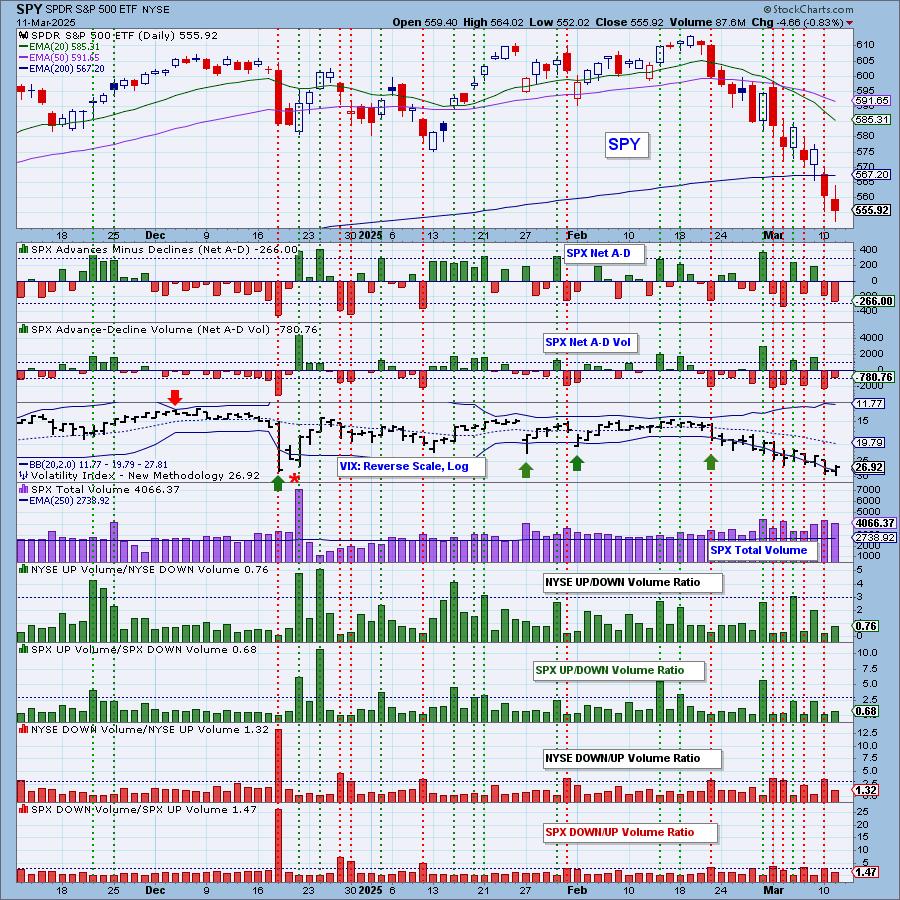
SPY Daily Chart: Support is no longer visible on our 5-month candlestick chart. The PMO is falling fast.
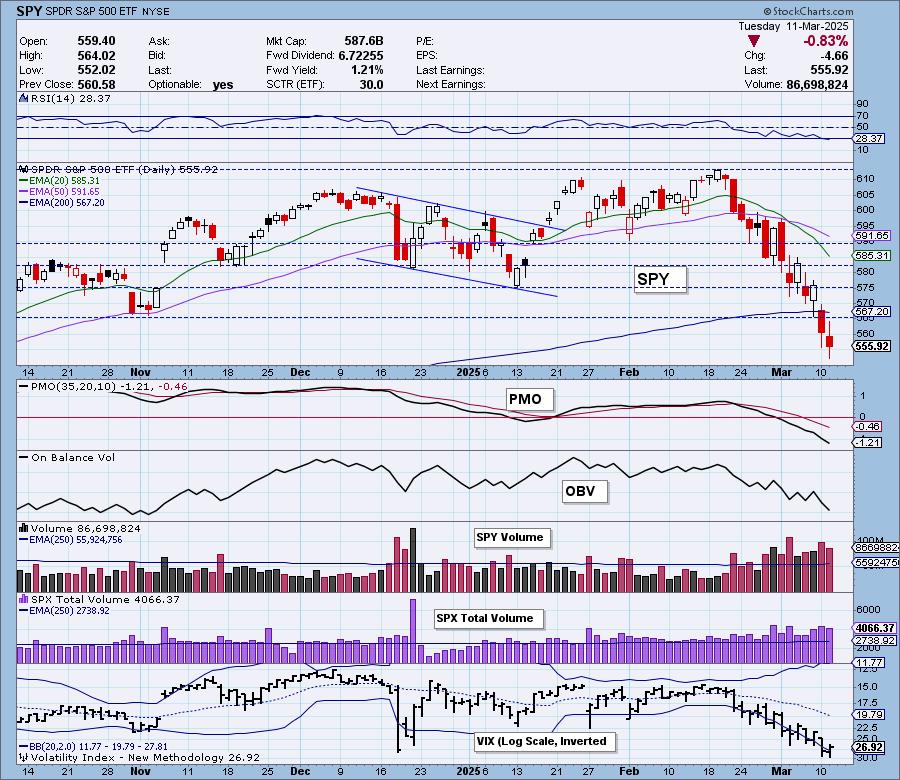
The VIX is clearly oversold right now and that does leave us open to the idea of an upside reversal particularly given it has punctured the lower Bollinger Band on the inverted scale numerous times. Stochastics however look particularly weak as they oscillate below 20, a sign of extreme weakness.
 DON'T DELAY! IT'S FREE!
Here is the latest recording from 3/10. Click HERE to get to our video list.:
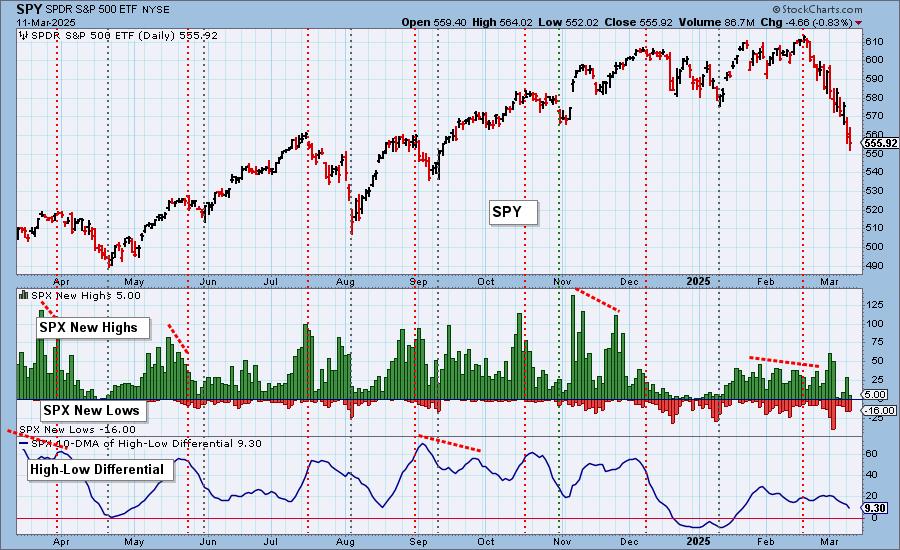
S&P 500 New 52-Week Highs/Lows: It wasn't surprising to see more New Lows than New Highs on the decline. New Lows are not oversold yet. The High-Low Differential continues to move lower.
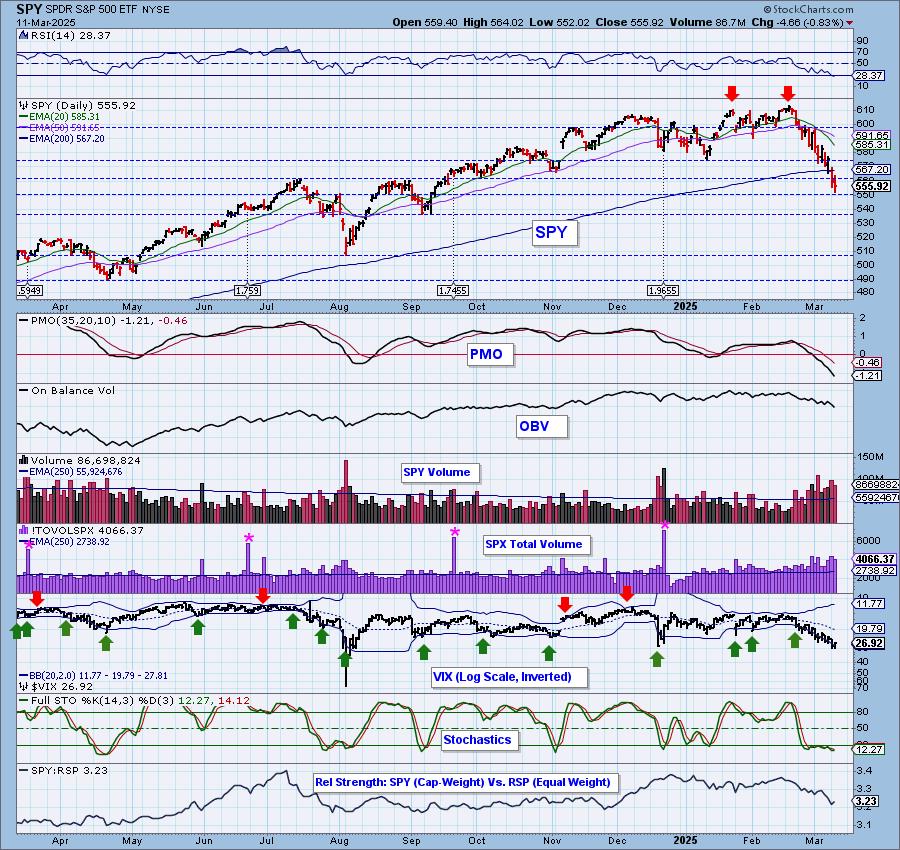
Climax* Analysis: There were no climax readings today.
*A climax is a one-day event when market action generates very high readings in, primarily, breadth and volume indicators. We also include the VIX, watching for it to penetrate outside the Bollinger Band envelope. The vertical dotted lines mark climax days -- red for downside climaxes, and green for upside. Climaxes are at their core exhaustion events; however, at price pivots they may be initiating a change of trend.
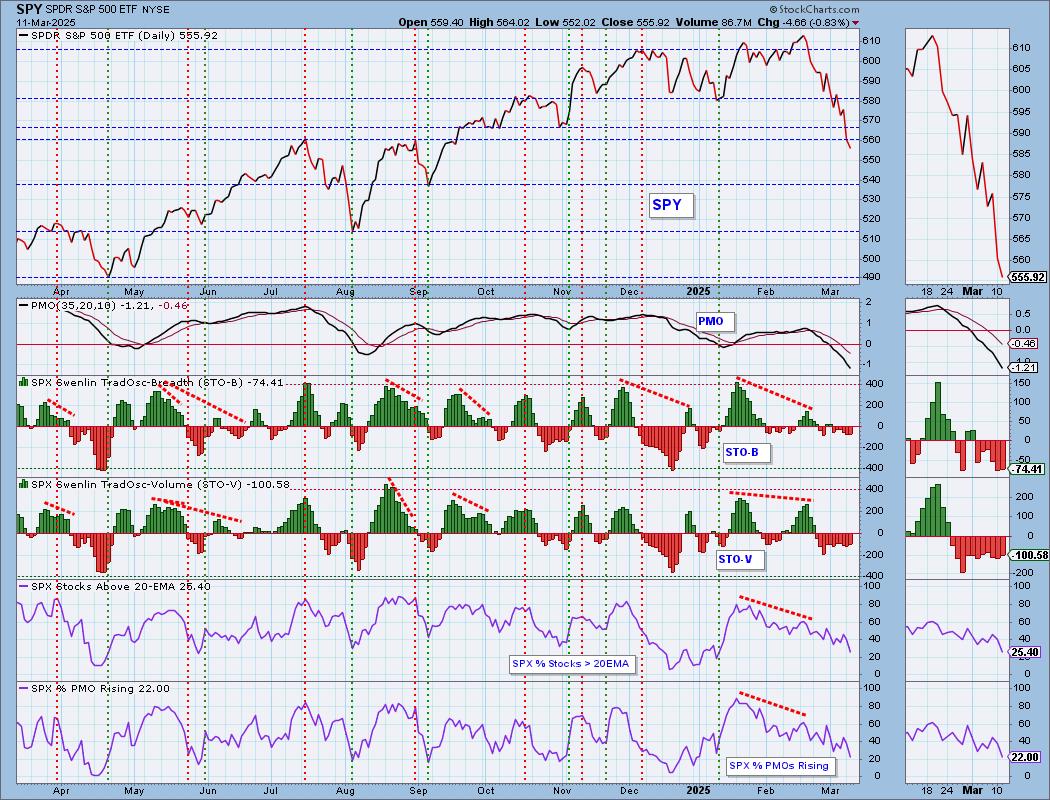
Short-Term Market Indicators: The short-term market trend is DOWN and the condition is NEUTRAL.
The Swenlin Trading Oscillators (STOs) did rise today, slightly. It isn't a full vote of confidence given their choppy readings, but it does suggest the market has gotten overextended. Participation continues to melt away with only 25% holding above their 20-day EMAs. Rising PMOs are only at 22%. That reading is beginning to get oversold.
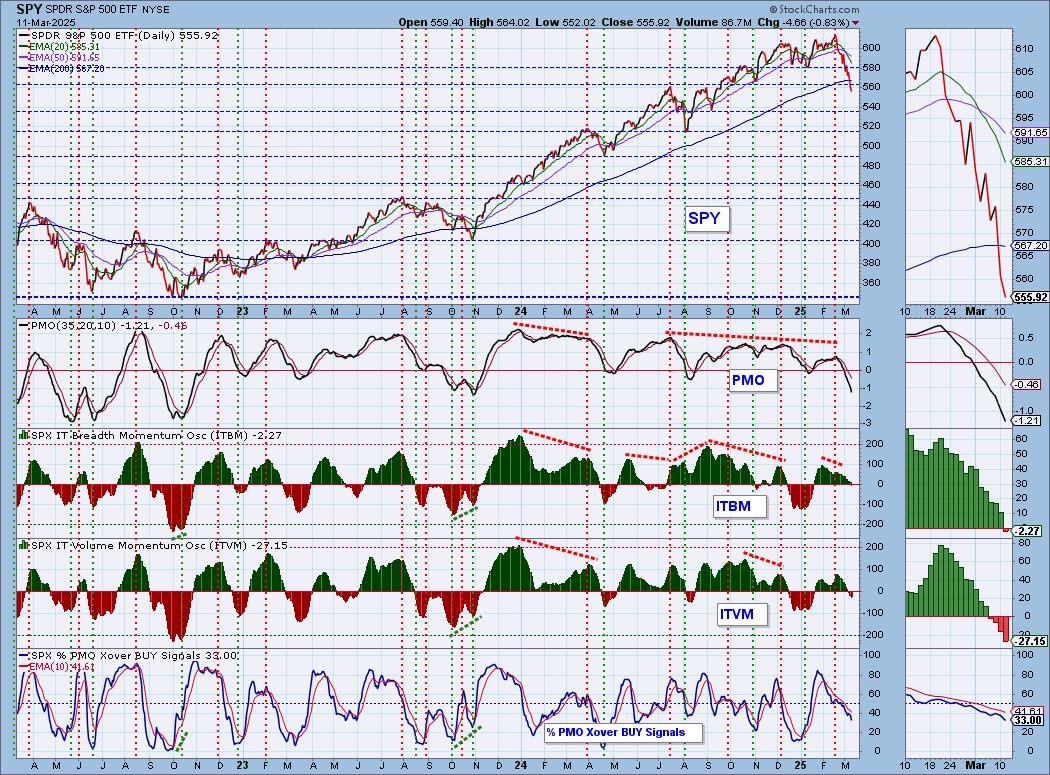
Intermediate-Term Market Indicators: The intermediate-term market trend is DOWN and the condition is NEUTRAL.
The ITBM finally hit negative territory today. Both the ITBM and ITVM continue to decline which doesn't bode well for the intermediate term. Only 1/3rd of the index hold PMO BUY Signals. It will be difficult to dig out of this decline with so few stocks participating.
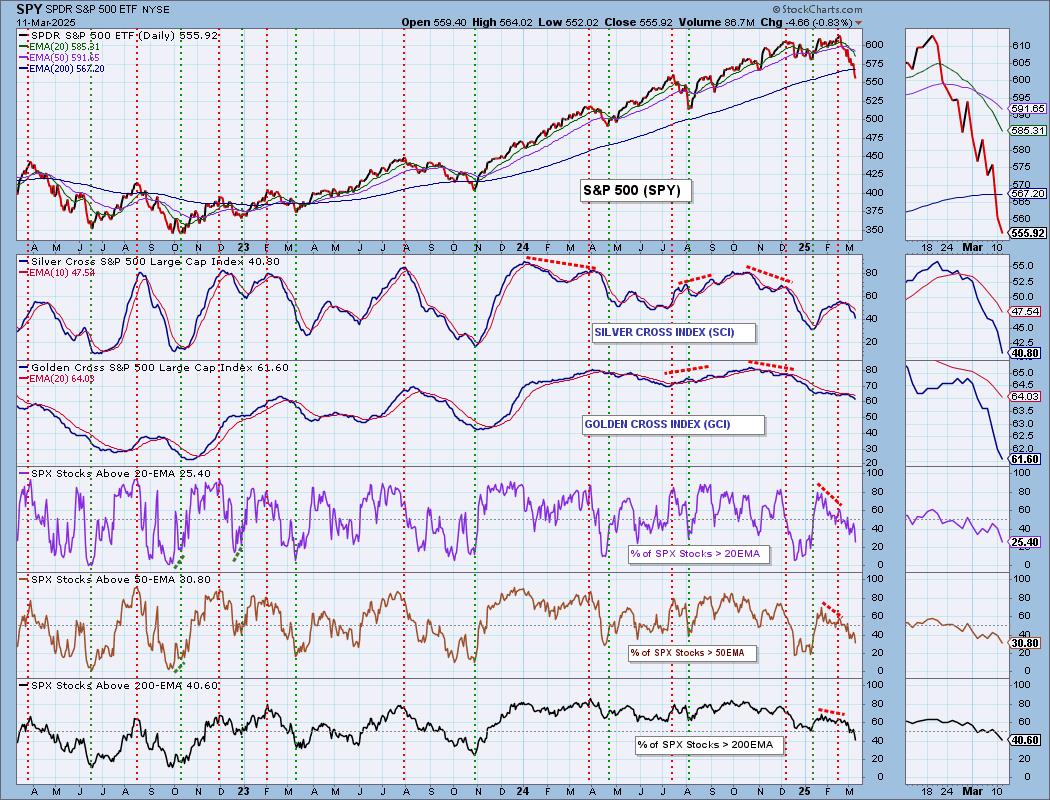
PARTICIPATION CHART (S&P 500): The following chart objectively shows the depth and trend of participation for the SPX in two time frames.
- Intermediate-Term - the Silver Cross Index (SCI) shows the percentage of SPX stocks on IT Trend Model BUY signals (20-EMA > 50-EMA). The opposite of the Silver Cross is a "Dark Cross" -- those stocks are, at the very least, in a correction.
- Long-Term - the Golden Cross Index (GCI) shows the percentage of SPX stocks on LT Trend Model BUY signals (50-EMA > 200-EMA). The opposite of a Golden Cross is the "Death Cross" -- those stocks are in a bear market.
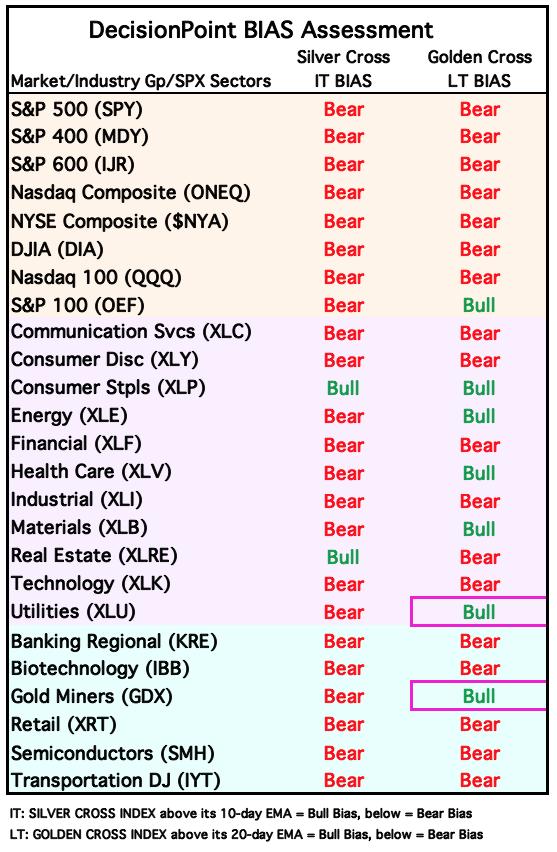
The market bias is BEARISH in the intermediate and long terms.
Participation continues to melt away, but readings of stocks above key moving averages are not oversold yet. Stocks above their 200-day EMAs is really failing right now, taking it to levels not seen since late 2023 decline. As the index loses support at the 200-day EMA, it isn't surprising that most of the stocks within are losing that support level. Both the Silver Cross Index and Golden Cross Index are below their signal lines so the IT and LT Bias is BEARISH.
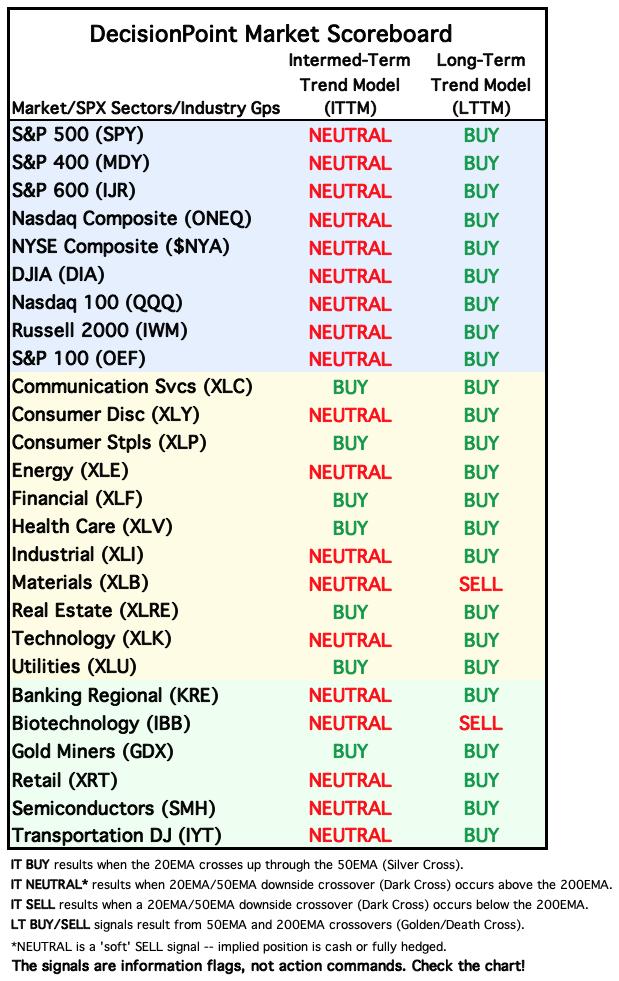
BIAS Assessment: The following table expresses the current BIAS of various price indexes based upon the relationship of the Silver Cross Index to its 10-day EMA (intermediate-term), and of the Golden Cross Index to its 20-day EMA (long-term). When the Index is above the EMA it is bullish, and it is bearish when the Index is below the EMA. The BIAS does not imply that any particular action should be taken. It is information to be used in the decision process.
The items with highlighted borders indicate that the BIAS changed today.
*****************************************************************************************************
CONCLUSION: Important support has been lost on the SPY as price is getting further extended on the current decline. This deep decline calls for some sort of snapback but the economic and geopolitical environment are up in the air and that uncertainty along with the word "recession" being heard now has spooked investors. We don't think the decline is over with, but price has been under pressure for some time. The STOs did turn up so that could be the sign that a snapback is at hand. Given overall weakness in participation and the sliding Silver Cross Index, we would not expect any rally to have a lasting impact.
Erin is 10% long, 0% short. (This is intended as information, not a recommendation.)
*****************************************************************************************************
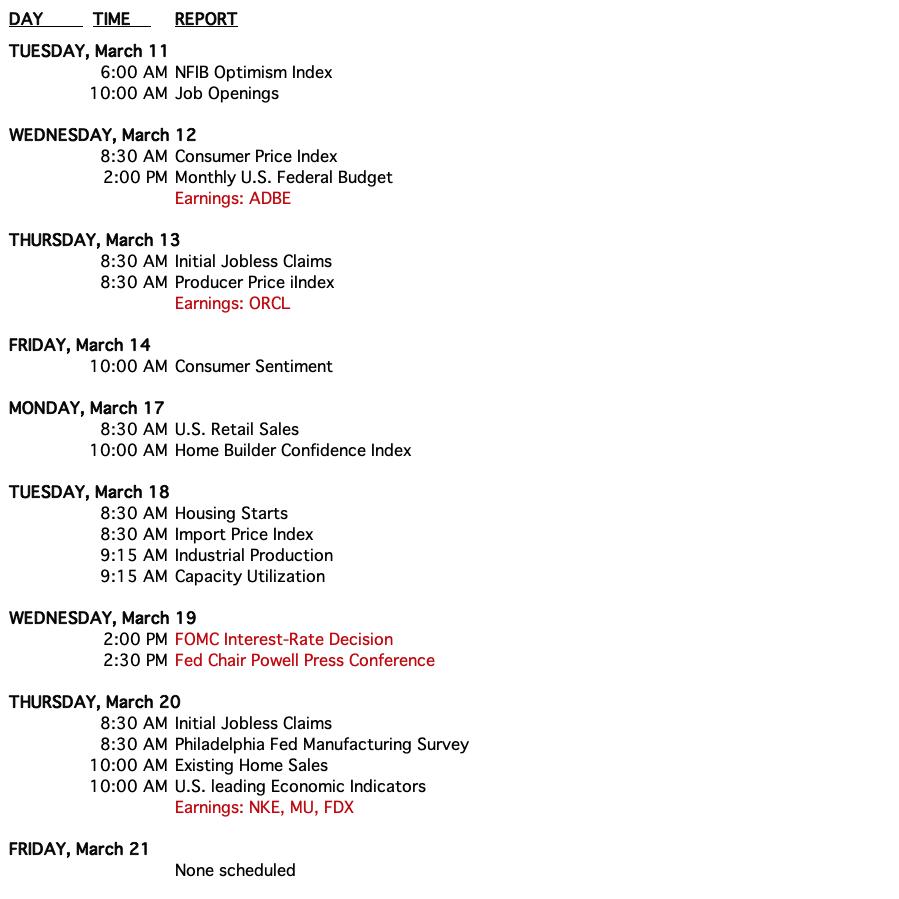
CALENDAR
Have you subscribed the DecisionPoint Diamonds yet? DP does the work for you by providing handpicked stocks/ETFs from exclusive DP scans! Add it with a discount! Contact support@decisionpoint.com for more information!
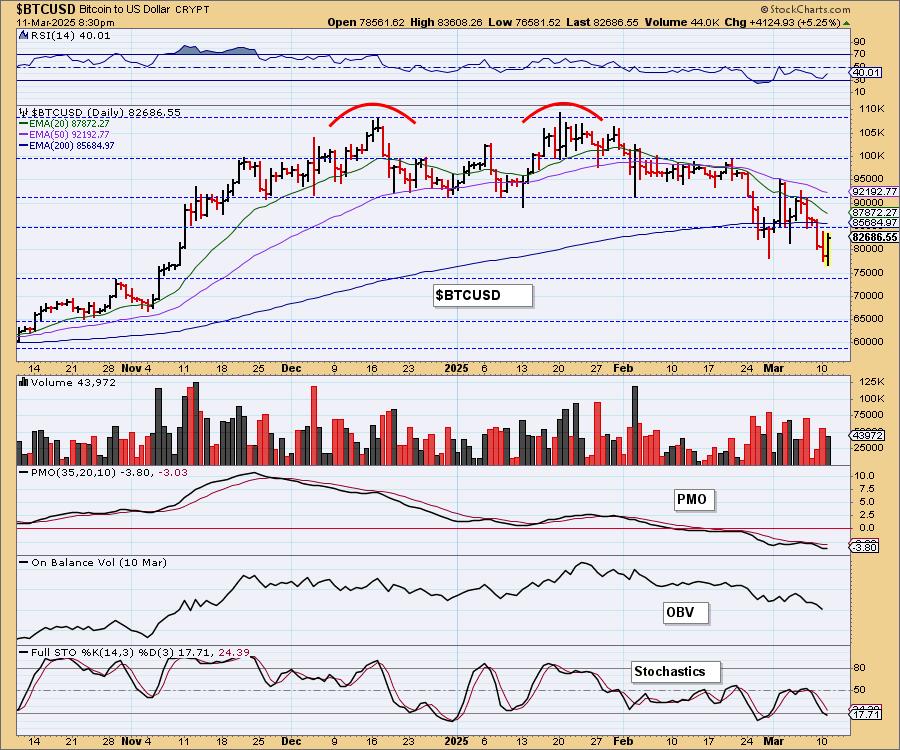
BITCOIN
Bitcoin reversed and had a strong day. It did nothing to alleviate the current declining trend, but it is coming off support at 75,000 which could mean a possible upside reversal in the works. The PMO is turning back up on this rally. However, Stochastics are still problematic so we aren't going to get fully bullish on Bitcoin yet.
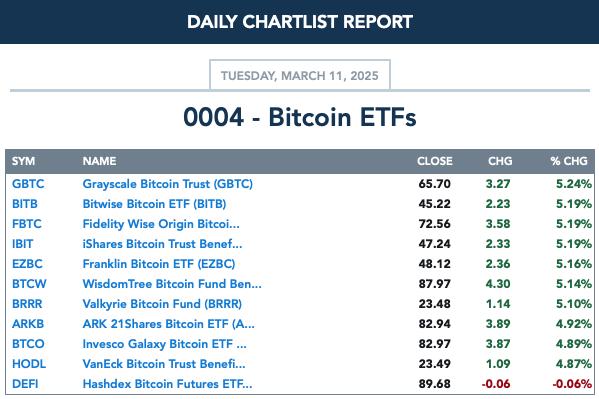
BITCOIN ETFs
INTEREST RATES
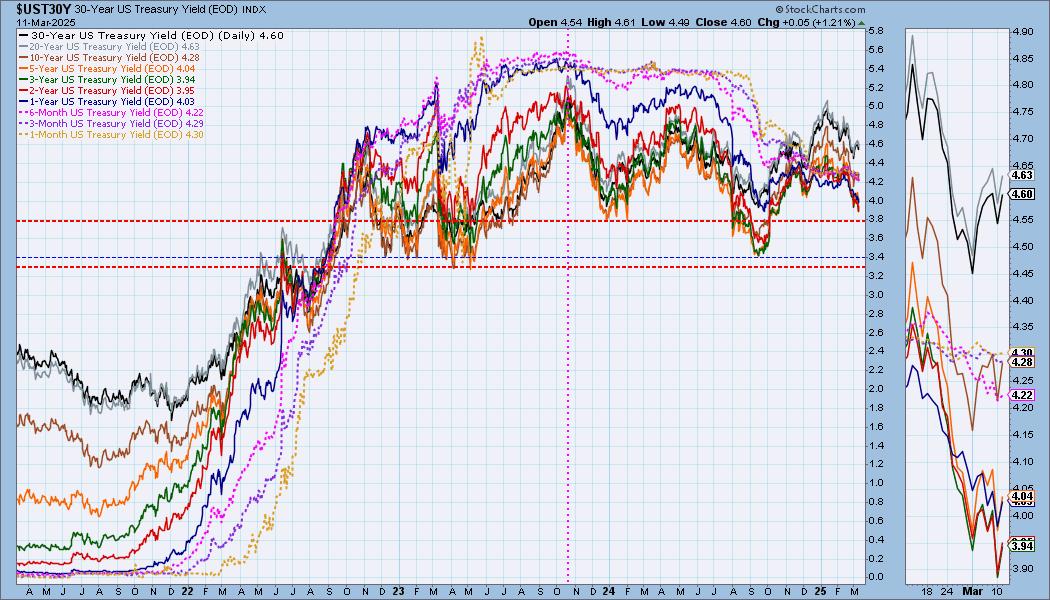
The declining trends still dominate the yield chart. We suspect they have further to fall.
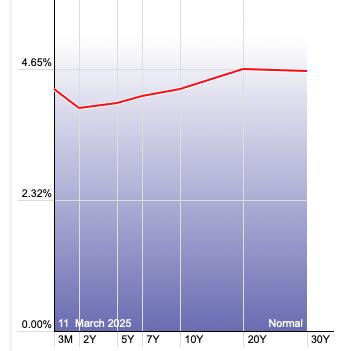
The Yield Curve Chart from StockCharts.com shows us the inversions taking place. The red line should move higher from left to right. Inversions are occurring where it moves downward.
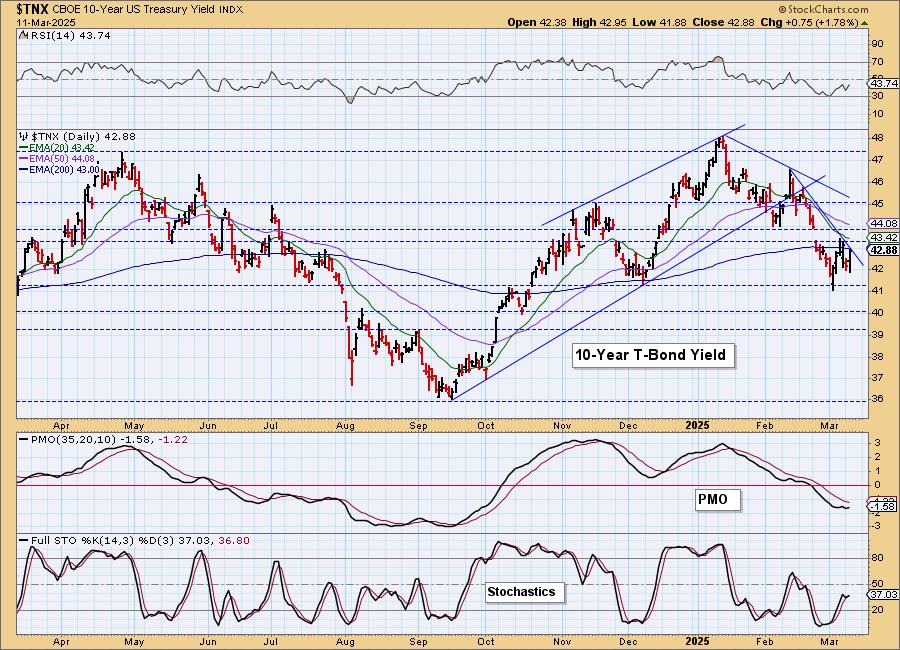
10-YEAR T-BOND YIELD
The PMO turned up today, but we still have a short-term declining tops trendline to contend with. 4.1% looks like an area of strong support and Stochastics did turn back up. We will watch for an upside breakout from the declining trend, but we're not that optimistic.
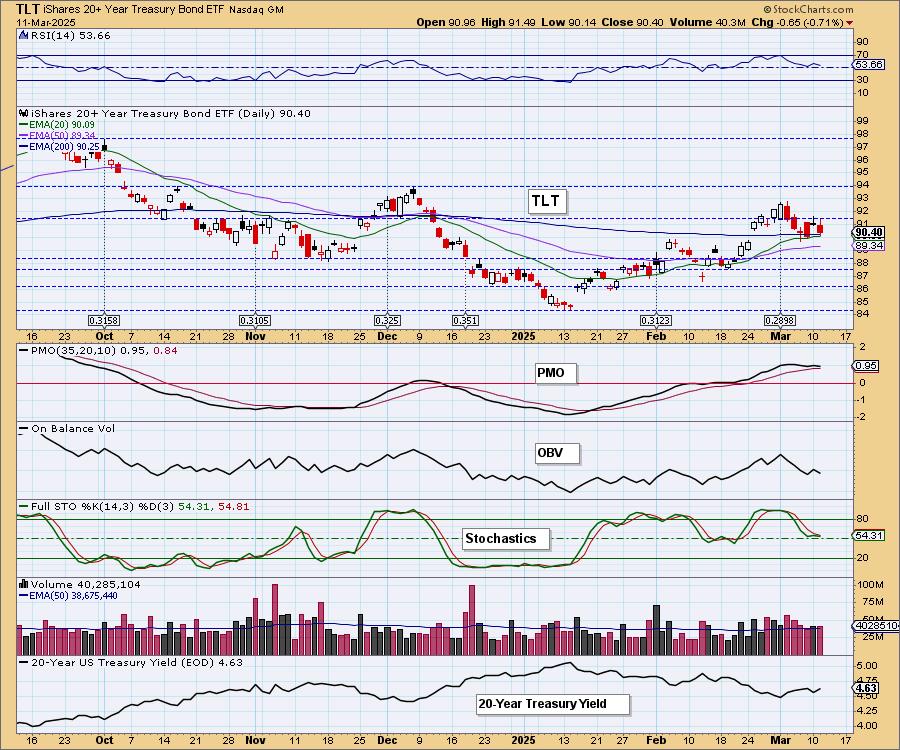
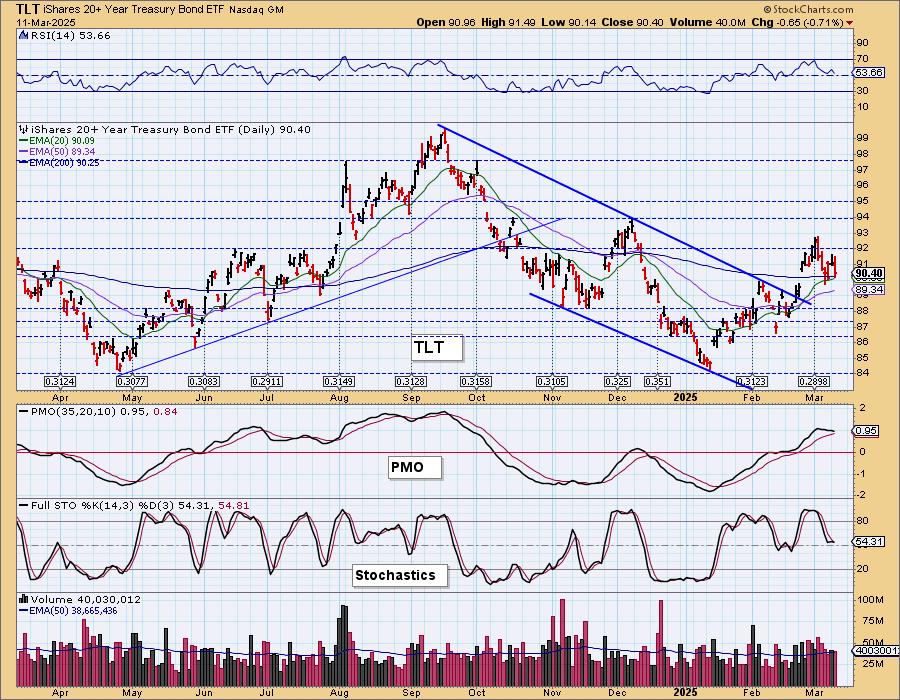
BONDS (TLT)
IT Trend Model: BUY as of 2/25/2025
LT Trend Model: SELL as of 12/13/2024
TLT Daily Chart: The 20-year yield was higher on the day and that took TLT down a notch. It is holding above the 20-day EMA and yields haven't broken declining trends yet so we think there is probably a bit more upside ahead for Bonds. The indicators aren't particularly bullish, but they aren't really bearish either. This indicates to us that upside potential is likely limited.
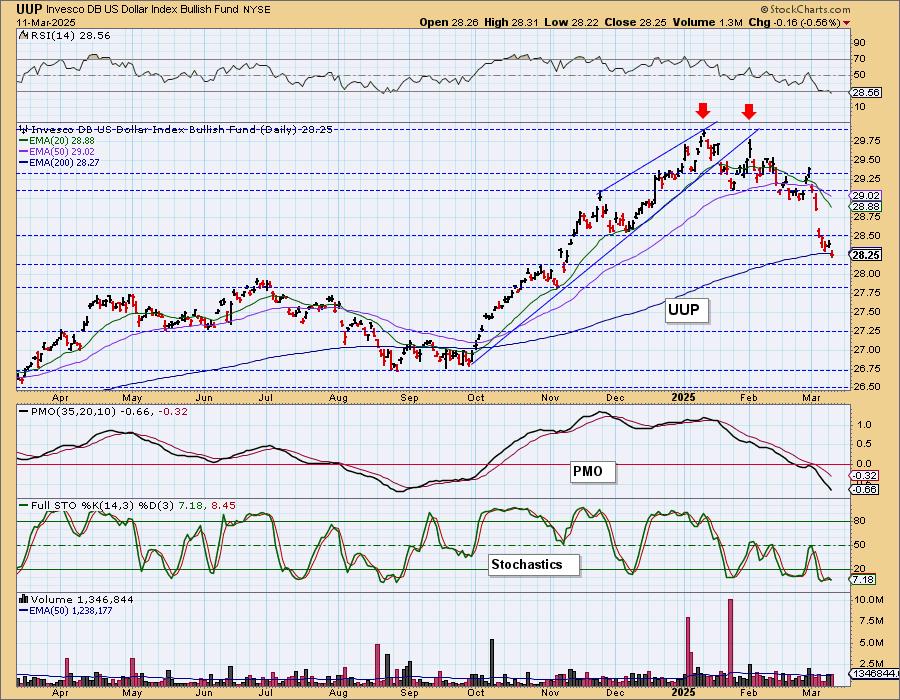
DOLLAR (UUP)
IT Trend Model: NEUTRAL as of 3/5/2025
LT Trend Model: BUY as of 5/25/2023
UUP Daily Chart: We thought the Dollar might be ready to reverse yesterday, but the decline brought price below the 200-day EMA. The RSI is oversold so we should still look for some sort of upside out of it. The PMO is still in decline and Stochastics topped below 20 so there is plenty of weakness still visible here. It was probably too soon to get bullish on the Dollar.
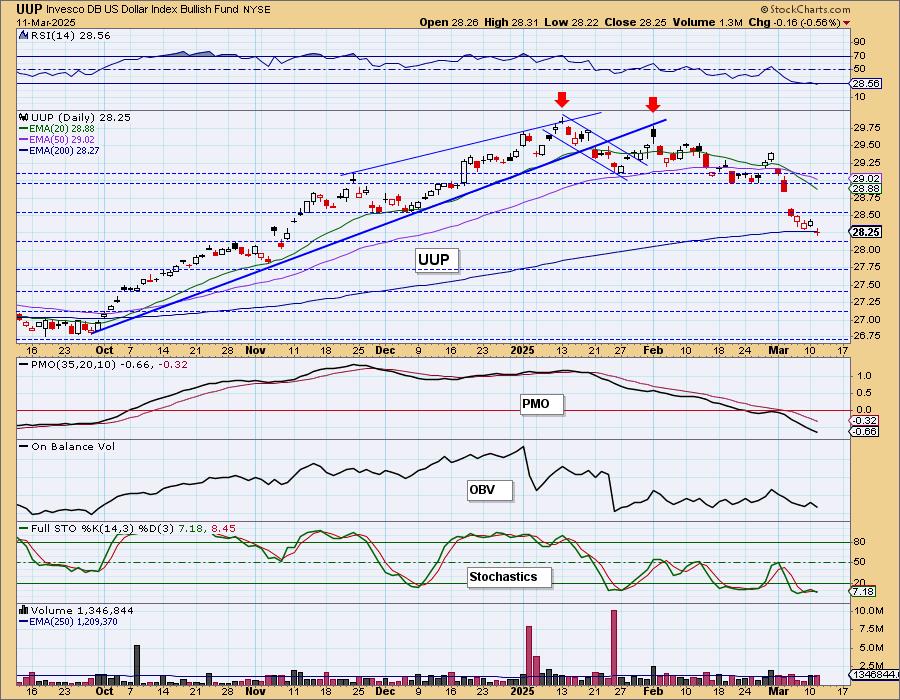
Strong support is nearing so we still need to be on the lookout for a possible upside reversal.
GOLD
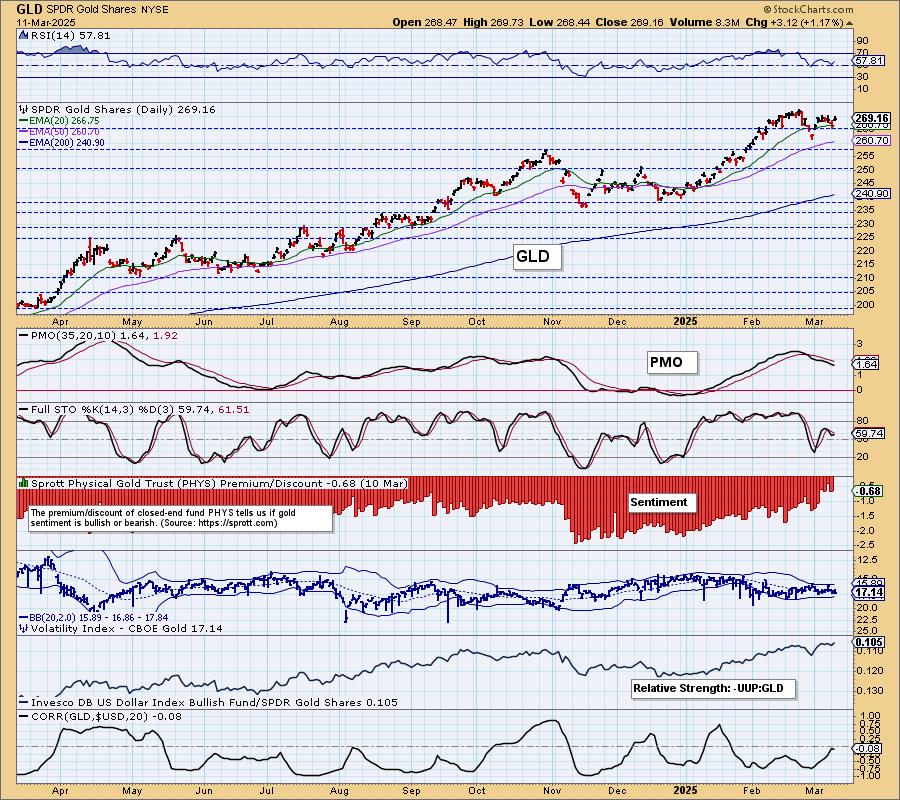
IT Trend Model: BUY as of 1/10/2025
LT Trend Model: BUY as of 10/20/2023
GLD Daily Chart: Gold managed a good rally today on the Dollar's weakness, but it was up far more than the Dollar was down so buyers definitely came in. We now have a less accelerating rising bottoms trendline that does look like it will hold. We're still concerned about the double top that has been developing, but new weakness in the Dollar could work in Gold's favor. A breakout to new all-time highs would bust the bearish pattern.
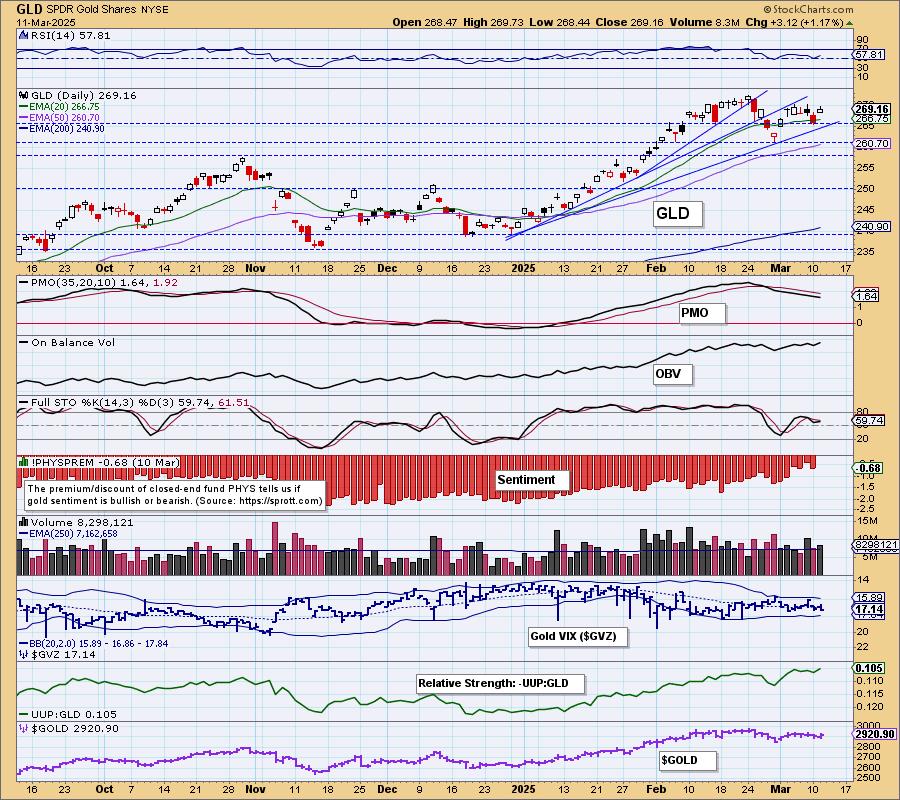
Stochastics did turn up today, but the PMO is still flashing weakness so Gold is not out of the woods yet. The correlation with the Dollar has disappeared so they have decoupled. This means that the normal reverse correlation isn't in effect anymore. They could travel together now.
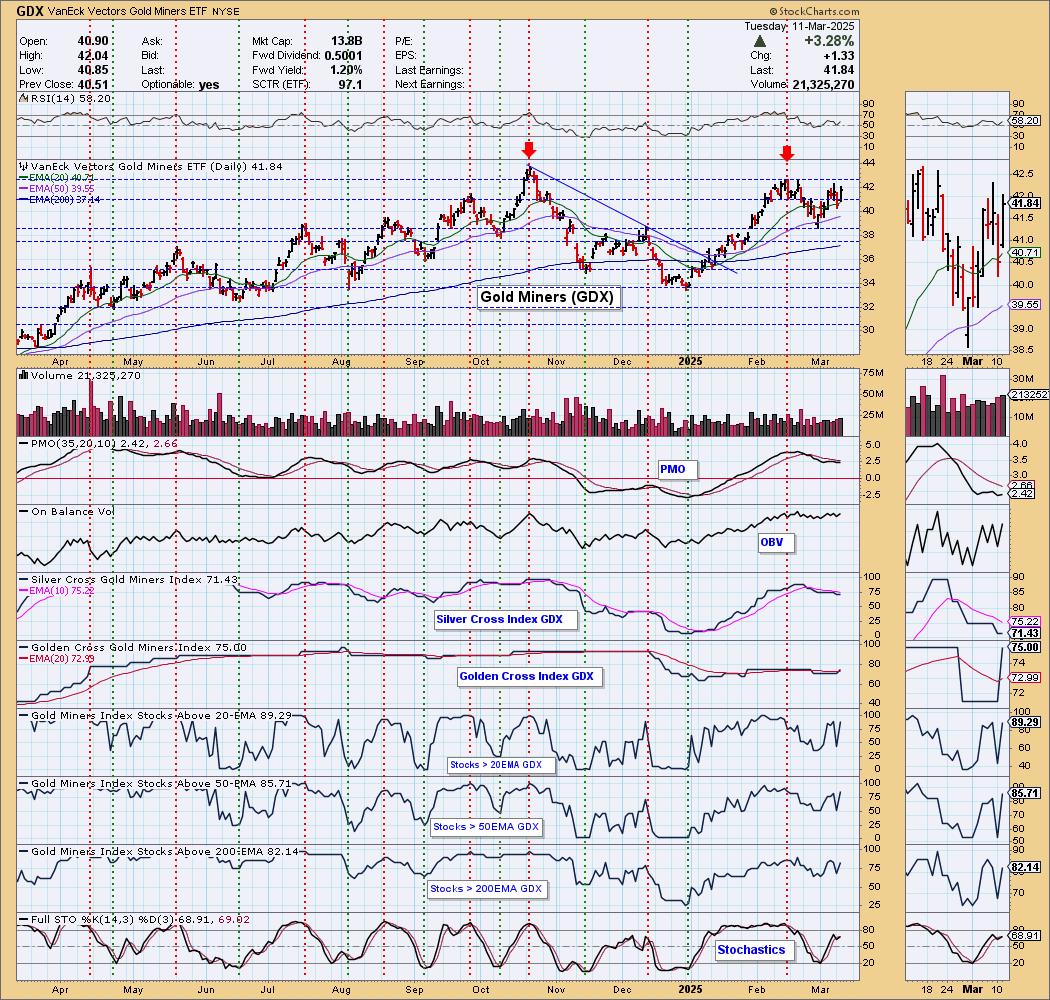
GOLD MINERS (GDX) Daily Chart: Gold's rally helped Gold Miners today as they rallied strongly. The rising trend is intact and participation is healing, but we are concerned about this next level of resistance being too much for it. Good news is the Bull Shift on the Golden Cross Index (positive crossover its signal line).
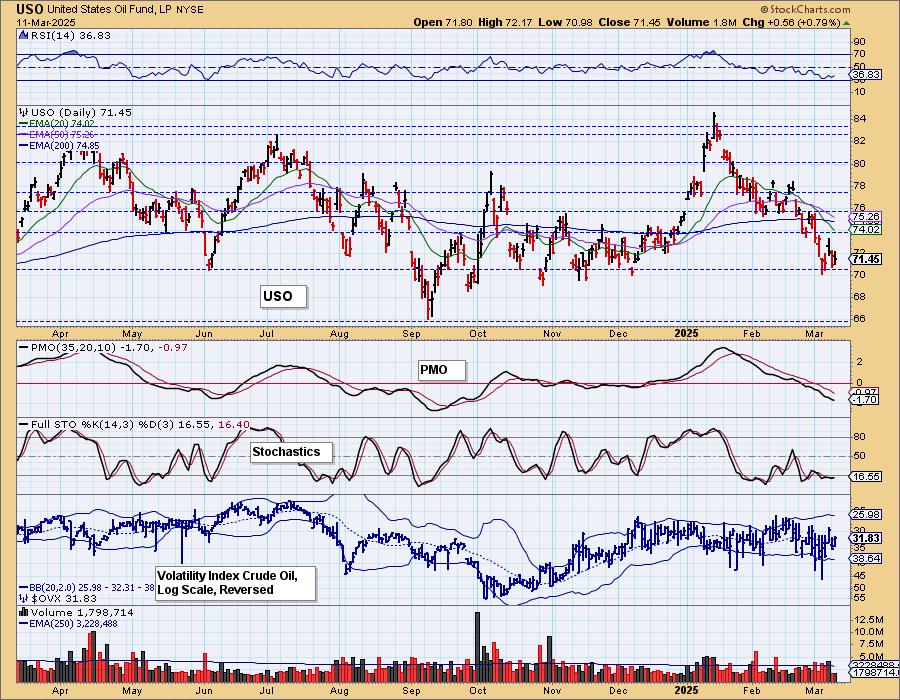
CRUDE OIL (USO)
IT Trend Model: BUY as of 12/24/2024
LT Trend Model: BUY as of 1/10/2025
USO Daily Chart: Crude Oil saw a bearish filled black candlestick today that implies we'll see a decline tomorrow. The PMO still looks very bearish and Stochastics are holding below 20 indicating extreme internal weakness. We could see an upside reversal given the very short-term rising trend, but ultimately we expect support to at least be tested at 68.
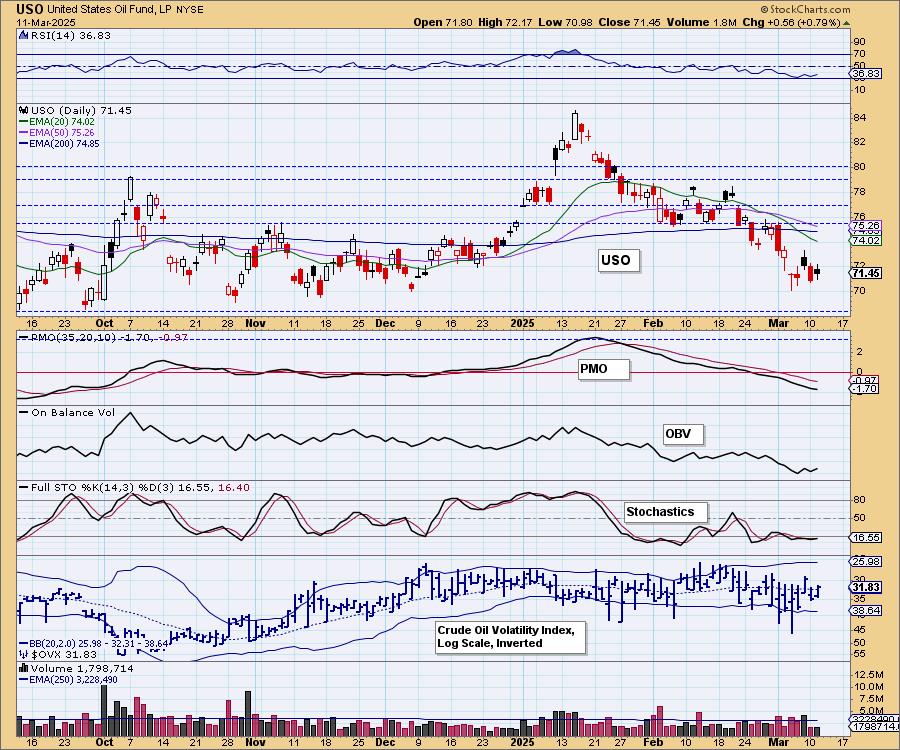
The strongest level of support lies at 66 or the September low. There are multiple short-term support levels based on the multiple bottoms to finish 2024. Any of those areas could support a small rally, but the outlook is still very bearish for Crude right now.
Good Luck & Good Trading!
Erin Swenlin and Carl Swenlin
Technical Analysis is a windsock, not a crystal ball. --Carl Swenlin
(c) Copyright 2025 DecisionPoint.com
Disclaimer: This blog is for educational purposes only and should not be construed as financial advice. The ideas and strategies should never be used without first assessing your own personal and financial situation, or without consulting a financial professional. Any opinions expressed herein are solely those of the author, and do not in any way represent the views or opinions of any other person or entity.
DecisionPoint is not a registered investment advisor. Investment and trading decisions are solely your responsibility. DecisionPoint newsletters, blogs or website materials should NOT be interpreted as a recommendation or solicitation to buy or sell any security or to take any specific action.
NOTE: The signal status reported herein is based upon mechanical trading model signals, specifically, the DecisionPoint Trend Model. They define the implied bias of the price index based upon moving average relationships, but they do not necessarily call for a specific action. They are information flags that should prompt chart review. Further, they do not call for continuous buying or selling during the life of the signal. For example, a BUY signal will probably (but not necessarily) return the best results if action is taken soon after the signal is generated. Additional opportunities for buying may be found as price zigzags higher, but the trader must look for optimum entry points. Conversely, exit points to preserve gains (or minimize losses) may be evident before the model mechanically closes the signal.
Helpful DecisionPoint Links:
DecisionPoint Alert Chart List
DecisionPoint Golden Cross/Silver Cross Index Chart List
DecisionPoint Sector Chart List
Price Momentum Oscillator (PMO)