
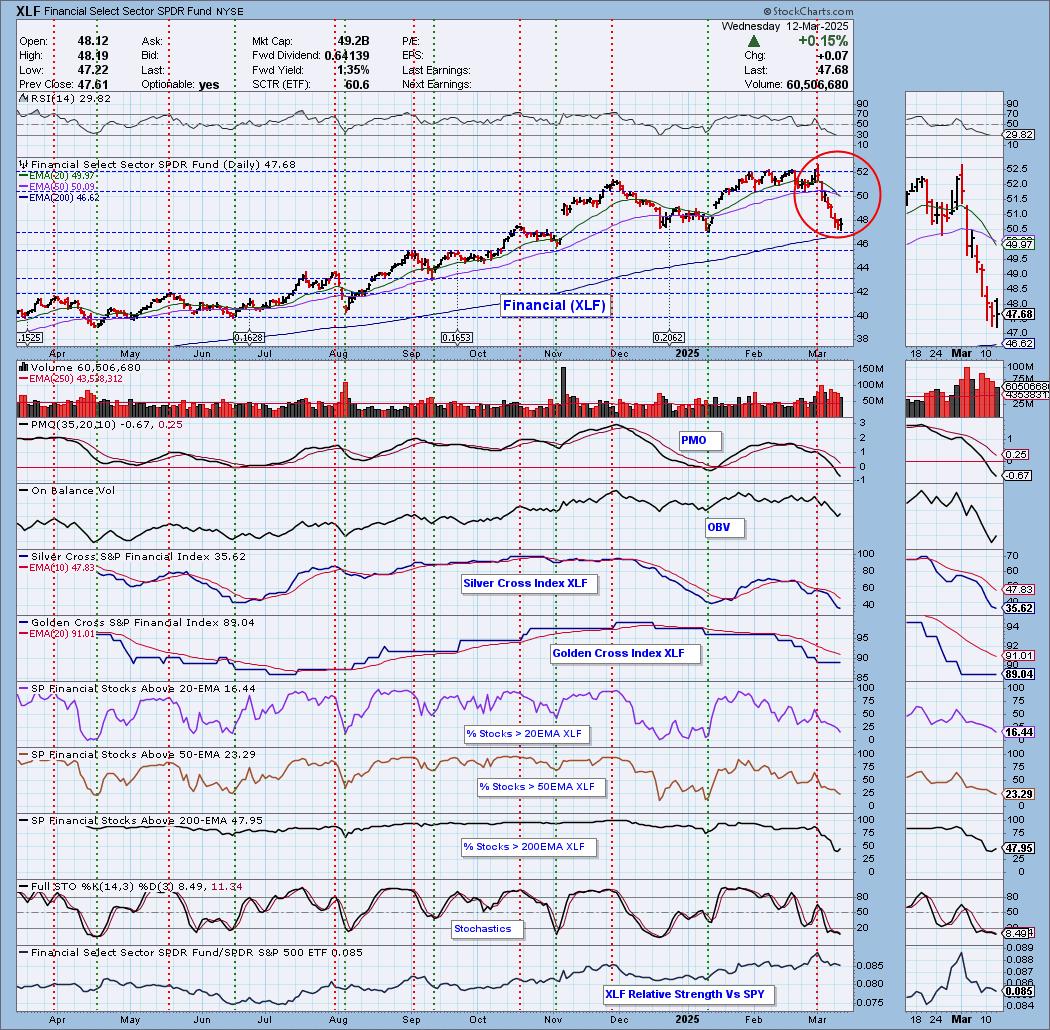
Today the Financial Sector (XLF) 20-day EMA crossed down through the 50-day EMA (Dark Cross), above the 200-day EMA, generating an IT Trend Model NEUTRAL Signal. Price has now reached very strong support at the January low and October high. This is where we should look for some kind of snapback. However, given very poor participation that isn't quite oversold, we wouldn't look for a big rally.
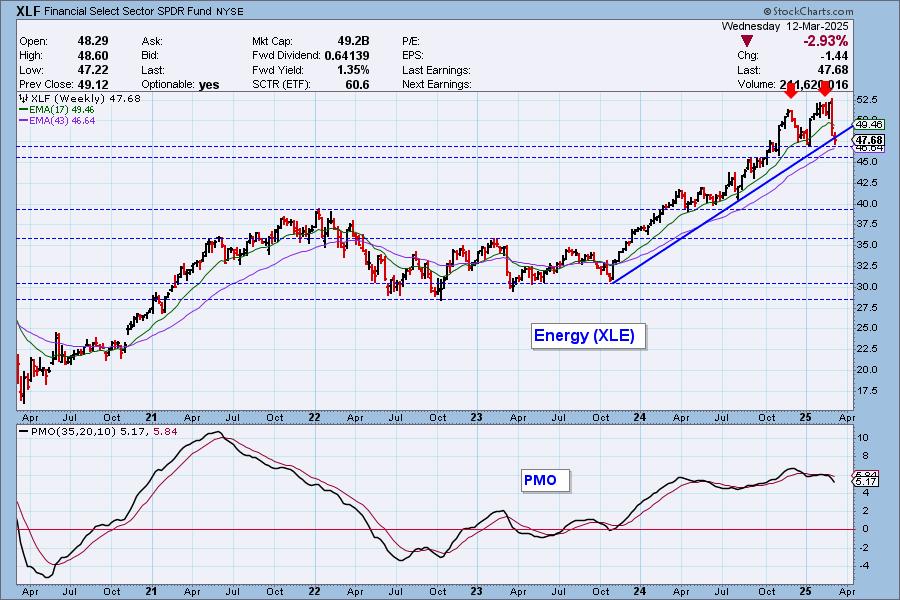
The XLF weekly chart show a double top and the rising trend line being challenged. The weekly PMO is accelerating lower.
The DecisionPoint Alert Weekly Wrap presents an end-of-week assessment of the trend and condition of the Stock Market, the U.S. Dollar, Gold, Crude Oil, and Bonds. The DecisionPoint Alert daily report (Monday through Thursday) is abbreviated and gives updates on the Weekly Wrap assessments.
Watch the latest episode of DecisionPoint on our YouTube channel here!
MARKET/INDUSTRY GROUP/SECTOR INDEXES
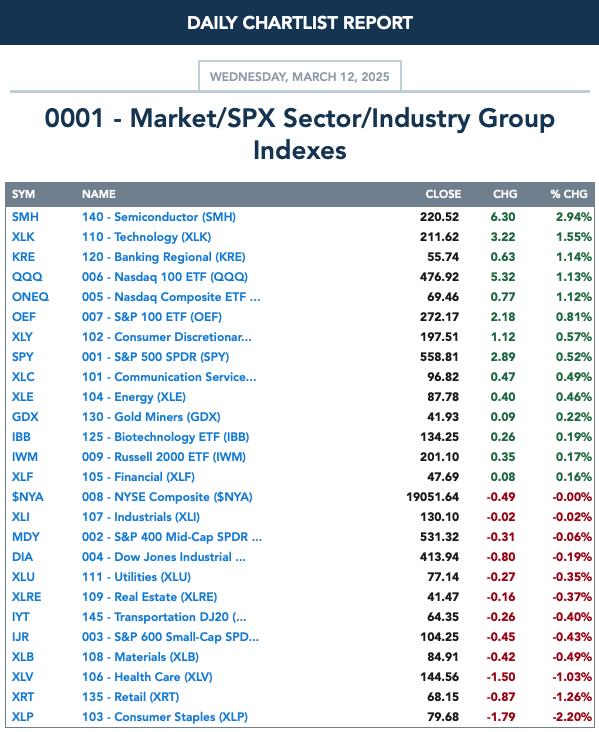
CLICK HERE for Carl's annotated Market Index, Sector, and Industry Group charts.
THE MARKET (S&P 500)
IT Trend Model: NEUTRAL as of 3/4/2025
LT Trend Model: BUY as of 3/29/2023
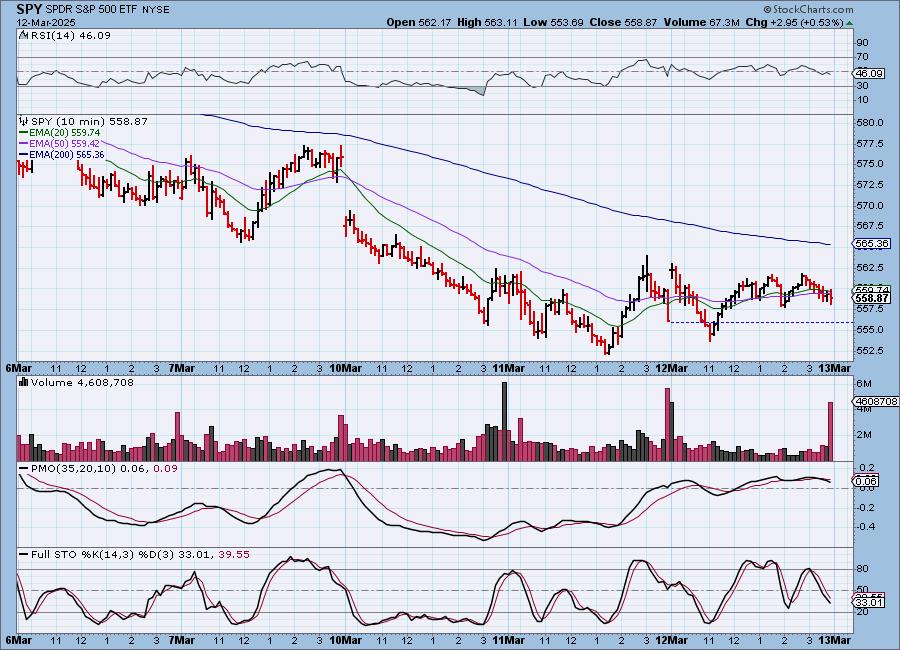
SPY 10-Minute Chart: A somewhat favorable CPI report helped keep price in positive territory today. The rally was far from impressive, price basically moved mostly sideways during trading today. The 10-minute PMO is declining on a Crossover SELL Signal so we could see a continuation of the end of day decline.
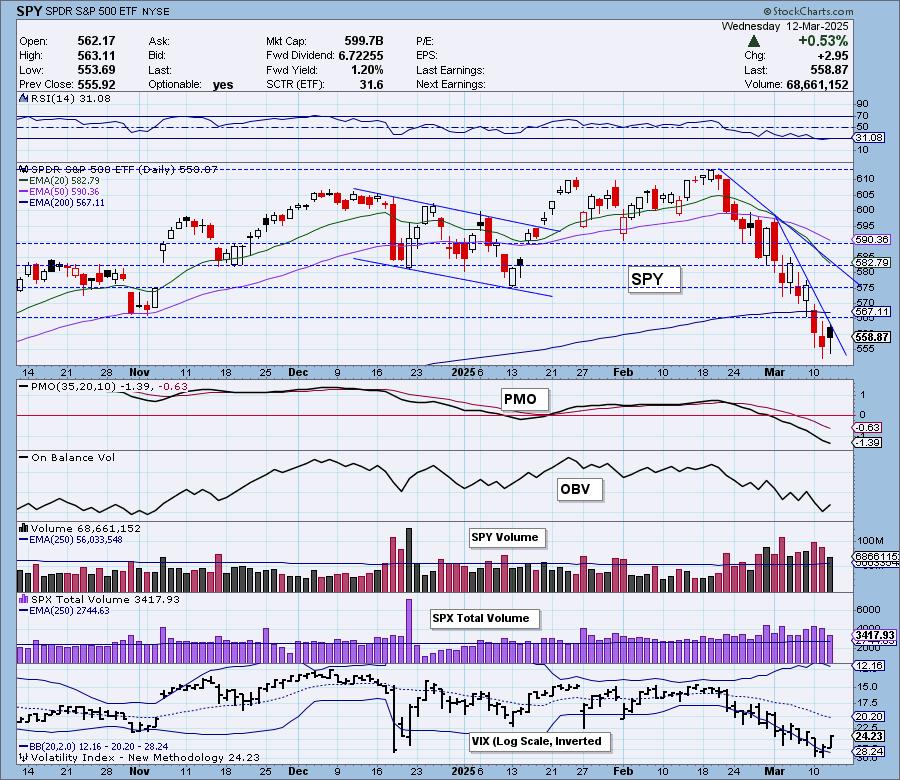
SPY Daily Chart: We have a more accelerating declining trend now. Price did attempt to rally above it, but instead formed a bearish filled black candlestick that implies we'll see a decline. The PMO still looks very bearish as it declines below the zero line.
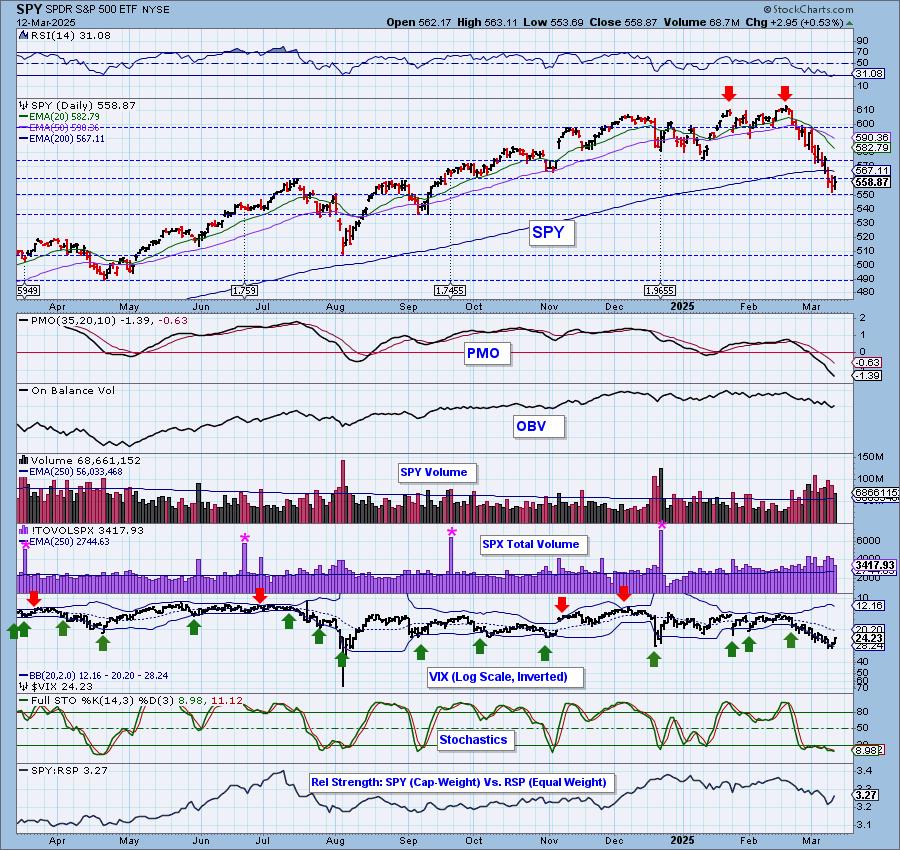
The VIX is attempting to break its declining trend on the inverted scale. Investors were pleased with the inflation reporting and so some of the fear was alleviated. Stochastics still look terrible as they remain below 20 signaling significant internal weakness. We do notice that the relative strength line to equal-weight RSP turned up. It hasn't broken its declining trend, but this does suggest we could get some followthrough on today's rally given more participation by mega-caps.
 DON'T DELAY! IT'S FREE!
Here is the latest recording from 3/10. Click HERE to get to our video list.:
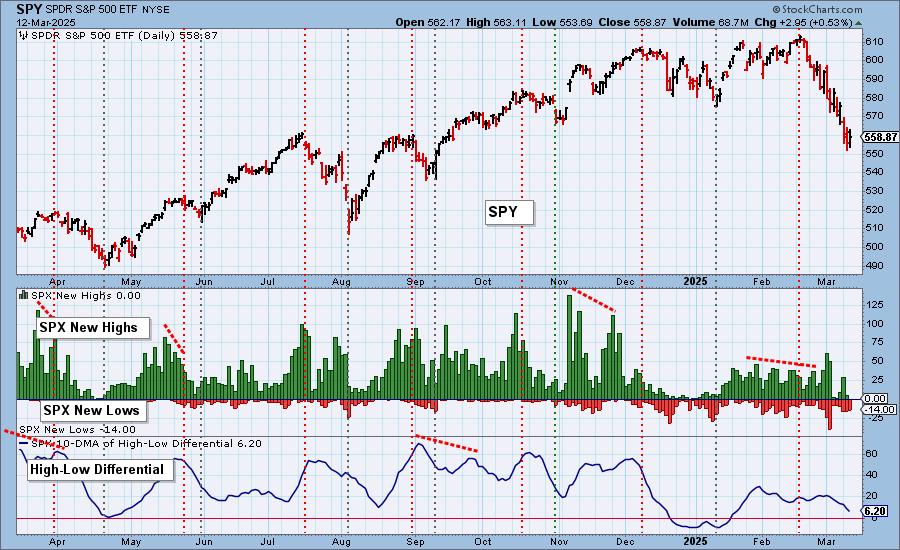
S&P 500 New 52-Week Highs/Lows: No New Highs were spotted on today's rally which is not good given we were seeing them even during the prior decline. New Lows were at about the same level. The High-Low Differential is declining toward the zero line. It is not oversold yet. We're expecting it to drop beneath the zero line.
Climax* Analysis: There were no climax readings today.
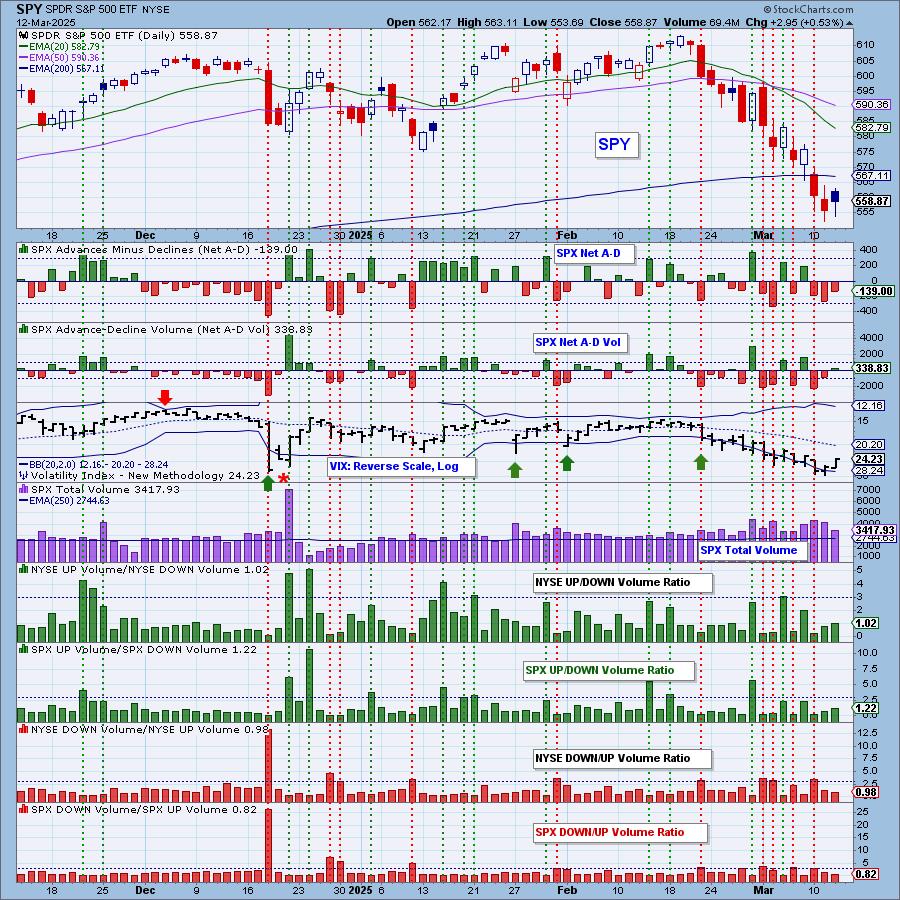
*A climax is a one-day event when market action generates very high readings in, primarily, breadth and volume indicators. We also include the VIX, watching for it to penetrate outside the Bollinger Band envelope. The vertical dotted lines mark climax days -- red for downside climaxes, and green for upside. Climaxes are at their core exhaustion events; however, at price pivots they may be initiating a change of trend.
Short-Term Market Indicators: The short-term market trend is DOWN and the condition is NEUTRAL.
The Swenlin Trading Oscillators (STOs) reversed and moved lower today even on a rally. This doesn't bode well. Participation was really sucked out of the market today. %Stocks > 20EMA is beginning to get oversold. %PMOs Rising are also getting oversold.
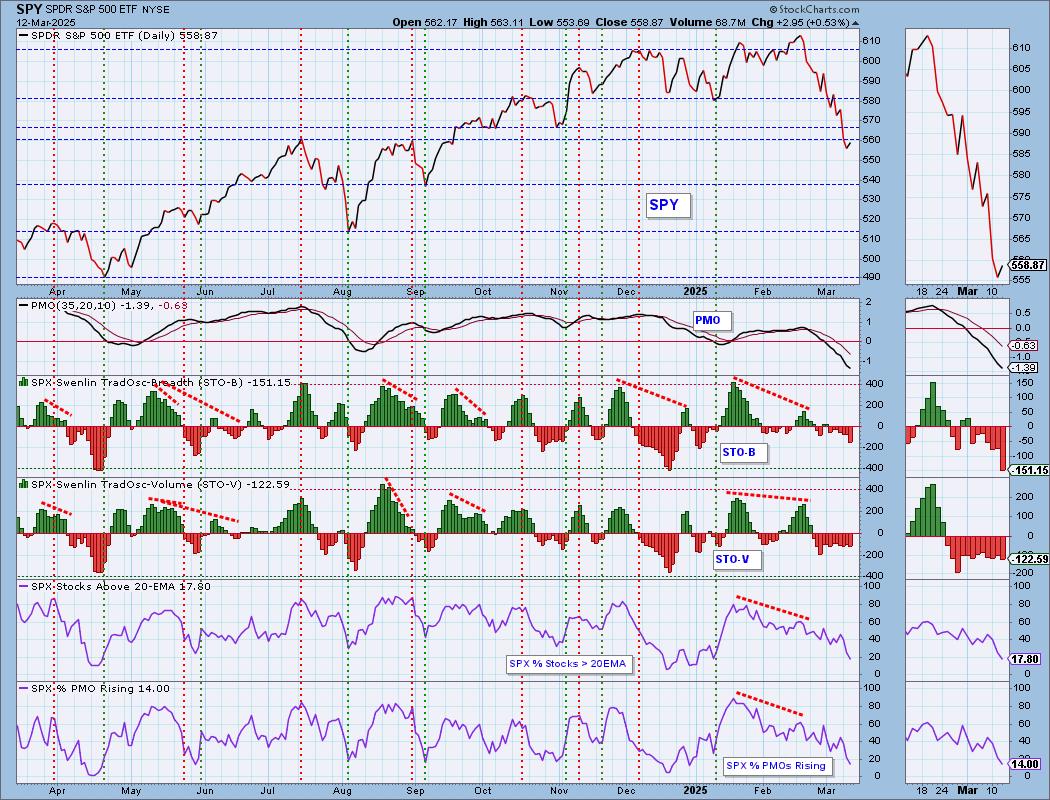
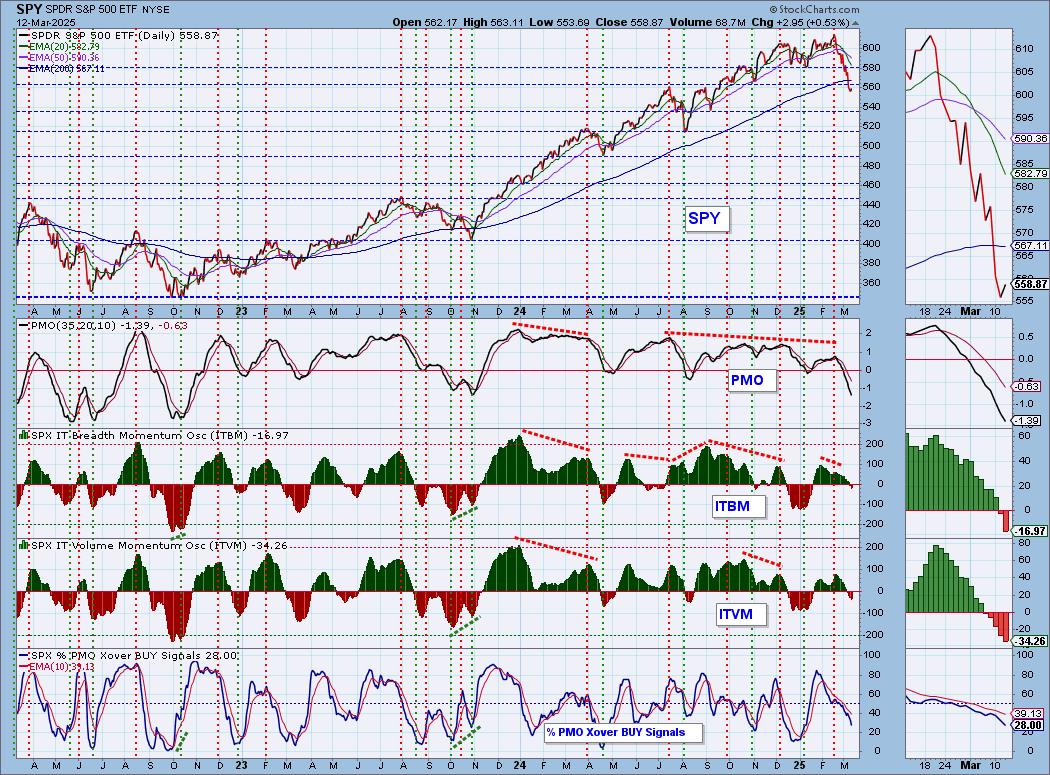
Intermediate-Term Market Indicators: The intermediate-term market trend is DOWN and the condition is NEUTRAL.
The ITBM and ITVM are still in decline confirming now falling STOs. We've lost a number of PMO BUY Signals within the index. %PMO Xover BUY Signals is not yet oversold.
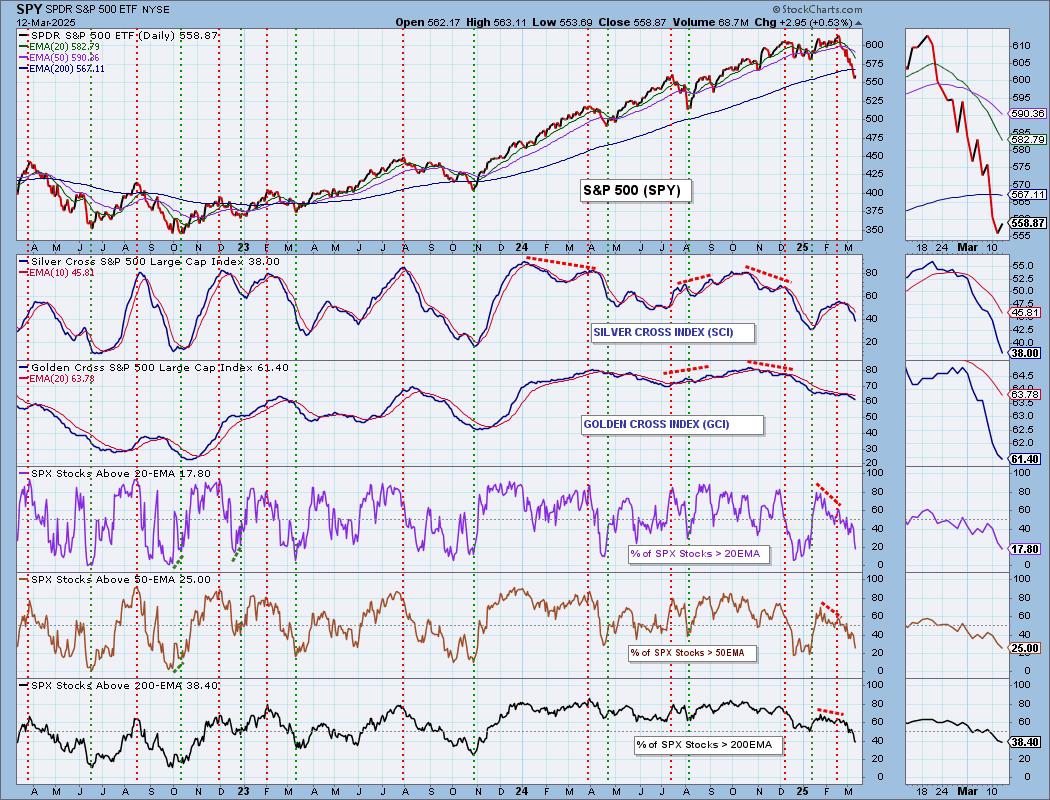
PARTICIPATION CHART (S&P 500): The following chart objectively shows the depth and trend of participation for the SPX in two time frames.
- Intermediate-Term - the Silver Cross Index (SCI) shows the percentage of SPX stocks on IT Trend Model BUY signals (20-EMA > 50-EMA). The opposite of the Silver Cross is a "Dark Cross" -- those stocks are, at the very least, in a correction.
- Long-Term - the Golden Cross Index (GCI) shows the percentage of SPX stocks on LT Trend Model BUY signals (50-EMA > 200-EMA). The opposite of a Golden Cross is the "Death Cross" -- those stocks are in a bear market.
The market bias is BEARISH in the intermediate and long terms.
Readings on participation are getting closer to oversold territory. They're not there yet, but we're close and that could mean an upside reversal is setting up. It's still early so we're not out of the woods yet. The Silver Cross Index continues to tumble lower and the Golden Cross Index is headed lower. Given low participation readings, both of those Indexes are likely to continue moving lower. Both are below their signal lines so the IT and LT Bias is BEARISH.
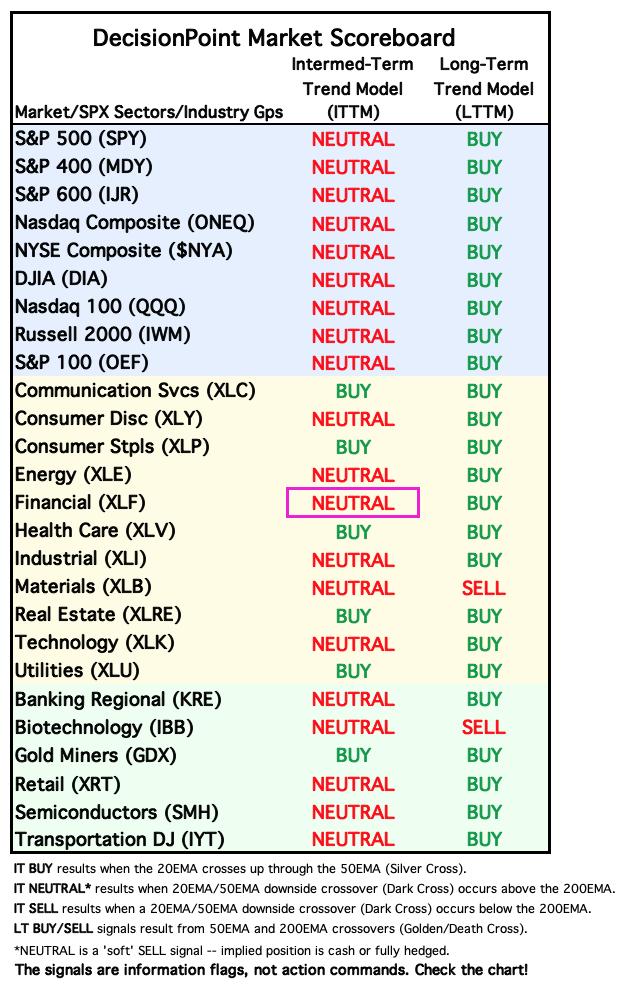
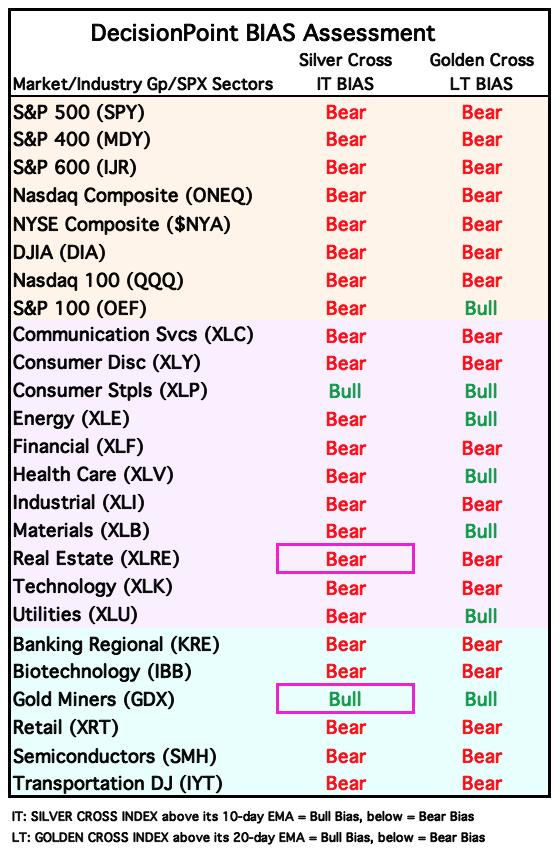
BIAS Assessment: The following table expresses the current BIAS of various price indexes based upon the relationship of the Silver Cross Index to its 10-day EMA (intermediate-term), and of the Golden Cross Index to its 20-day EMA (long-term). When the Index is above the EMA it is bullish, and it is bearish when the Index is below the EMA. The BIAS does not imply that any particular action should be taken. It is information to be used in the decision process.
The items with highlighted borders indicate that the BIAS changed today.
*****************************************************************************************************
CONCLUSION: The decline has been overdone and today's rally seemed to suggest that. We unfortunately can't get that bullish despite sitting on support given our primary indicators in every timeframe are moving lower. We are starting to see participation of stocks above their 20-day EMAs move into oversold territory. Participation in general is starting to get oversold and that would provide an opportunity for an upside reversal. At this point, we think there is a little more upside to be had, but in the greater context, we don't think it will be enough to get price near all-time highs again. Until more clarity comes on trade and the economy, the market is likely to continue to decline in the intermediate term. For now, let's look for more snapback.
Erin is 10% long, 0% short. (This is intended as information, not a recommendation.)
*****************************************************************************************************
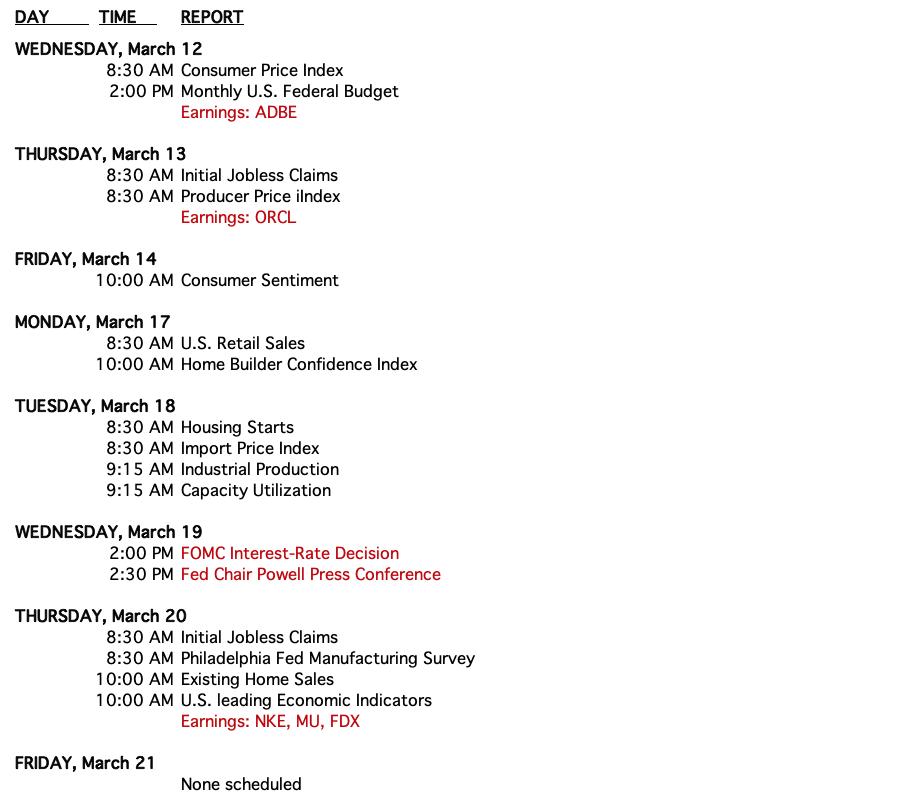
CALENDAR
Have you subscribed the DecisionPoint Diamonds yet? DP does the work for you by providing handpicked stocks/ETFs from exclusive DP scans! Add it with a discount! Contact support@decisionpoint.com for more information!
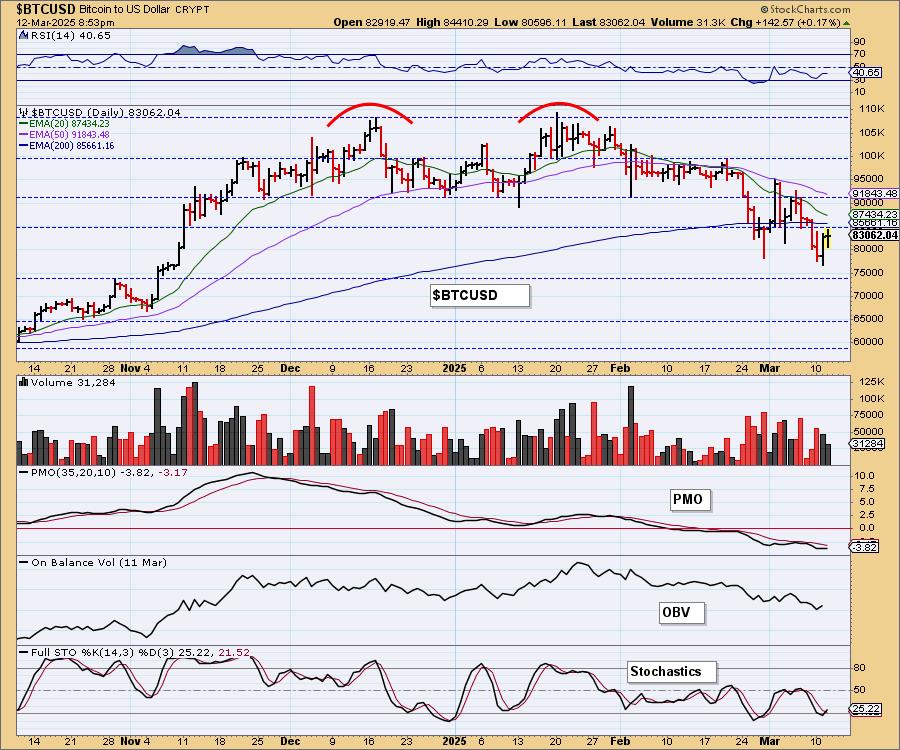
BITCOIN
Bitcoin is still in a declining trend and the bearish double top looms, suggesting we could see more downside on Bitcoin. It is overdue for a good rally, but we aren't looking for a break in the current declining trend. Price is below the 200-day EMA. The RSI is still negative. The PMO has flattened, but it isn't configured strongly. It is flat below the zero line and that implies pure weakness. We could see a little more upside, but overall this topping formation doesn't look ready to dissipate.
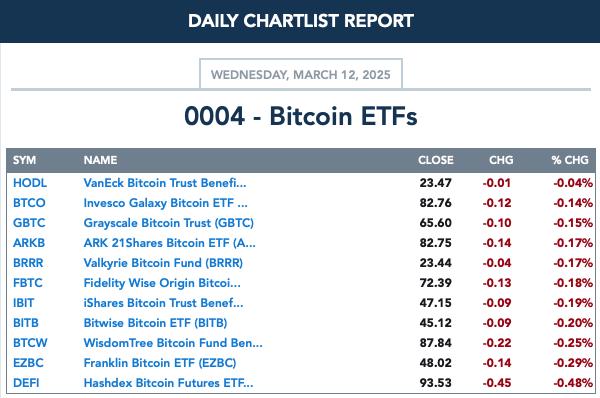
BITCOIN ETFs
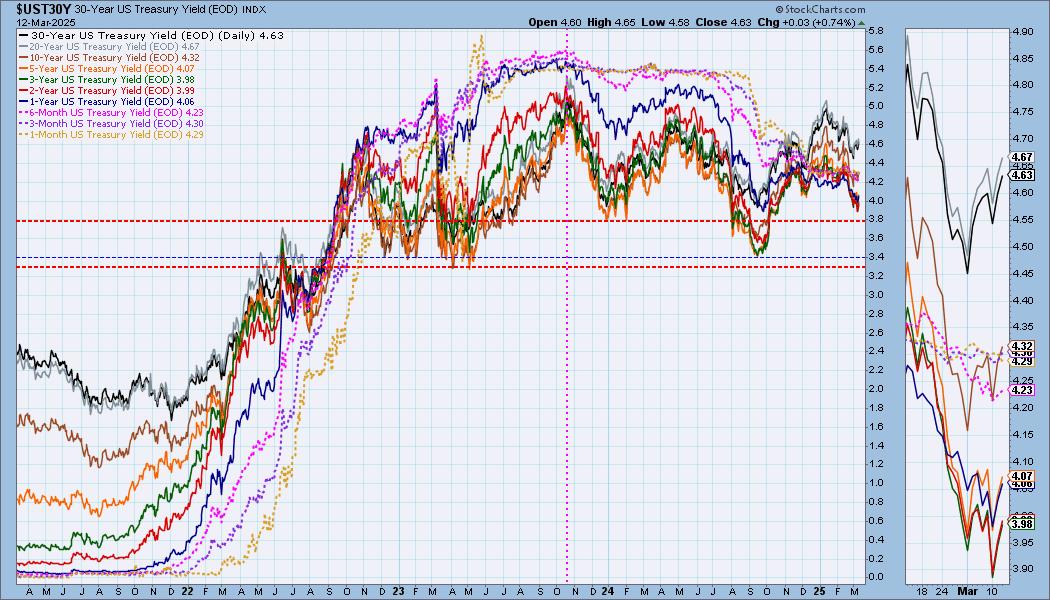
INTEREST RATES
We're noticing some new rising trends in the zoom thumbnail for long-term rates. This may finally be the bottom in rates.
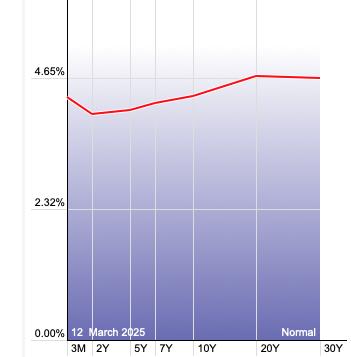
The Yield Curve Chart from StockCharts.com shows us the inversions taking place. The red line should move higher from left to right. Inversions are occurring where it moves downward.
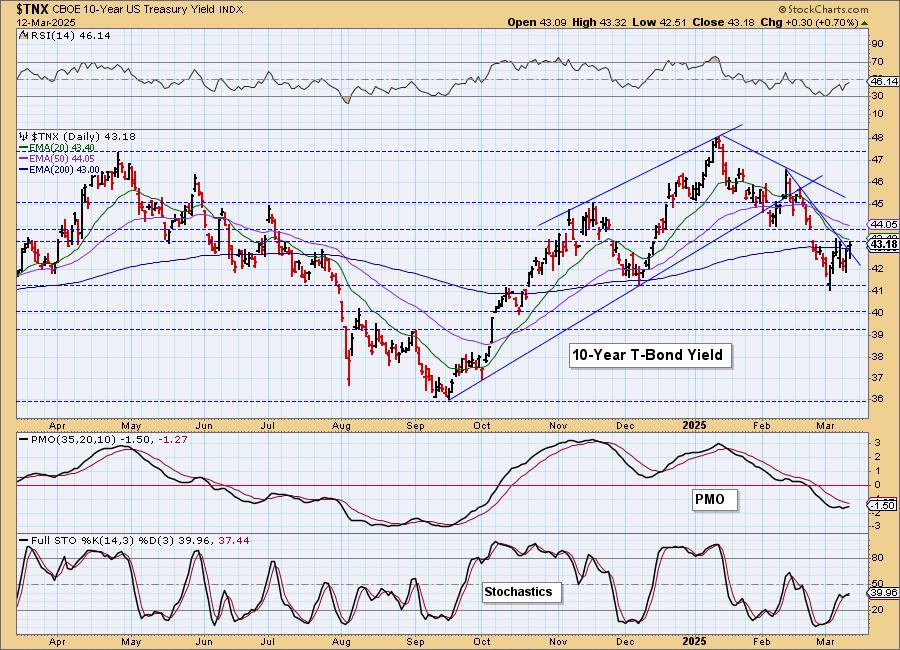
10-YEAR T-BOND YIELD
The short-term declining tops trendline was broken today as $TNX rallies off the December low. The indicators are getting a little more bullish so we are going to look for some more upside here. The RSI is still negative, but the PMO and Stochastics have turned up.
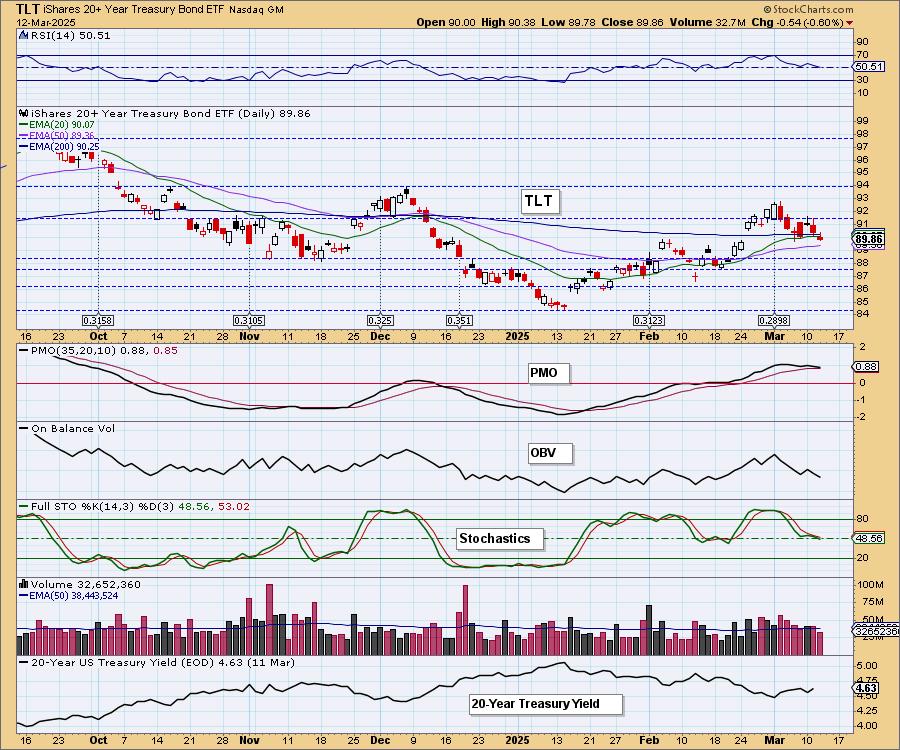
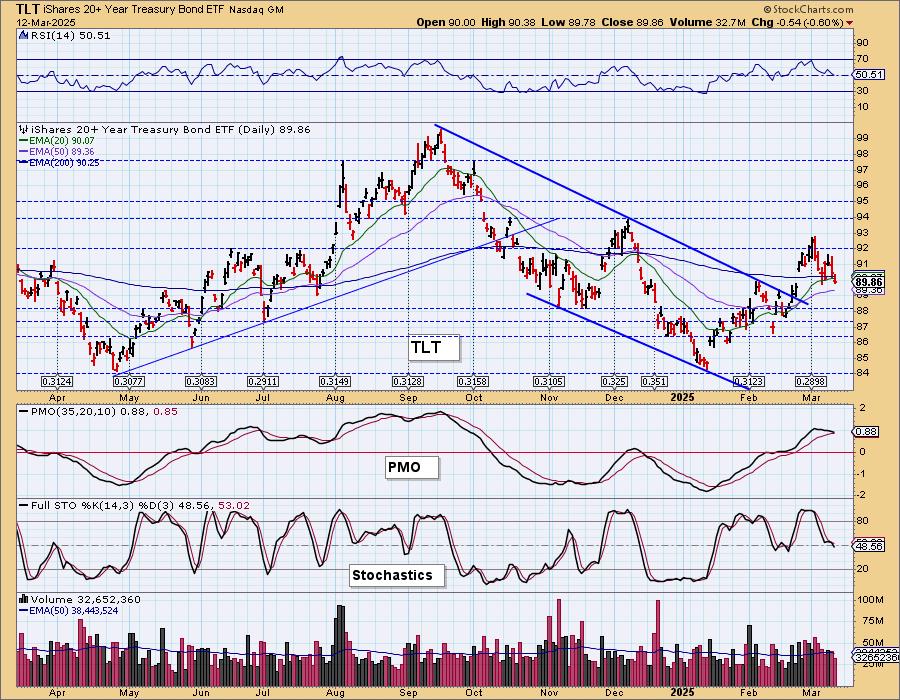
BONDS (TLT)
IT Trend Model: BUY as of 2/25/2025
LT Trend Model: SELL as of 12/13/2024
TLT Daily Chart: We see a new rising trend on the 20-year yield and that is going to put more downside pressure on TLT. The PMO is nearing a Crossover SELL Signal so we should expect lower prices ahead. Stochastics just entered negative territory below net neutral (50).
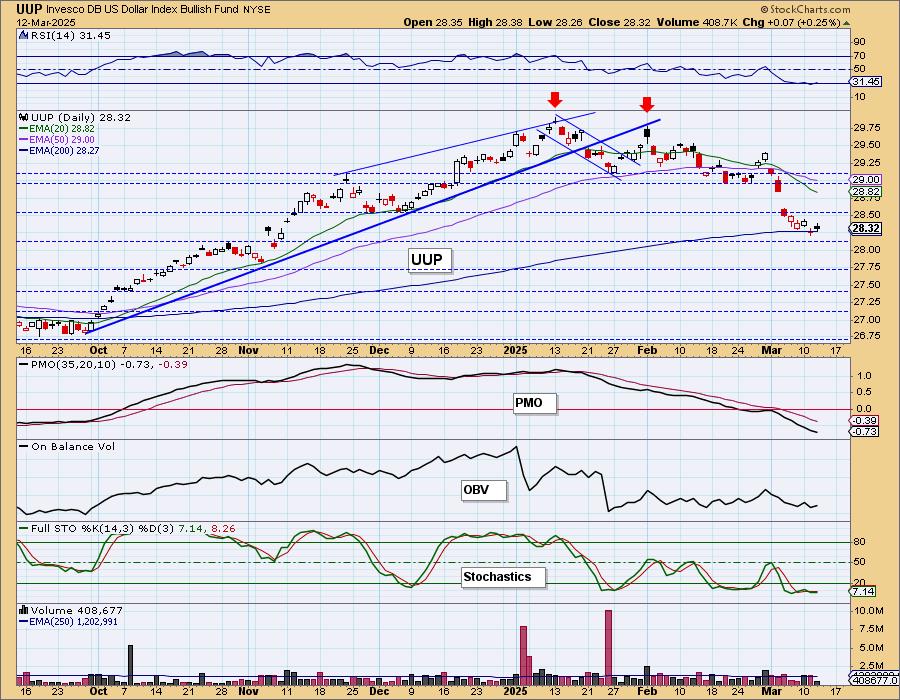
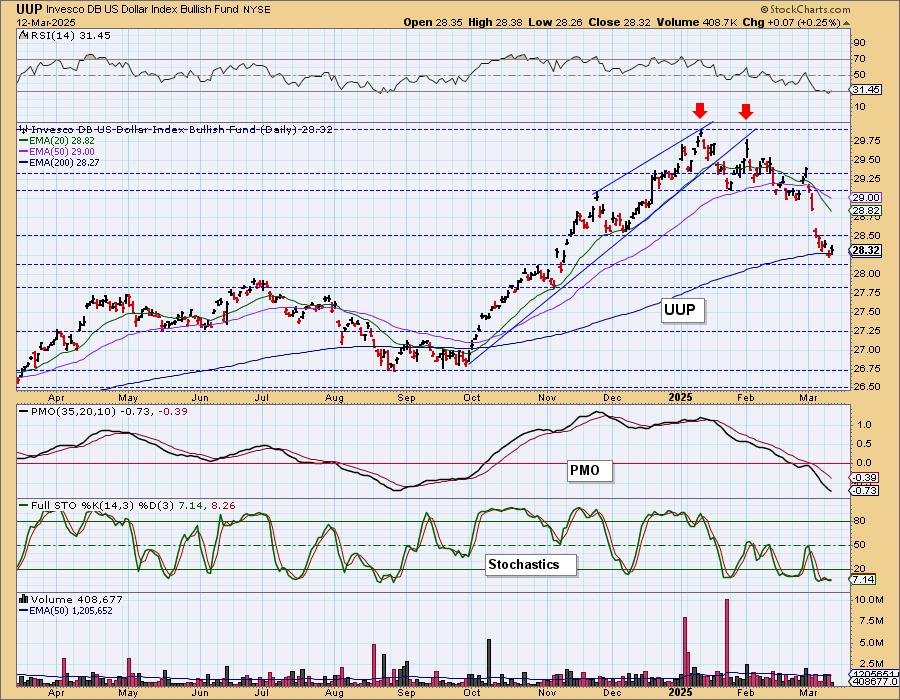
DOLLAR (UUP)
IT Trend Model: NEUTRAL as of 3/5/2025
LT Trend Model: BUY as of 5/25/2023
UUP Daily Chart: The Dollar wants to rally off this level, but indicators tell us to expect more weakness. Still, we will want to monitor this as it is a good place to start looking for a rally.
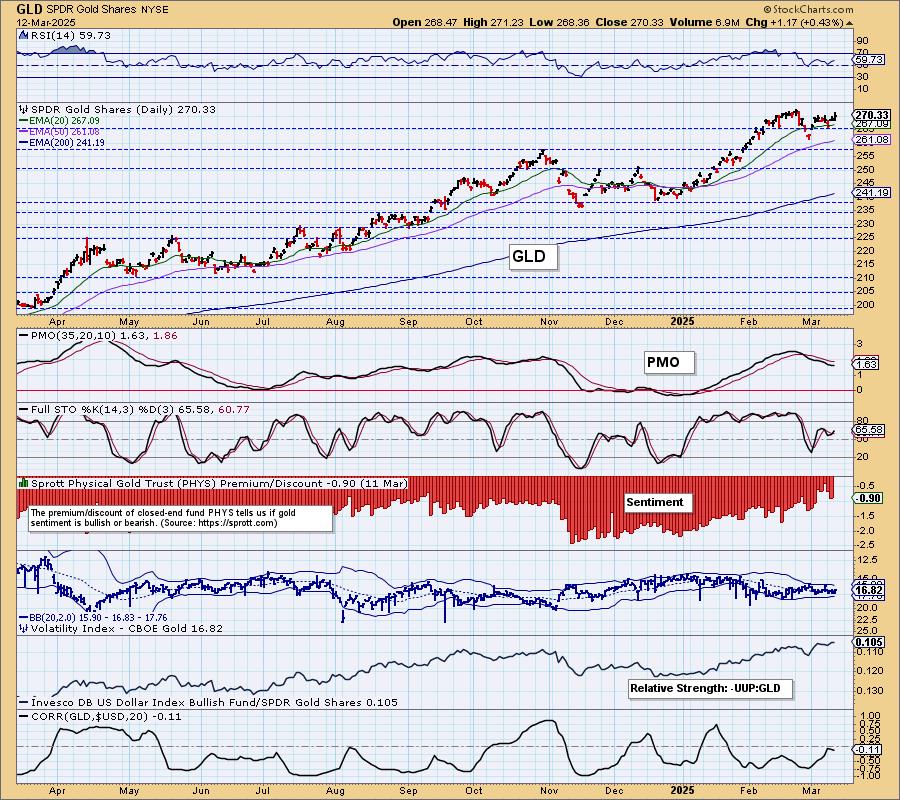
GOLD
IT Trend Model: BUY as of 1/10/2025
LT Trend Model: BUY as of 10/20/2023
GLD Daily Chart: Gold rallied even with a rising Dollar today. So far it is able to hold the less steep rising bottoms trendline. The PMO is trying to turn back up. Stochastics are rising and the RSI is positive so we would look for some more upside out of Gold. It does look a bit toppy, but today's rally is taking care of the declining trend out of the February top. The Dollar could be ready to rally, but it still shows signs of weakness for now. This should keep Gold elevated.
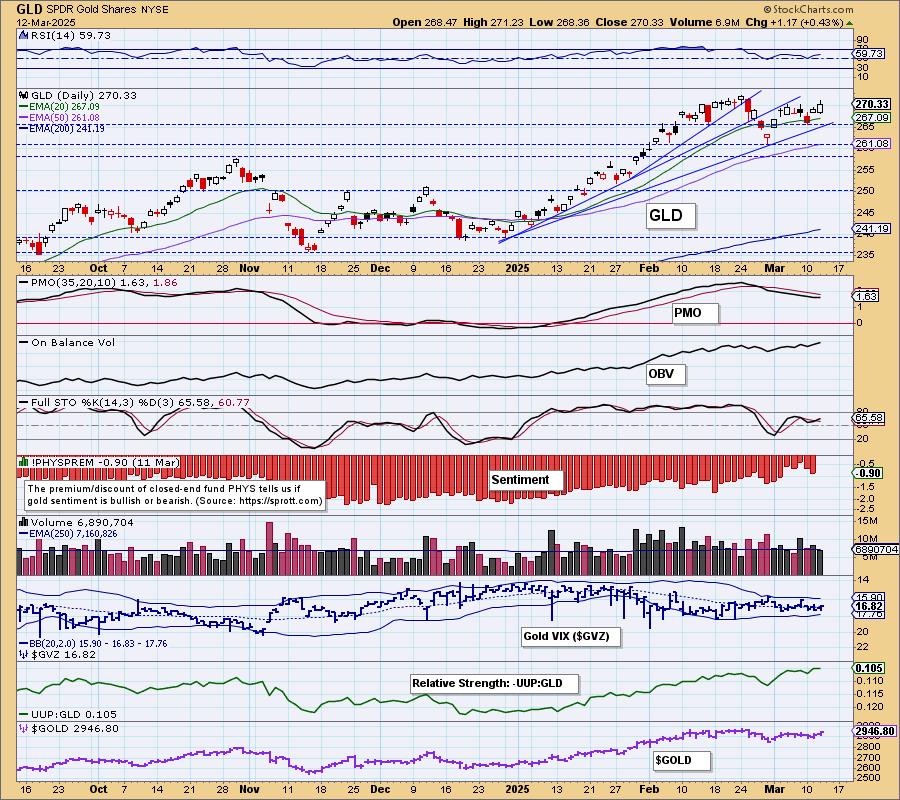
Discounts were higher yesterday, but still remain very low which is not a good condition for Gold. Low discounts mean bullish sentiment, but sentiment is contrarian so it's actually bearish for Gold. At this point, we think Gold will move higher in spite of this sentiment, but it does tell us that it may be slow going.
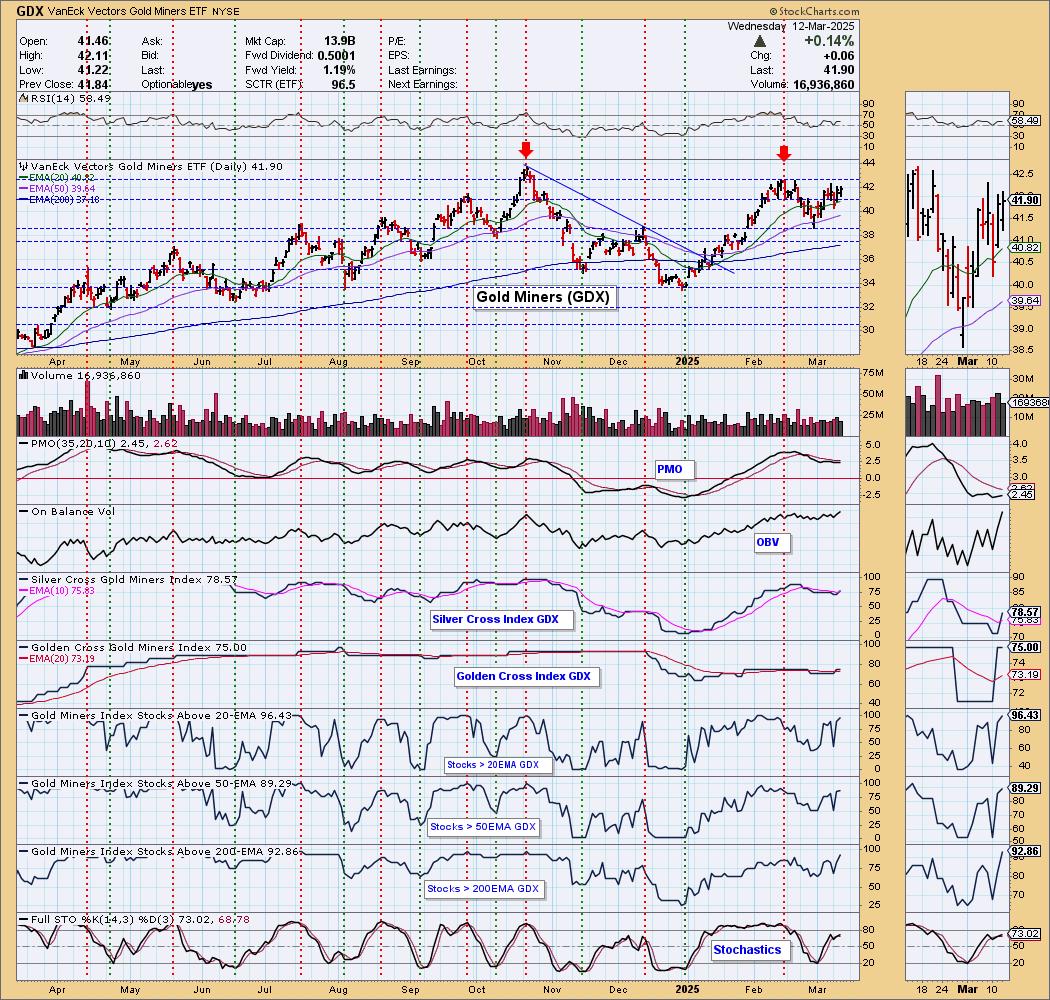
GOLD MINERS (GDX) Daily Chart: GDX is getting very close to overhead resistance. The PMO is a little unsure of itself, but we did see a Bullish Shift on the Silver Cross Index as it moved above its signal line. Participation still looks robust. Gold still has a bullish spin on it so GDX should be able to eke out more upside here. A breakout above this resistance level would essentially bust the bearish double top.
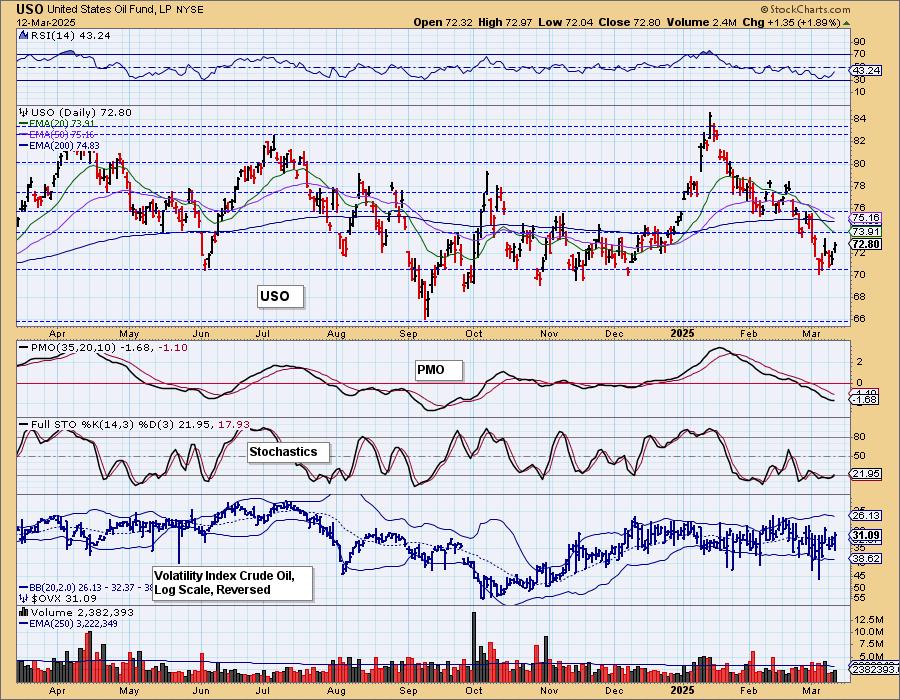
CRUDE OIL (USO)
IT Trend Model: BUY as of 12/24/2024
LT Trend Model: BUY as of 1/10/2025
USO Daily Chart: Crude Oil had a nice rally today but it wasn't enough to break out of the declining trend channel. It does look ready to rally a bit more, but ultimately we aren't expecting much out of it. The PMO is trying to rise though and Stochastics are rising very slightly. We still think that price will test 68 before too long.
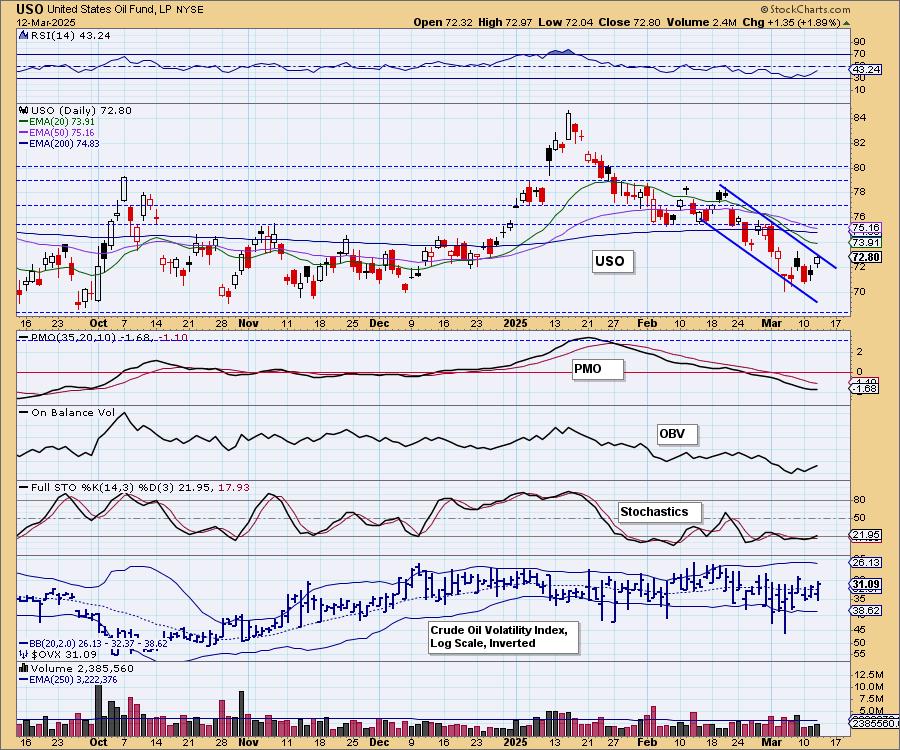
The strongest level of support lies at 66 or the September low. There are multiple short-term support levels based on the multiple bottoms to finish 2024. Any of those areas could support a small rally, but the outlook is still very bearish for Crude right now.
Good Luck & Good Trading!
Erin Swenlin and Carl Swenlin
Technical Analysis is a windsock, not a crystal ball. --Carl Swenlin
(c) Copyright 2025 DecisionPoint.com
Disclaimer: This blog is for educational purposes only and should not be construed as financial advice. The ideas and strategies should never be used without first assessing your own personal and financial situation, or without consulting a financial professional. Any opinions expressed herein are solely those of the author, and do not in any way represent the views or opinions of any other person or entity.
DecisionPoint is not a registered investment advisor. Investment and trading decisions are solely your responsibility. DecisionPoint newsletters, blogs or website materials should NOT be interpreted as a recommendation or solicitation to buy or sell any security or to take any specific action.
NOTE: The signal status reported herein is based upon mechanical trading model signals, specifically, the DecisionPoint Trend Model. They define the implied bias of the price index based upon moving average relationships, but they do not necessarily call for a specific action. They are information flags that should prompt chart review. Further, they do not call for continuous buying or selling during the life of the signal. For example, a BUY signal will probably (but not necessarily) return the best results if action is taken soon after the signal is generated. Additional opportunities for buying may be found as price zigzags higher, but the trader must look for optimum entry points. Conversely, exit points to preserve gains (or minimize losses) may be evident before the model mechanically closes the signal.
Helpful DecisionPoint Links:
DecisionPoint Alert Chart List
DecisionPoint Golden Cross/Silver Cross Index Chart List
DecisionPoint Sector Chart List
Price Momentum Oscillator (PMO)