
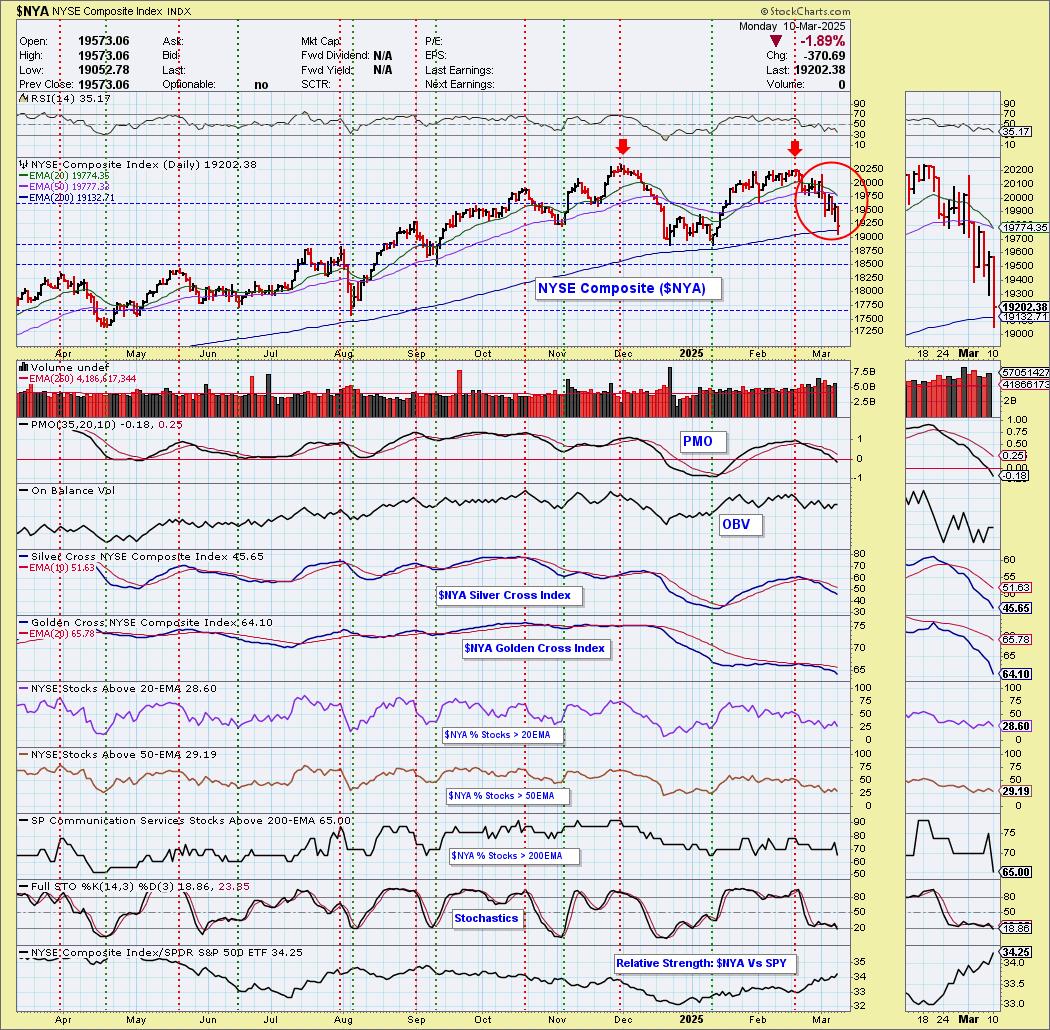
Today the NYSE Composite Index ($NYA) 20-day EMA crossed down through the 50-day EMA (Dark Cross), above the 200-day EMA, generating an IT Trend Model NEUTRAL Signal. Strong support is arriving, but it has already dropped beneath the 200-day EMA. The PMO is now in negative territory and participation is sickly reading in the 20th percentile for stocks above their 20/50-day EMAs. Stochastics also topped and are below 20 indicating severe internal weakness. We're not so sure support will hold here.
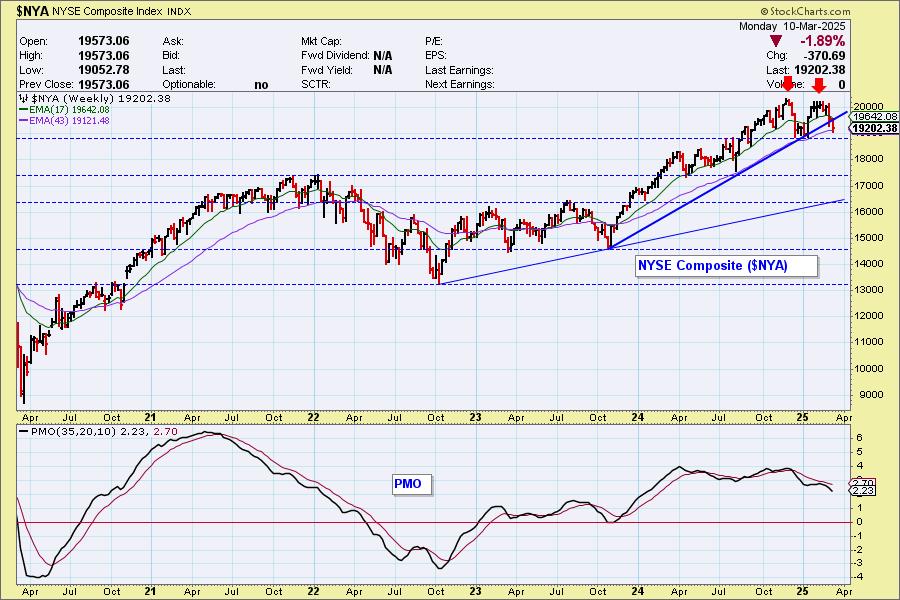
The weekly $NYA chart shows a double top and violation of a rising trend line. The weekly PMO is accelerating lower.
The DecisionPoint Alert Weekly Wrap presents an end-of-week assessment of the trend and condition of the Stock Market, the U.S. Dollar, Gold, Crude Oil, and Bonds. The DecisionPoint Alert daily report (Monday through Thursday) is abbreviated and gives updates on the Weekly Wrap assessments.
Watch the latest episode of DecisionPoint on our YouTube channel here!
MARKET/INDUSTRY GROUP/SECTOR INDEXES
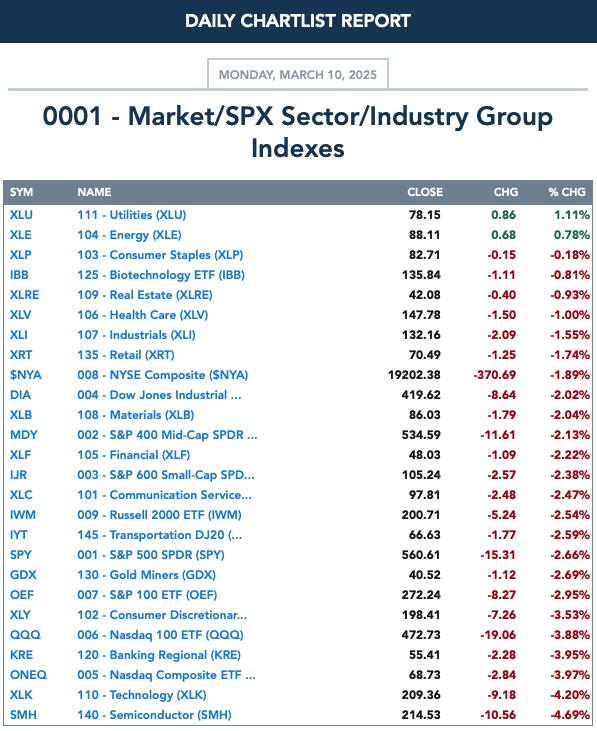
CLICK HERE for Carl's annotated Market Index, Sector, and Industry Group charts.
THE MARKET (S&P 500)
IT Trend Model: NEUTRAL as of 3/4/2025
LT Trend Model: BUY as of 3/29/2023
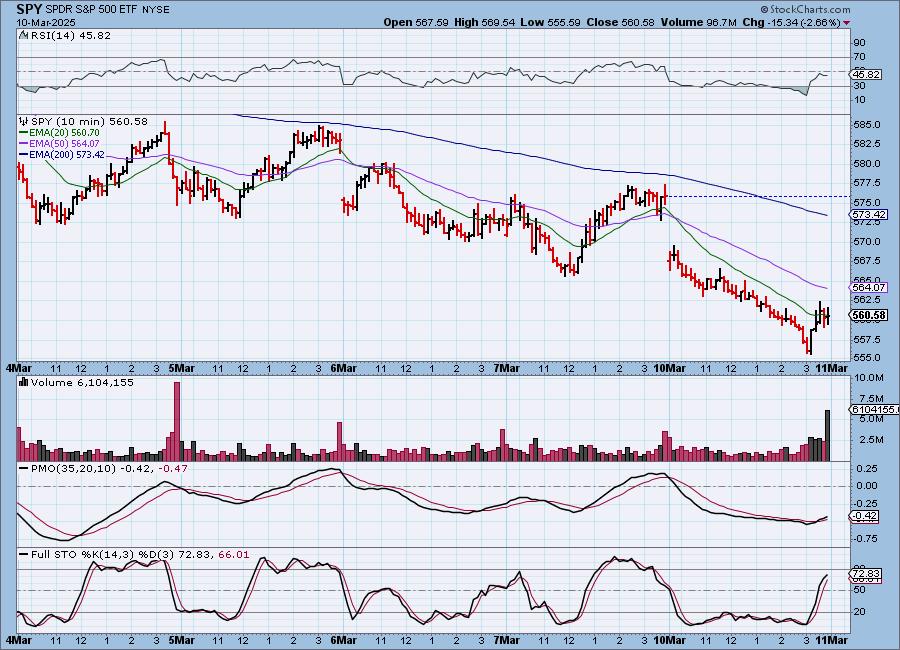
SPY 10-Minute Chart: It was a bad day that opened with a gap down to start trading. We did see a small rally to end the day and the 10-minute PMO has turned back up so we could see a little bit of followthrough.
SPY Daily Chart: Strong support was broken today at the 200-day EMA and horizontal support at the November low. The PMO is declining rapidly.
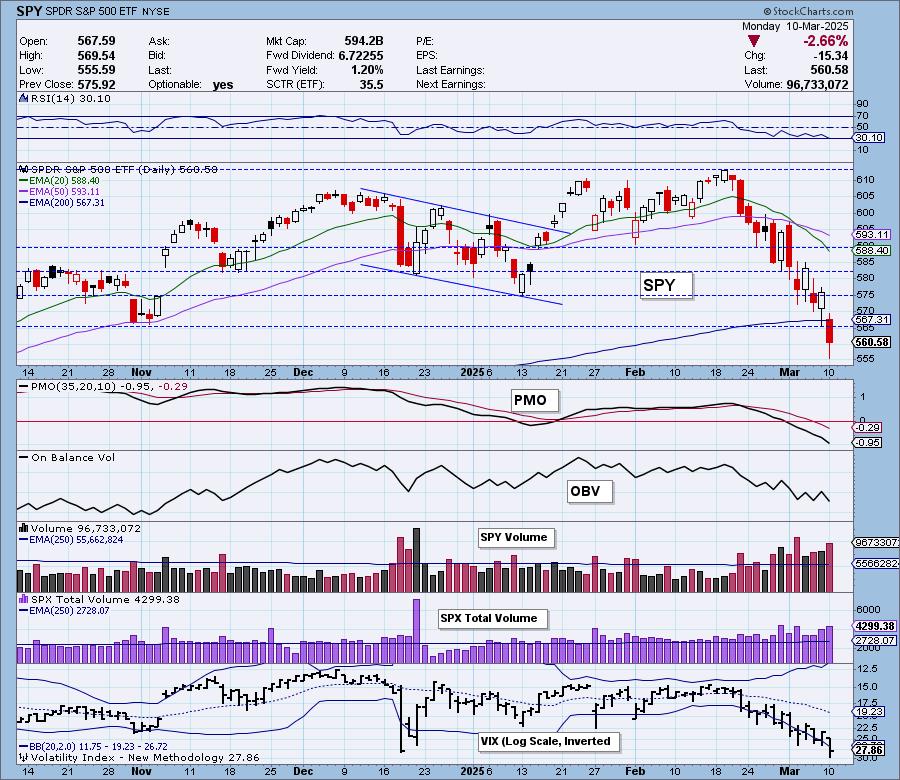
We got another puncture of the lower Bollinger Band on the inverted scale. Readings are in oversold territory, but it hasn't resulted in any meaningful upside yet. Stochastics are particularly bearish as they have topped below 20 indicating internal weakness. Mega-caps are quickly losing strength against equal-weight RSP and that is likely to keep the market in decline. Magnificent Seven stocks are all showing weakness.
 DON'T DELAY! IT'S FREE!
Here is the latest recording from 3/10. Click HERE to get to our video list.:
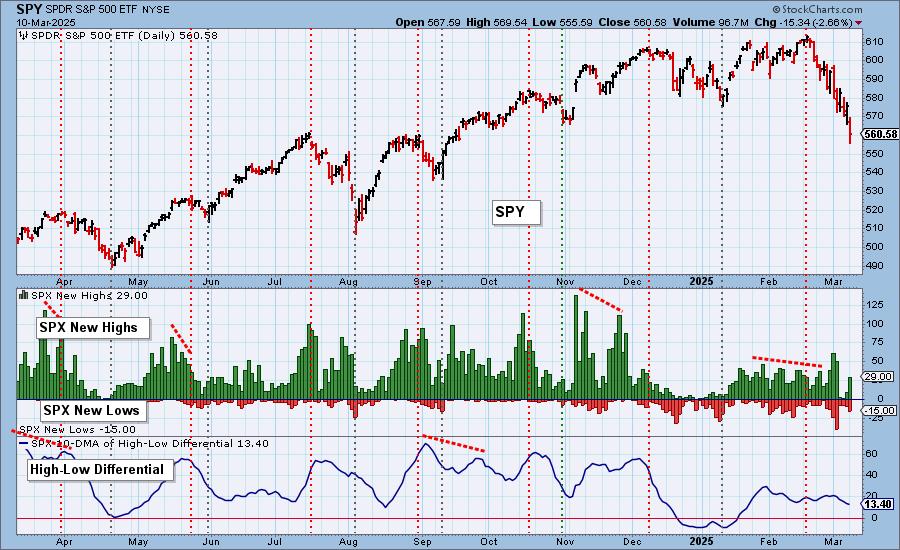
S&P 500 New 52-Week Highs/Lows: Not sure what is going on here, but we saw quite a few New Highs on today's deep decline. There are clearly some winners that keep on winning within the index. We did see an expansion in New Lows as we would expect. The High-Low Differential is still declining suggesting more market weakness ahead.
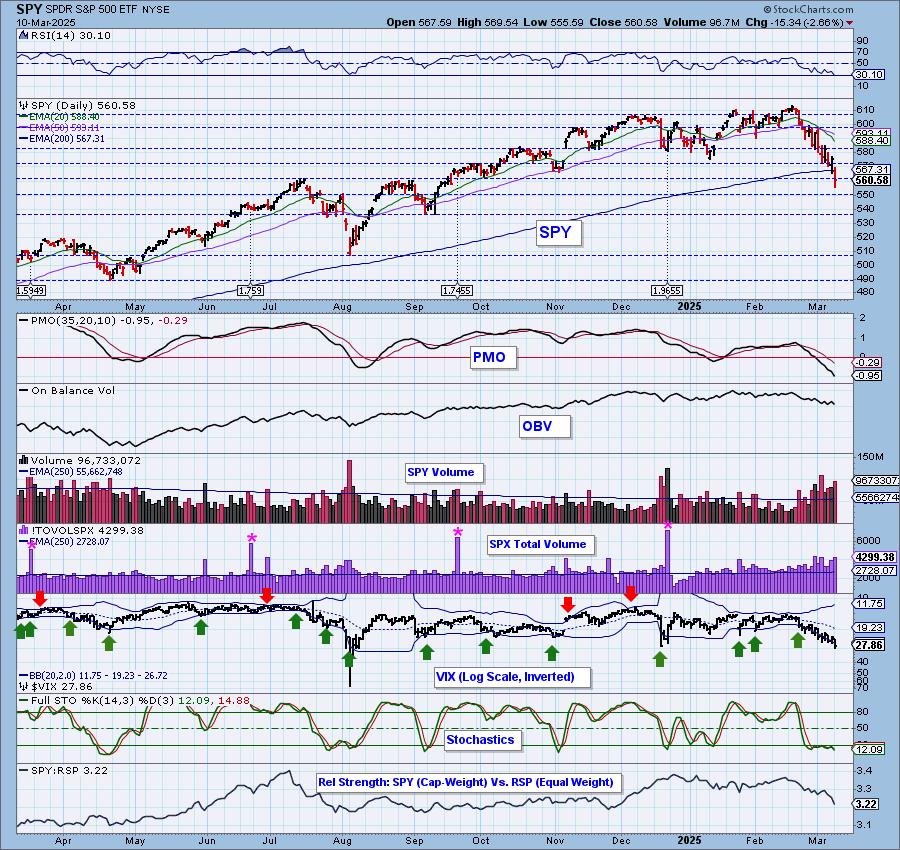
Climax* Analysis: There are two climax readings (and one "almost") among the four relevant indicators, giving us a downside exhaustion climax. SPX Total Volume was 158% of the one-year daily average volume, which could be considered blowout volume, potentially ending the down trend in the short term. Emphasis on "short".
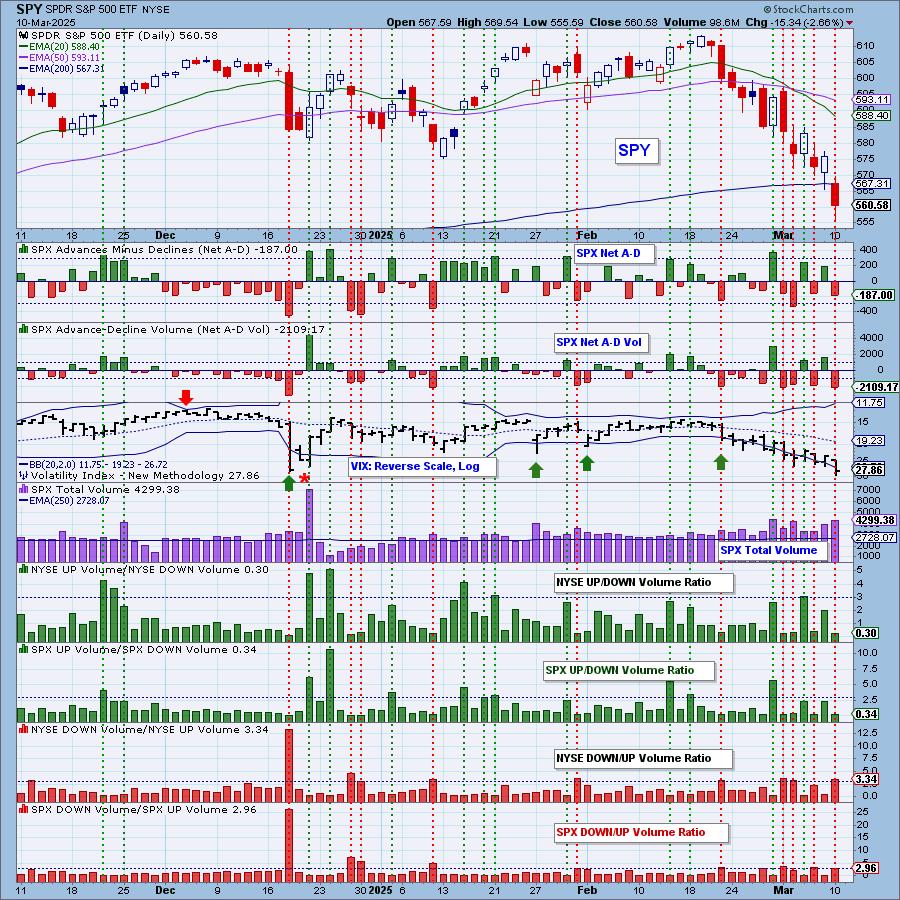
*A climax is a one-day event when market action generates very high readings in, primarily, breadth and volume indicators. We also include the VIX, watching for it to penetrate outside the Bollinger Band envelope. The vertical dotted lines mark climax days -- red for downside climaxes, and green for upside. Climaxes are at their core exhaustion events; however, at price pivots they may be initiating a change of trend.
Short-Term Market Indicators: The short-term market trend is DOWN and the condition is NEUTRAL.
We could say that Swenlin Trading Oscillators (STOs) are near-term oversold, but they are still in decline. Participation is reading below our bullish 50% threshold and we continued to lose more rising PMOs. These readings are not oversold yet and imply more downside in the short term.
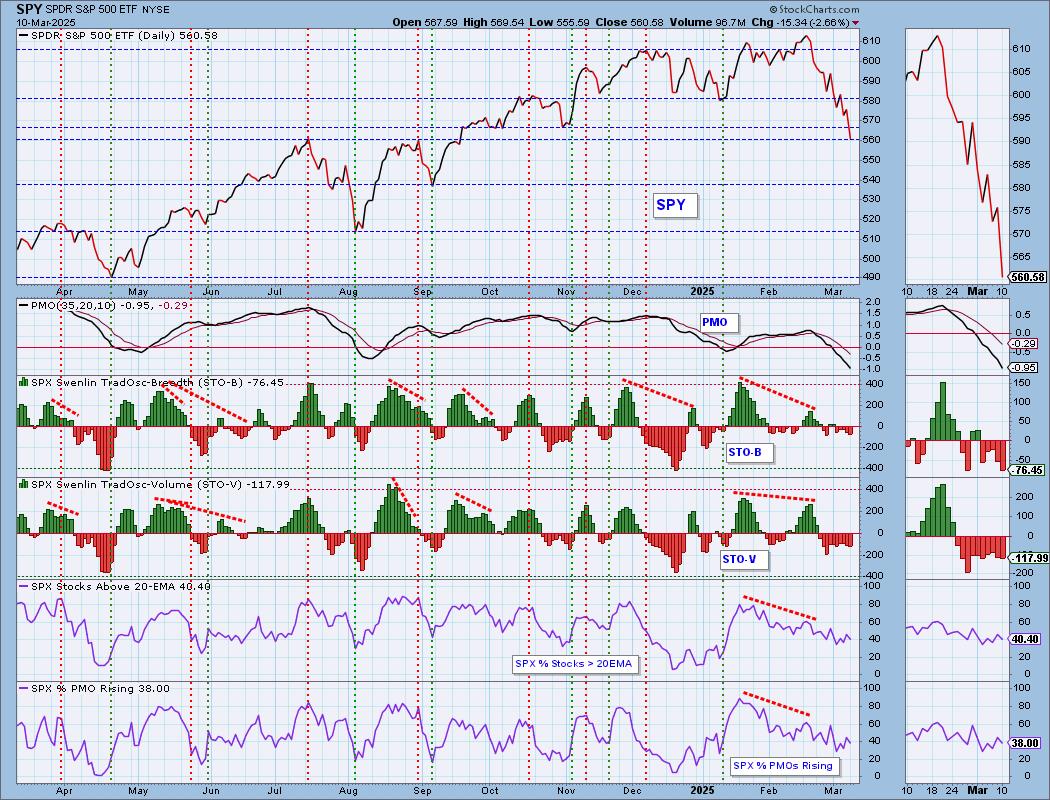
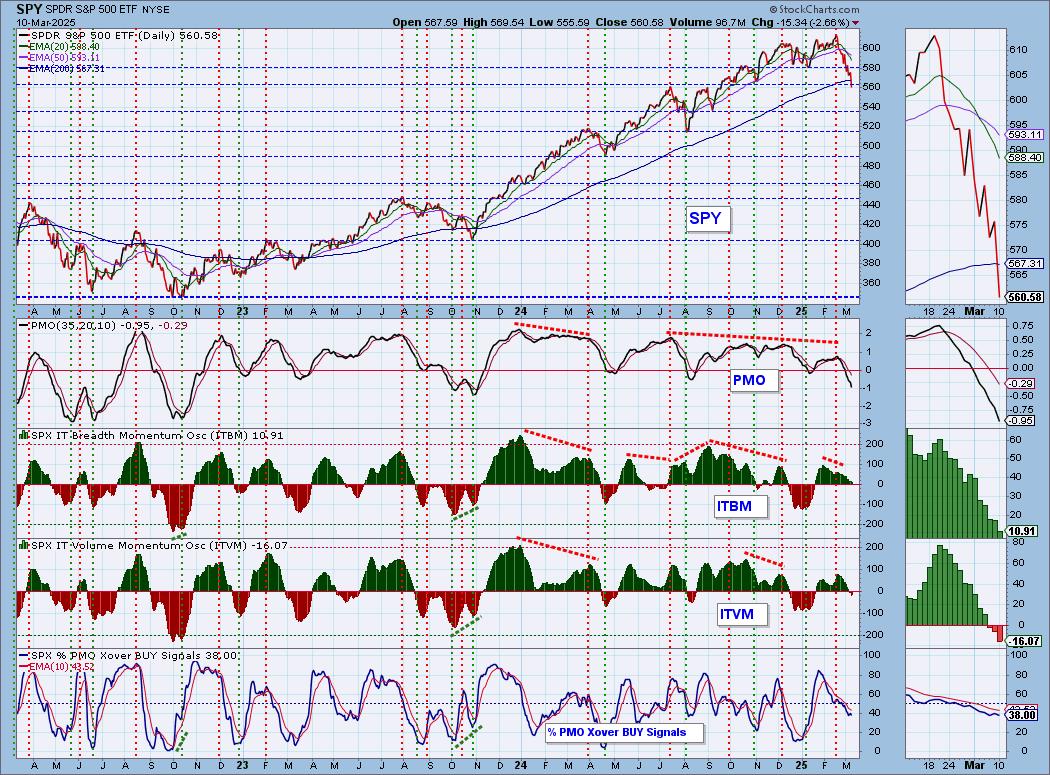
Intermediate-Term Market Indicators: The intermediate-term market trend is DOWN and the condition is NEUTRAL.
The ITBM and ITVM are not oversold, they sit in neutral territory leaving the market exposed to moves in either direction. They are currently declining which is bad for the intermediate term. %PMO Xover BUY Signals topped beneath the signal line which is particularly bearish.
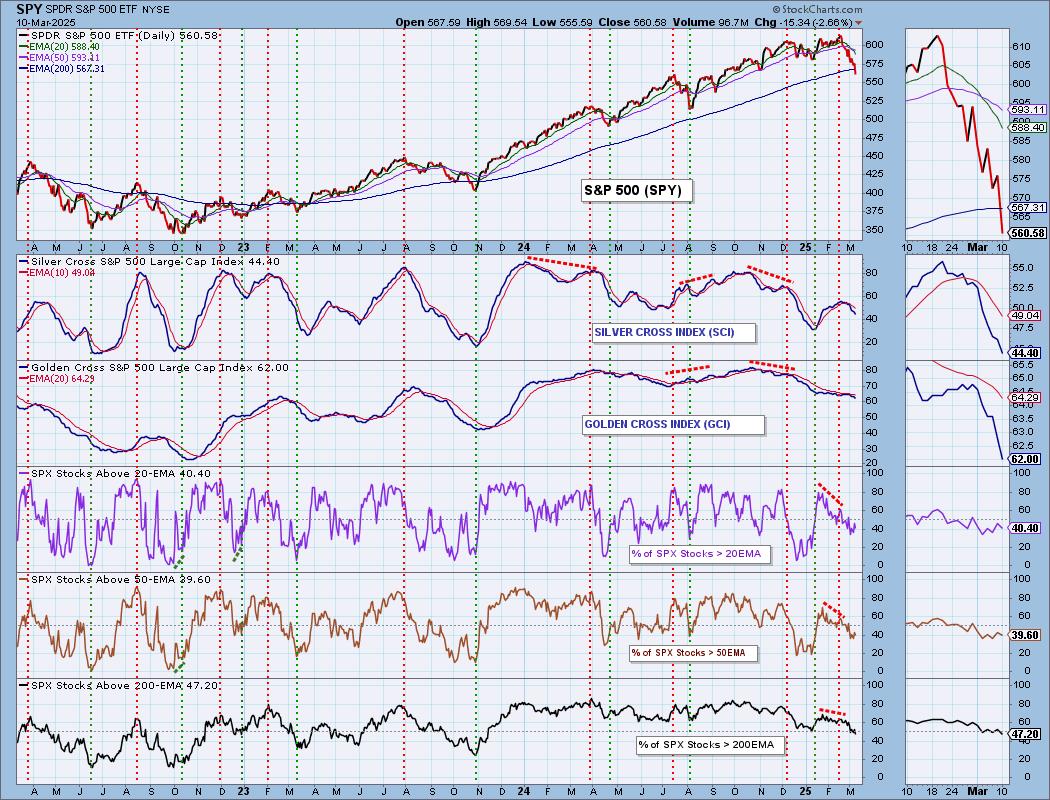
PARTICIPATION CHART (S&P 500): The following chart objectively shows the depth and trend of participation for the SPX in two time frames.
- Intermediate-Term - the Silver Cross Index (SCI) shows the percentage of SPX stocks on IT Trend Model BUY signals (20-EMA > 50-EMA). The opposite of the Silver Cross is a "Dark Cross" -- those stocks are, at the very least, in a correction.
- Long-Term - the Golden Cross Index (GCI) shows the percentage of SPX stocks on LT Trend Model BUY signals (50-EMA > 200-EMA). The opposite of a Golden Cross is the "Death Cross" -- those stocks are in a bear market.
The market bias is BEARISH in the intermediate and long terms.
As noted earlier, participation continues in a declining trend, but are not oversold yet so they could accommodate lower prices for some time. The Silver Cross Index is dropping below our bullish 50% threshold. It is below its signal line so the IT Bias is BEARISH. The Golden Cross Index is falling fast now and given we have so few stocks above their 200-day EMA, it will continue to lose ground. The Golden Cross Index is below its signal line so the LT Bias can be read as BEARISH.
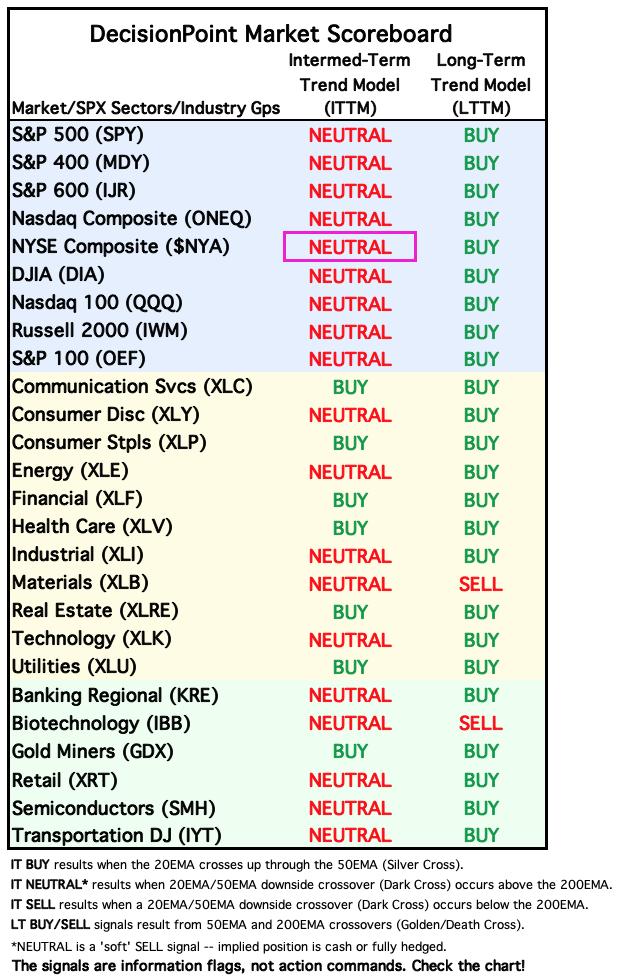
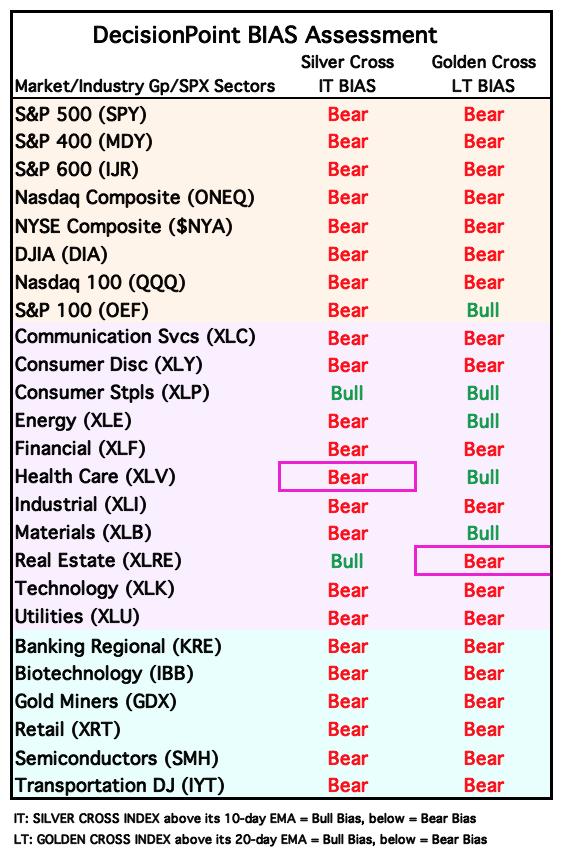
BIAS Assessment: The following table expresses the current BIAS of various price indexes based upon the relationship of the Silver Cross Index to its 10-day EMA (intermediate-term), and of the Golden Cross Index to its 20-day EMA (long-term). When the Index is above the EMA it is bullish, and it is bearish when the Index is below the EMA. The BIAS does not imply that any particular action should be taken. It is information to be used in the decision process.
The items with highlighted borders indicate that the BIAS changed today.
*****************************************************************************************************
CONCLUSION: IT Biases are nearly all bearish on the Bias Table above. This suggests short-term weakness. The STOs as well as the ITBM and ITVM are falling in neutral territory. Participation is below our bullish 50% threshold and is in declining trends. The big problem is that participation is not oversold yet which implies more downside likely in the intermediate term. We did see a downside exhaustion climax today with the VIX puncturing the lower Bollinger Band yet again. This calls for a reversal in the very short term. A snapback at this level makes sense given we are at important support levels. The market has gotten very extended to the downside and that does leave the ground fertile for an upside reversal.
Erin is 10% long, 0% short. (This is intended as information, not a recommendation.)
*****************************************************************************************************
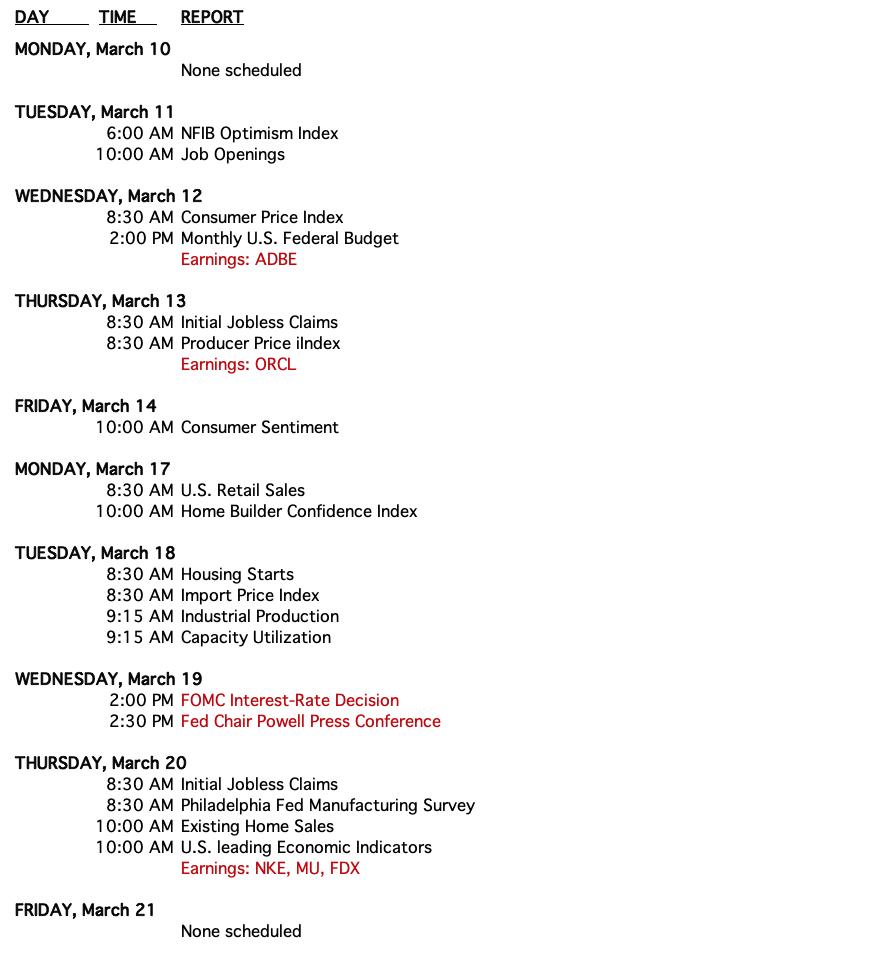
CALENDAR
Have you subscribed the DecisionPoint Diamonds yet? DP does the work for you by providing handpicked stocks/ETFs from exclusive DP scans! Add it with a discount! Contact support@decisionpoint.com for more information!
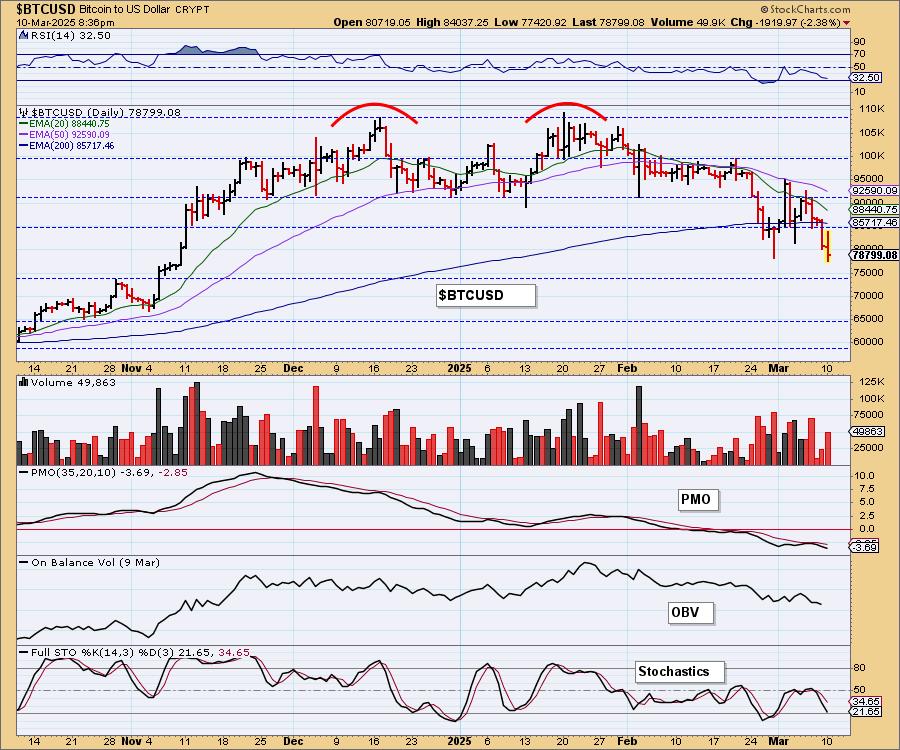
BITCOIN
We see that the bearish double top pattern has executed and the minimum downside target is near at about 75,000. Given the declining PMO below its signal line and the zero line and diving Stochastics, we don't think the decline is over yet. Look for support at 75,000 to be tested.
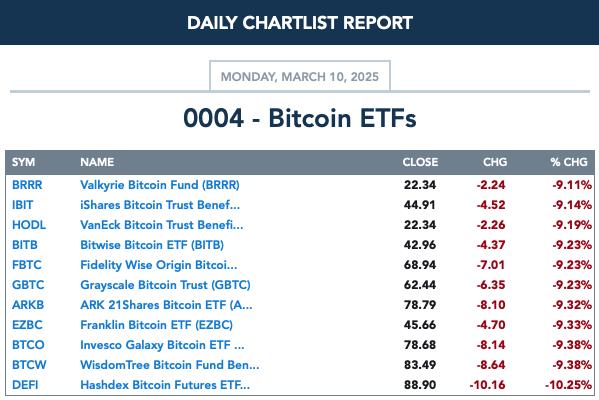
BITCOIN ETFs
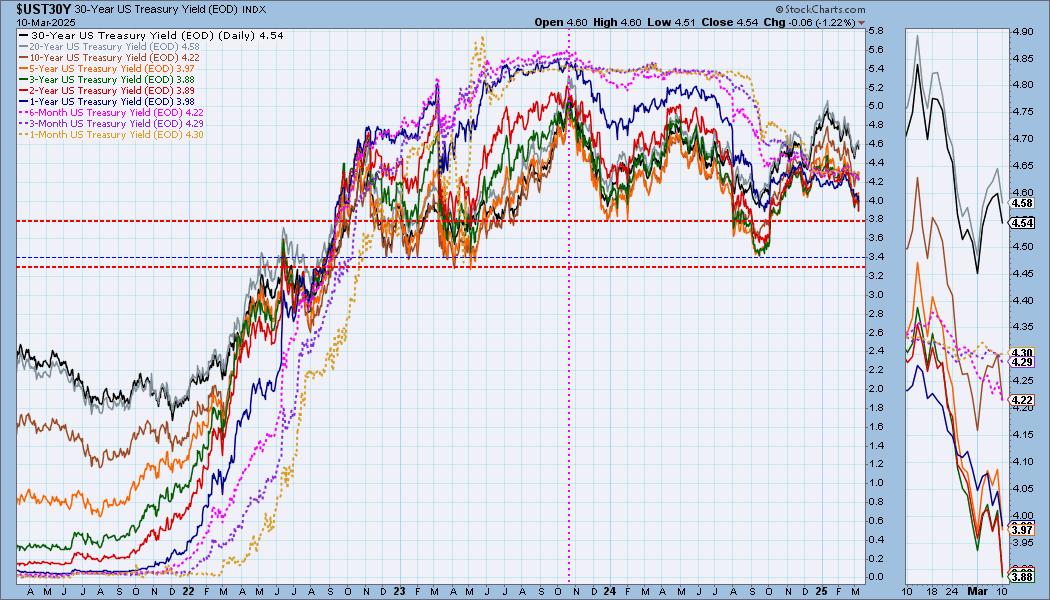
INTEREST RATES
We were looking for an upside reversal in yields, but given today's big decline, it may be a bit longer before we get interest rates moving higher again.
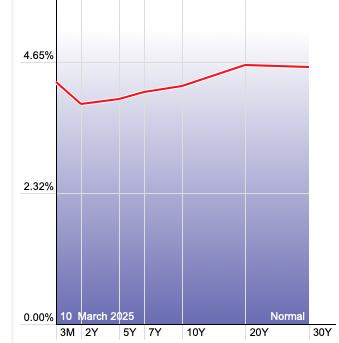
The Yield Curve Chart from StockCharts.com shows us the inversions taking place. The red line should move higher from left to right. Inversions are occurring where it moves downward.
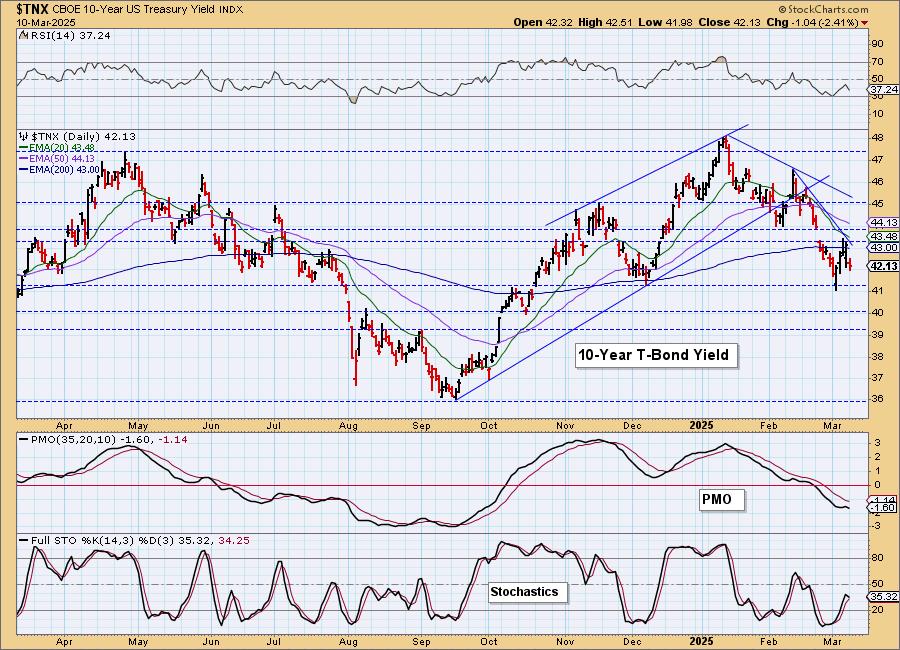
10-YEAR T-BOND YIELD
We have a steeper declining tops trendline now. It does seem to suggest a drop ahead. The PMO has topped beneath its signal line in very bearish fashion and Stochastics topped in negative territory. Support is likely to be broken at 4.1%.
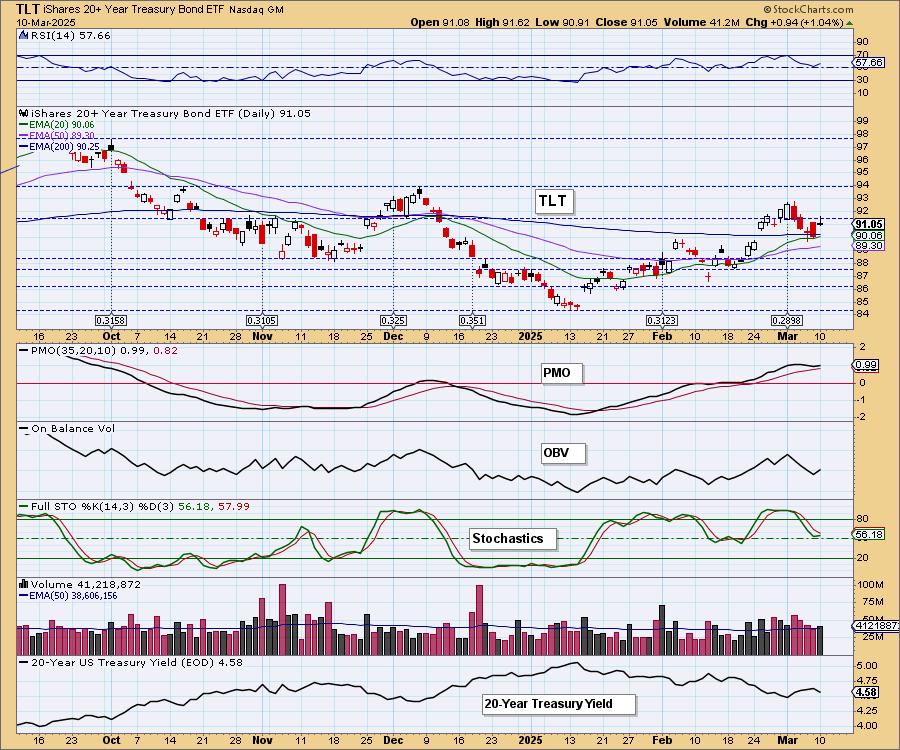
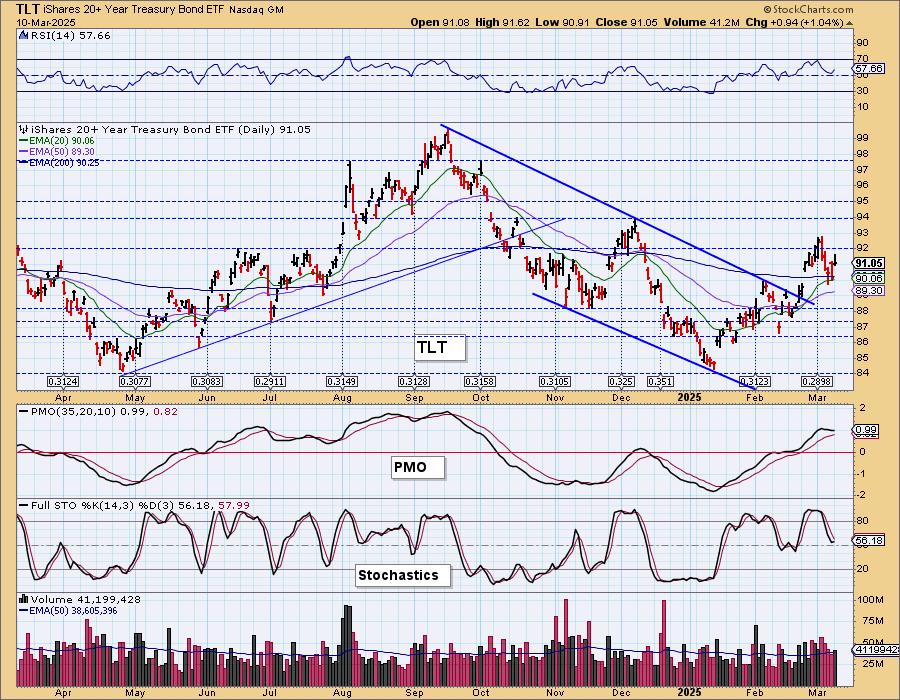
BONDS (TLT)
IT Trend Model: BUY as of 2/25/2025
LT Trend Model: SELL as of 12/13/2024
TLT Daily Chart: We believe Bonds have more upside to go now that yields are failing to breakout. The RSI is positive and not at all overbought. Best of all the PMO has surged (bottomed) above the signal line. Stochastics have also turned back up. The next level of strong resistance arrives at 94 which is where we would expect it to run into trouble.
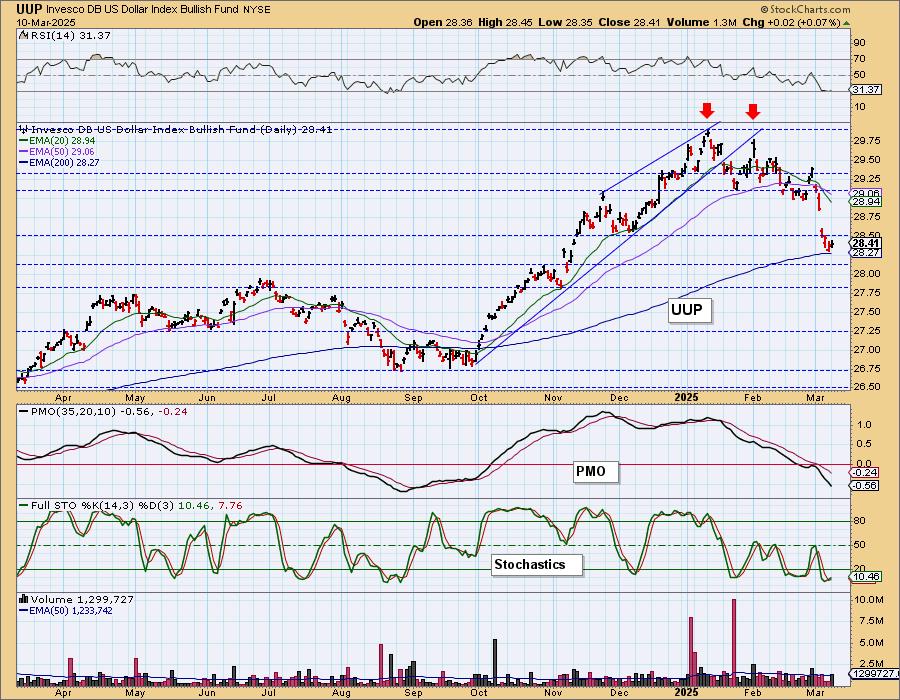
DOLLAR (UUP)
IT Trend Model: NEUTRAL as of 3/5/2025
LT Trend Model: BUY as of 5/25/2023
UUP Daily Chart: The Dollar saw a small rally today. The bounce is coming off support at the 200-day EMA and horizontal support at the October high. It is a little early to count on this rally particularly given that Stochastics are still below 20, but they are rising so this could mean a few more up days ahead.
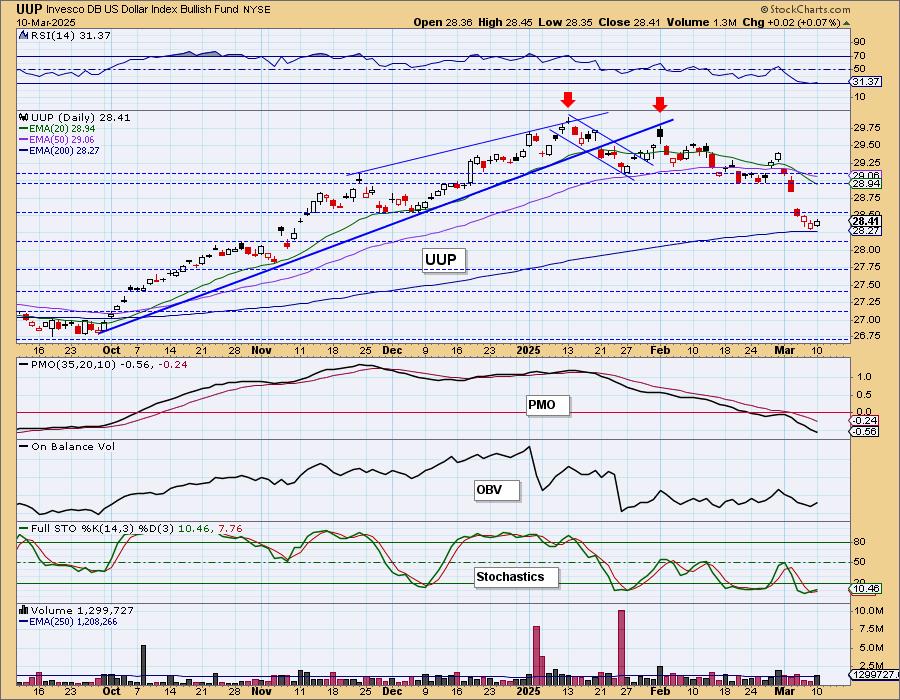
The decline looks overdone so a bit more upside makes sense here.
GOLD
IT Trend Model: BUY as of 1/10/2025
LT Trend Model: BUY as of 10/20/2023
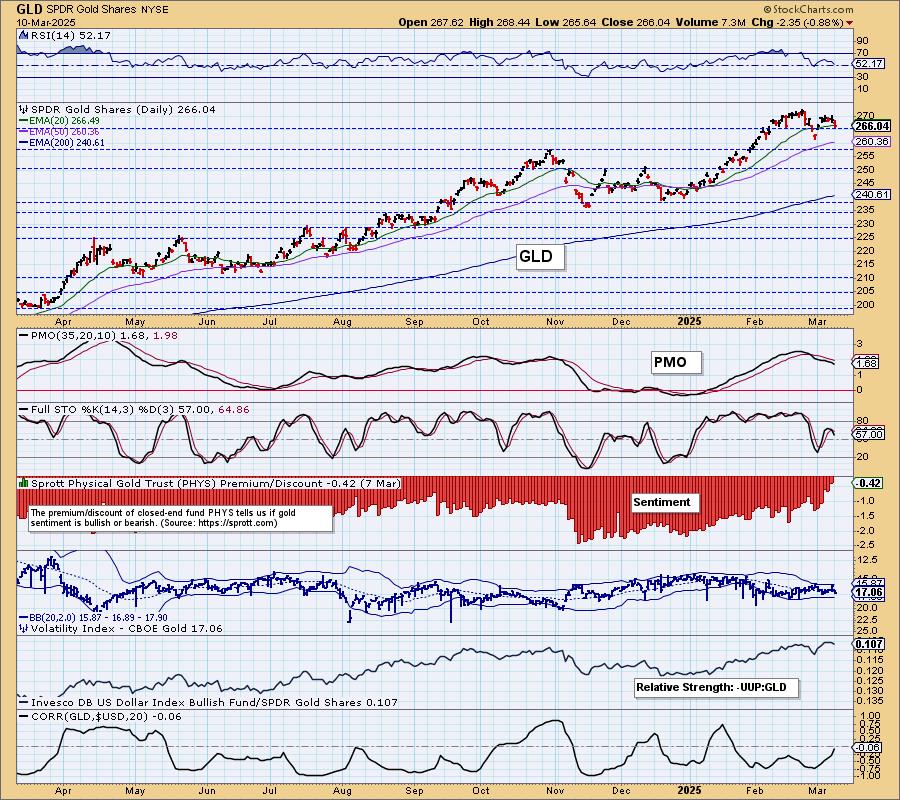
GLD Daily Chart: Gold is topping right now. We have a less accelerated rising bottoms trendline, but we suspect that is not going to hold. We now have a bearish double top visible on the chart that suggests that Gold will pull back further. The declining PMO and Stochastics seem to confirm that bearish outlook.
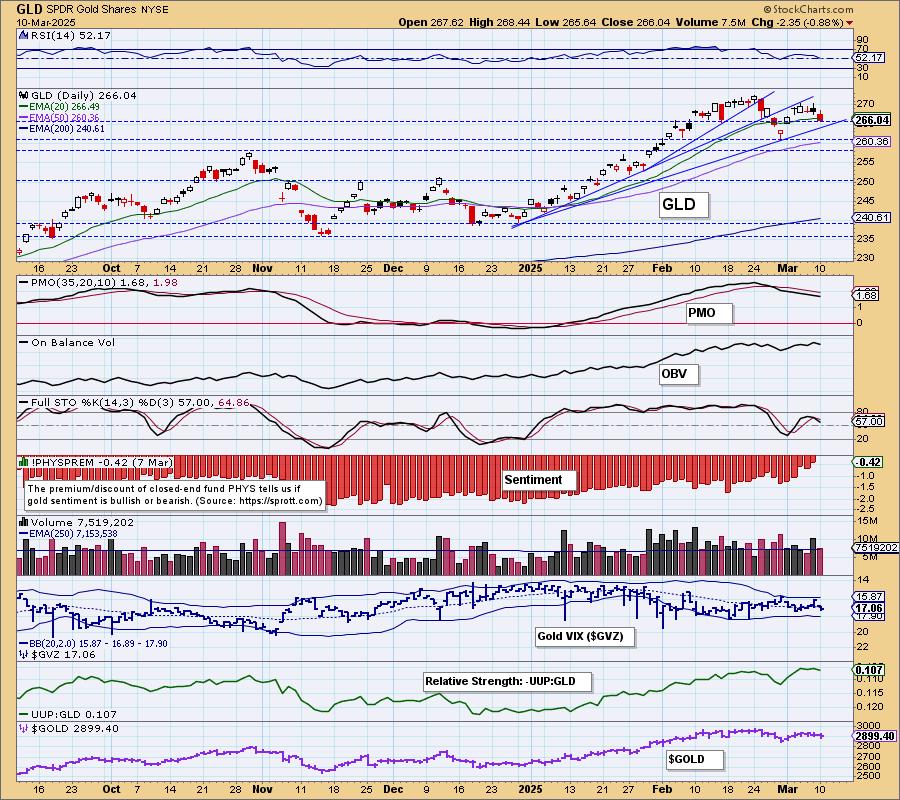
So much for Gold as a safe haven in times of turmoil. We do see that discounts are extremely low so despite this decline, investors are more bullish. This is actually a problem as sentiment is contrarian and these are the lowest discounts we have seen in some time. This could be signaling trouble ahead for Gold.
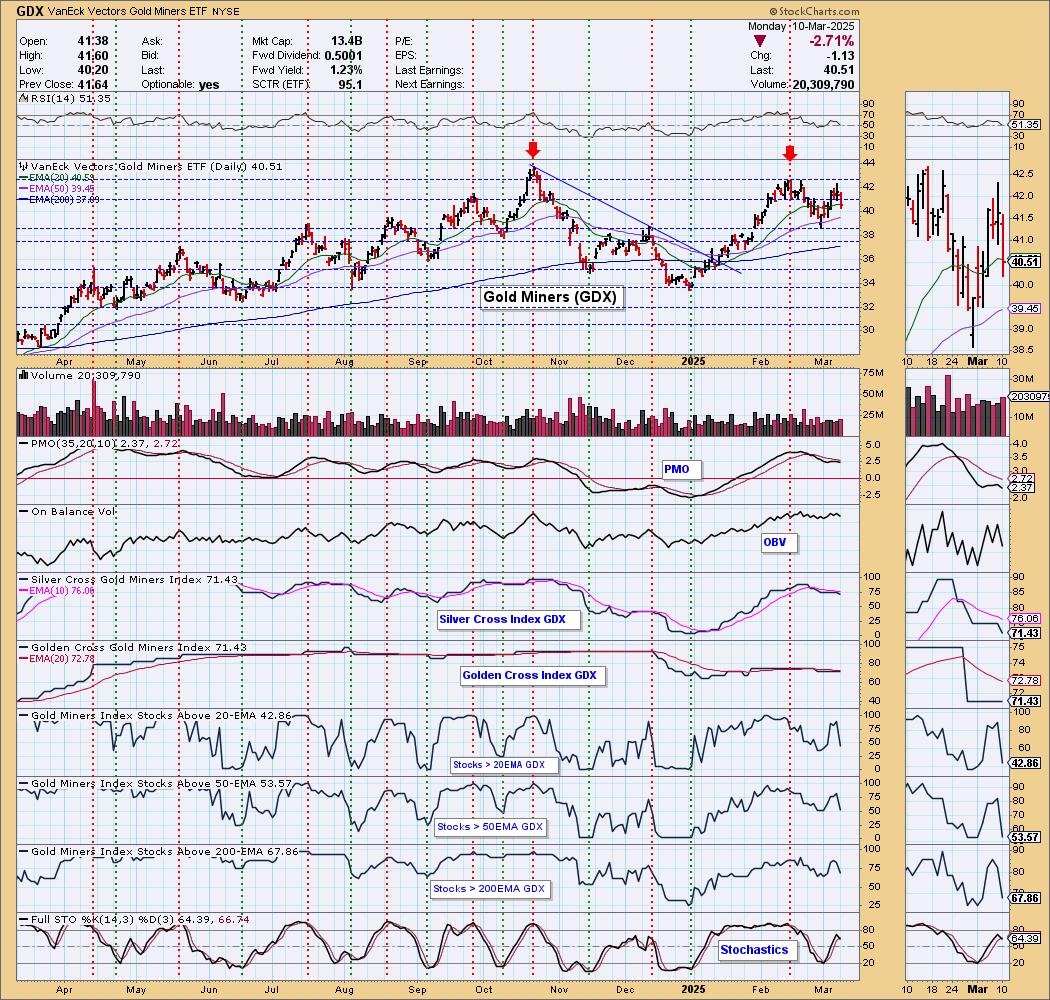
GOLD MINERS (GDX) Daily Chart: The bearish double top is still in force. Gold looks quite weak so there is a high likelihood that GDX will suffer. Participation shrunk on the big decline. The Silver Cross Index is declining again. The PMO has topped beneath its signal line which is especially bearish. Stochastics are also in decline.
CRUDE OIL (USO)
IT Trend Model: BUY as of 12/24/2024
LT Trend Model: BUY as of 1/10/2025
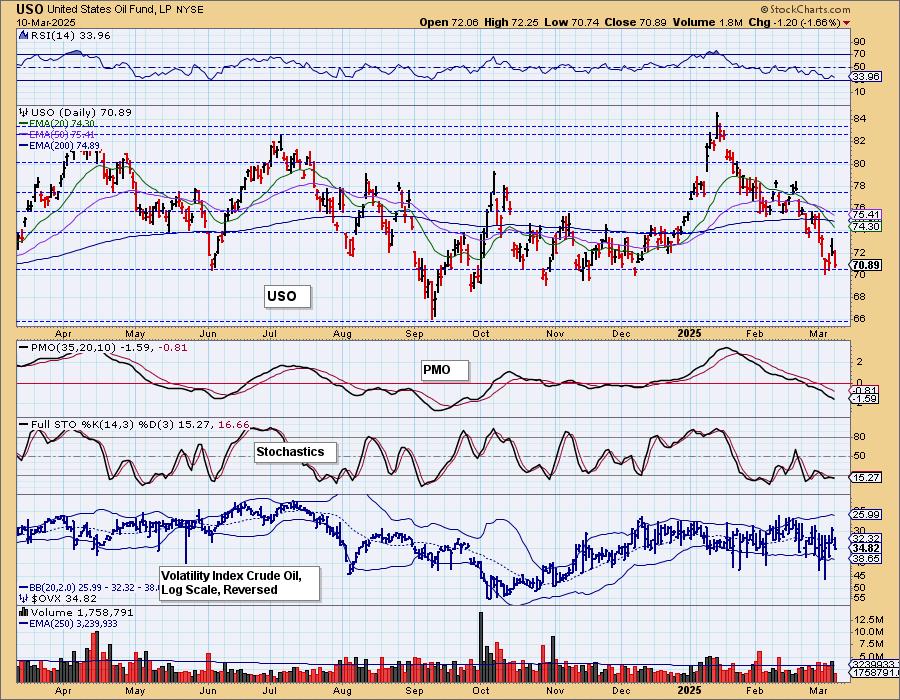
USO Daily Chart: Crude Oil continues to come down in price. Support is coming up, but we don't think we'll get an upside reversal given production levels remain the same with the expectation of more production from the US. Indicators are very weak. The RSI isn't oversold yet so it seems early to be looking for an upside reversal. Stochastics are holding below 20 signaling extreme internal weakness. We are looking for price to test support at 68.
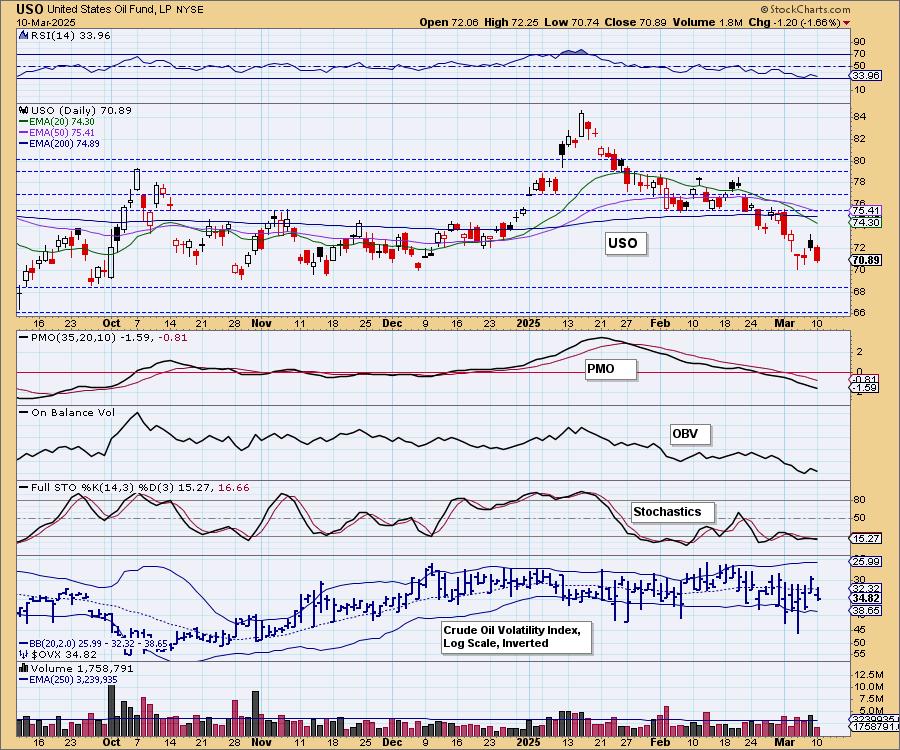
The strongest level of support lies at 66 or the September low. There are multiple short-term support levels based on the multiple bottoms to finish 2024. Any of those areas could support a small rally, but the outlook is still very bearish for Crude right now.
Good Luck & Good Trading!
Erin Swenlin and Carl Swenlin
Technical Analysis is a windsock, not a crystal ball. --Carl Swenlin
(c) Copyright 2025 DecisionPoint.com
Disclaimer: This blog is for educational purposes only and should not be construed as financial advice. The ideas and strategies should never be used without first assessing your own personal and financial situation, or without consulting a financial professional. Any opinions expressed herein are solely those of the author, and do not in any way represent the views or opinions of any other person or entity.
DecisionPoint is not a registered investment advisor. Investment and trading decisions are solely your responsibility. DecisionPoint newsletters, blogs or website materials should NOT be interpreted as a recommendation or solicitation to buy or sell any security or to take any specific action.
NOTE: The signal status reported herein is based upon mechanical trading model signals, specifically, the DecisionPoint Trend Model. They define the implied bias of the price index based upon moving average relationships, but they do not necessarily call for a specific action. They are information flags that should prompt chart review. Further, they do not call for continuous buying or selling during the life of the signal. For example, a BUY signal will probably (but not necessarily) return the best results if action is taken soon after the signal is generated. Additional opportunities for buying may be found as price zigzags higher, but the trader must look for optimum entry points. Conversely, exit points to preserve gains (or minimize losses) may be evident before the model mechanically closes the signal.
Helpful DecisionPoint Links:
DecisionPoint Alert Chart List
DecisionPoint Golden Cross/Silver Cross Index Chart List
DecisionPoint Sector Chart List
Price Momentum Oscillator (PMO)