
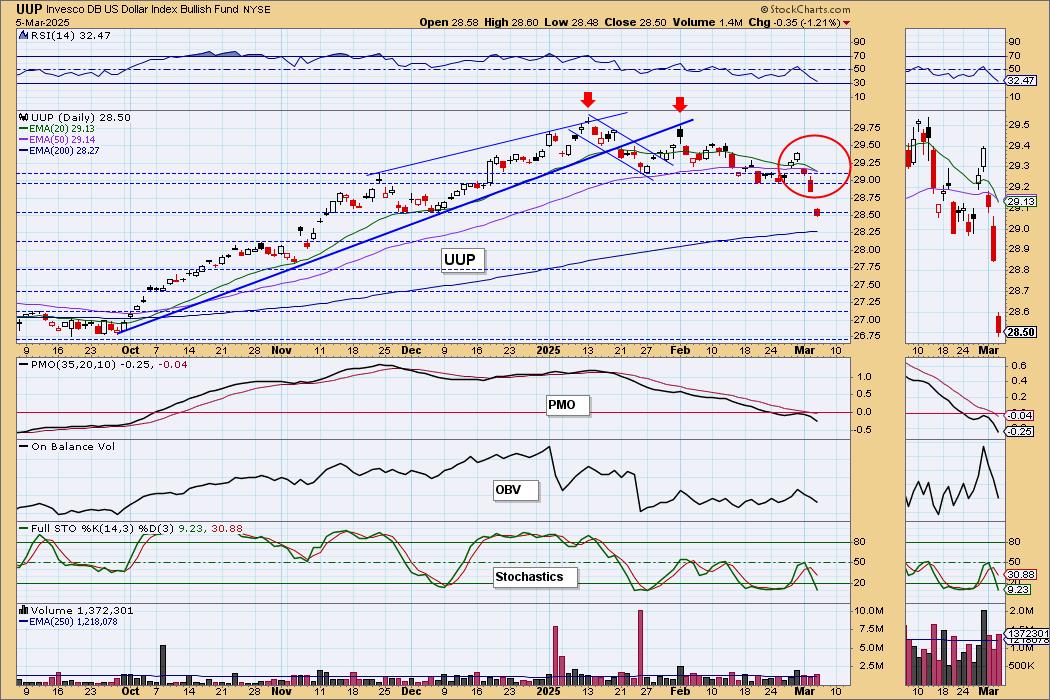
Today the U.S. Dollar Index ETF (UUP) 20-day EMA crossed down through the 50-day EMA (Dark Cross), above the 200-day EMA, generating an IT Trend Model NEUTRAL Signal. We'll continue the discussion in the Dollar Index section below.
The DecisionPoint Alert Weekly Wrap presents an end-of-week assessment of the trend and condition of the Stock Market, the U.S. Dollar, Gold, Crude Oil, and Bonds. The DecisionPoint Alert daily report (Monday through Thursday) is abbreviated and gives updates on the Weekly Wrap assessments.
Watch the latest episode of DecisionPoint on our YouTube channel here!
MARKET/INDUSTRY GROUP/SECTOR INDEXES
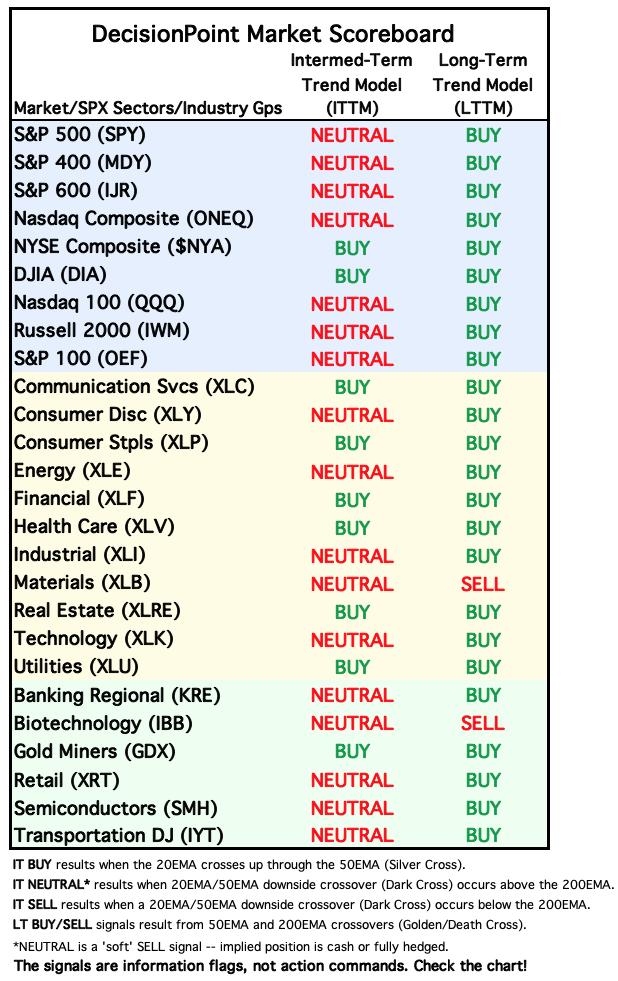
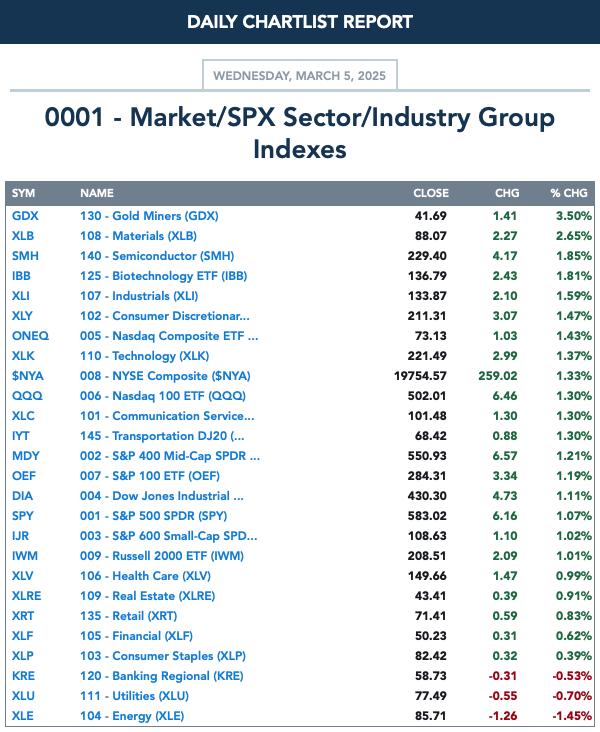
CLICK HERE for Carl's annotated Market Index, Sector, and Industry Group charts.
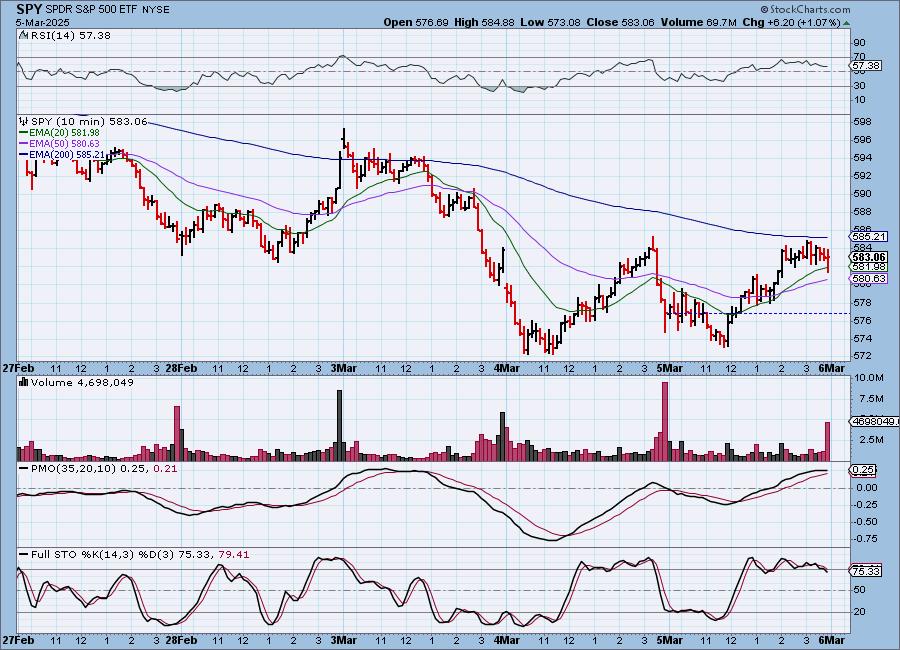
THE MARKET (S&P 500)
IT Trend Model: NEUTRAL as of 3/4/2025
LT Trend Model: BUY as of 3/29/2023
SPY 10-Minute Chart: We saw a decline in the morning, but the market recovered and spent the rest of the day trending upward. There was a rounding off of price to finish the day. The 10-minute PMO is trying to top.
SPY Daily Chart: Support essentially held today on the rebound, but it did nothing to help the PMO which is still headed lower below the zero line. The OBV is confirming this decline with a decline of its own.
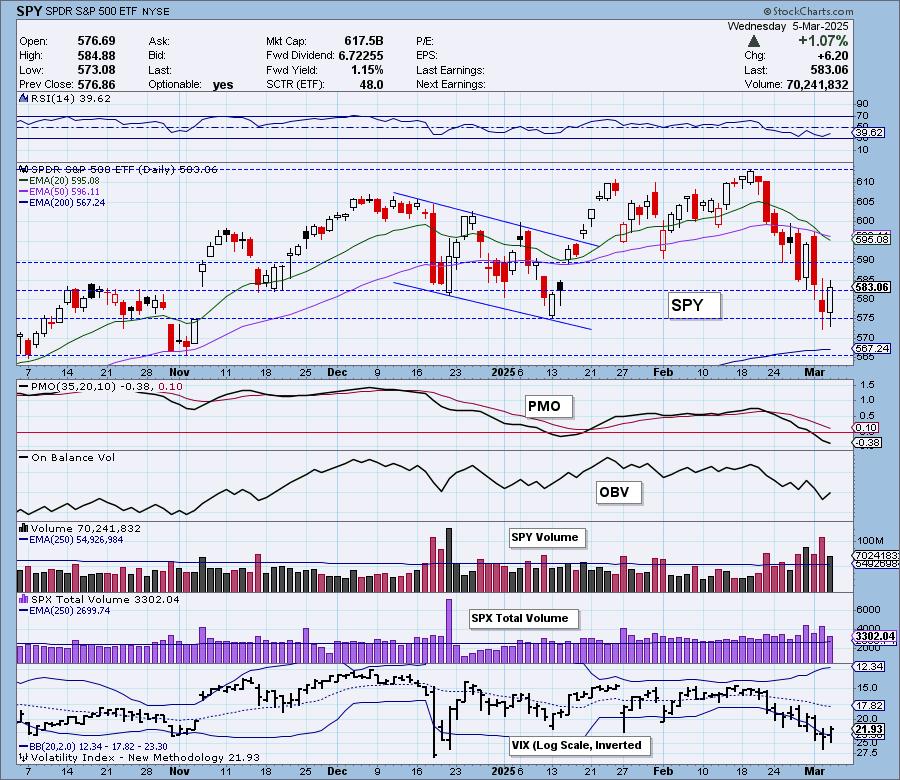
The VIX continues to punch through the bottom Bollinger Band on our inverted scale but so far it hasn't led to any lasting upside. Stochastics are very weak reading below 20 so there is internal weakness here.

Here is the latest recording from 3/3. Click HERE to get to our video list.:
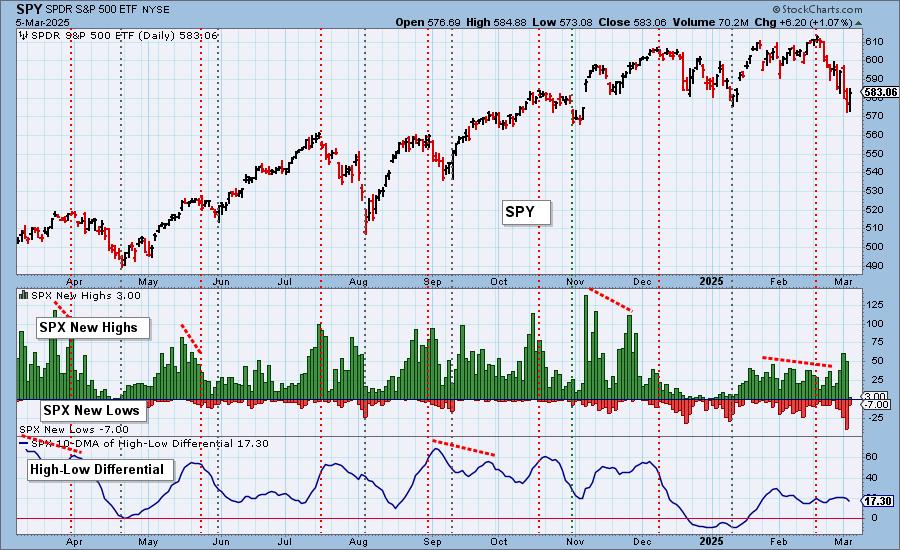
S&P 500 New 52-Week Highs/Lows: New Highs were barely visible today which to us is a negative divergence with price. We would expect to see more on a rally of this magnitude. New Lows did contract as expected. The High-Low Differential has topped and is headed lower.
Climax* Analysis: There were two climax readings on the four relevant indicators today, so we have an upside initiation climax. There have been four consecutive climax days, and the first three proved to be wrong about subsequent market direction. We don't know if today's climax signal will follow suit, but it is certain that the market is having a problem making up its mind.
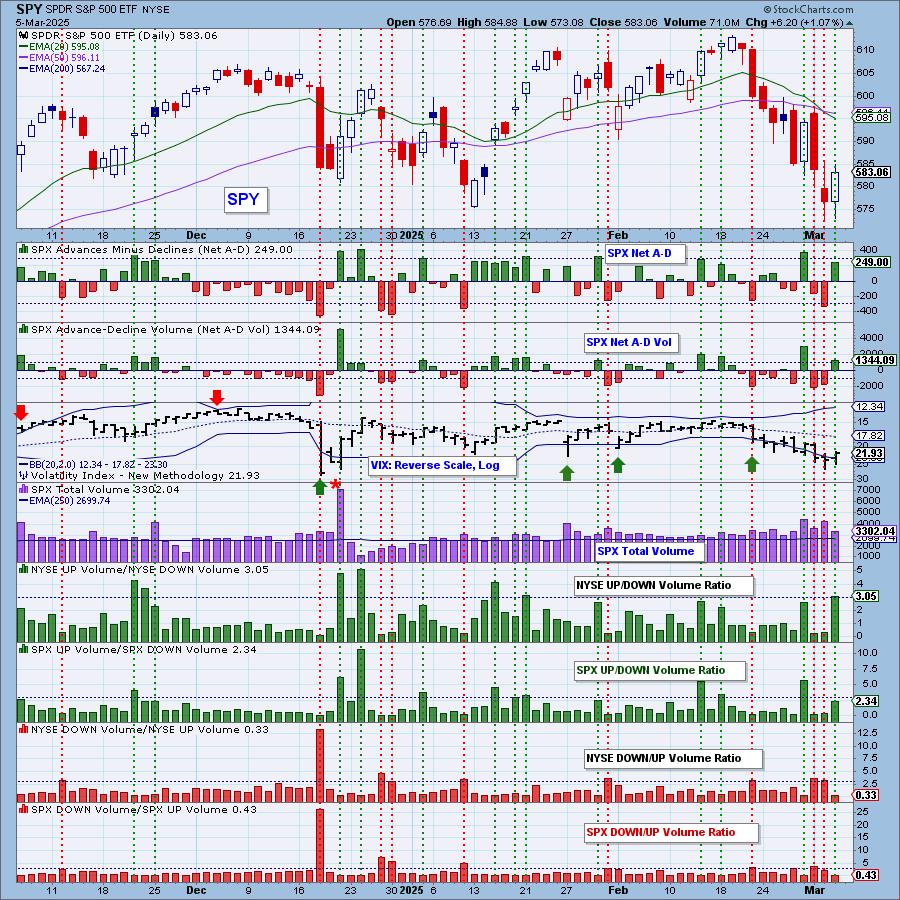
*A climax is a one-day event when market action generates very high readings in, primarily, breadth and volume indicators. We also include the VIX, watching for it to penetrate outside the Bollinger Band envelope. The vertical dotted lines mark climax days -- red for downside climaxes, and green for upside. Climaxes are at their core exhaustion events; however, at price pivots they may be initiating a change of trend.
Short-Term Market Indicators: The short-term market trend is DOWN and the condition is NEUTRAL.
Not surprisingly Swenlin Trading Oscillators (STOs) turned back up today. They are really struggling to find direction in this market so we won't get overly excited about their upside reversal today. It is a good sign though. Participation and %PMOs Rising managed to tick higher on the rally as we would expect. Still, these readings are below our bullish 50% threshold so again, we don't want to get too excited here.
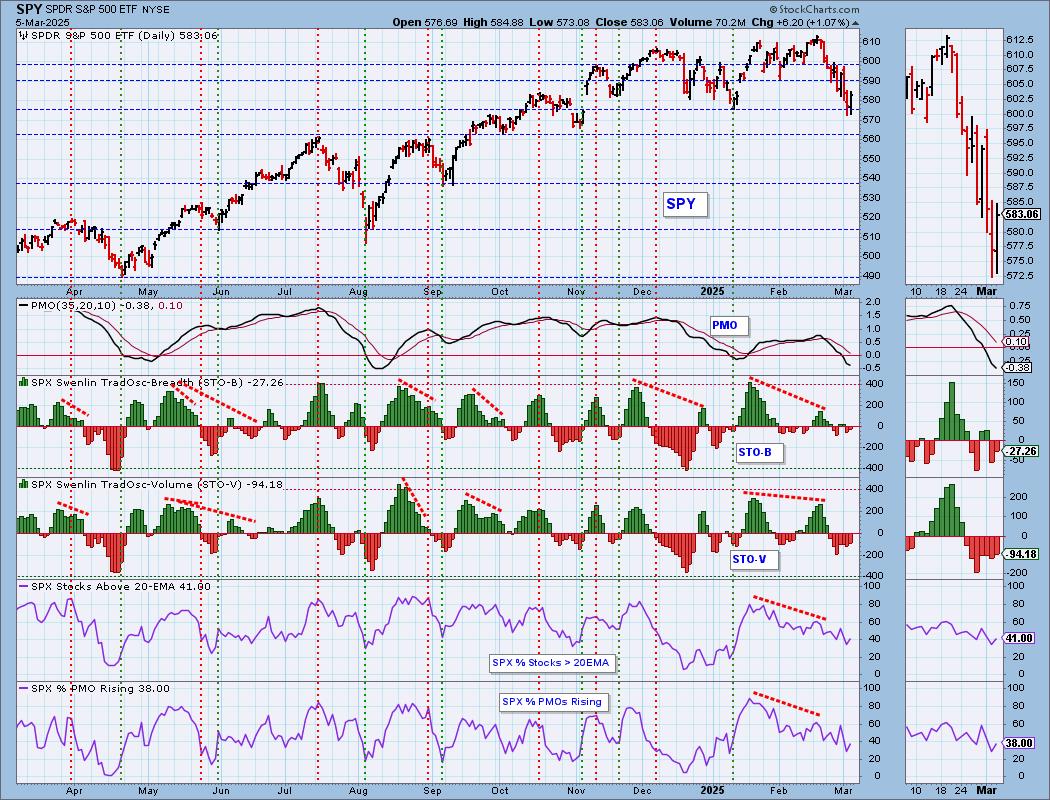
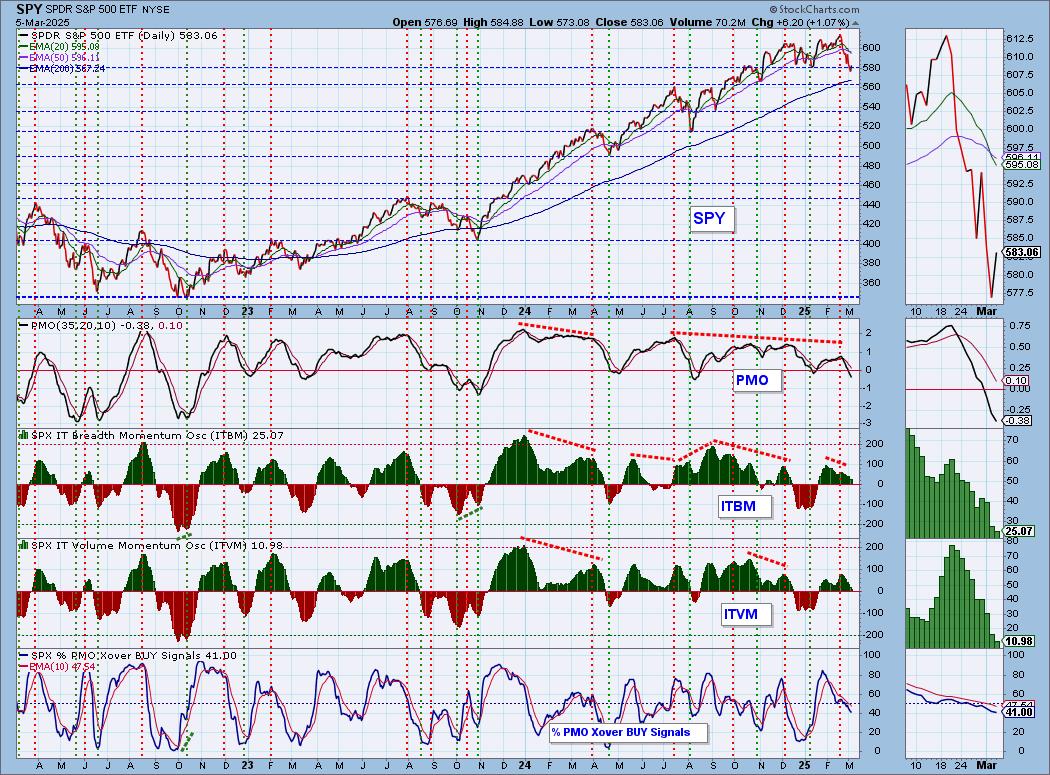
Intermediate-Term Market Indicators: The intermediate-term market trend is UP and the condition is NEUTRAL.
The ITBM and ITVM were not impressed with today's rally as both of them declined today. We lost more PMO BUY Signals and given only 38% are rising, it could continue to fall a bit further.
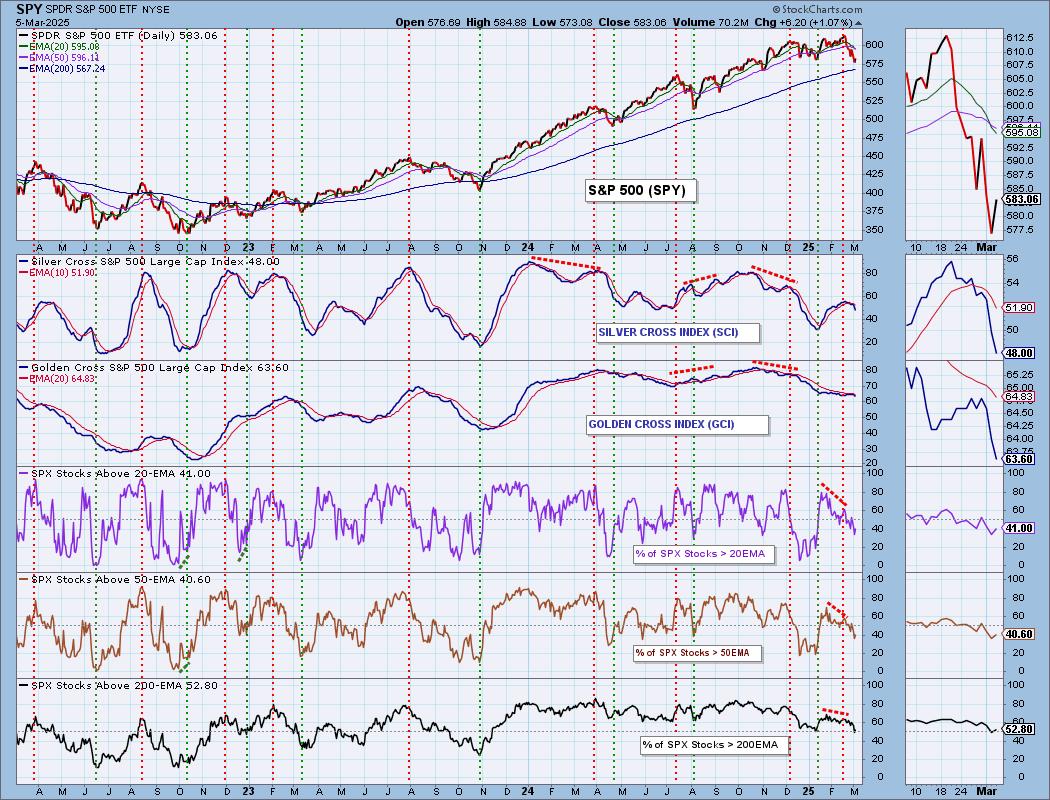
PARTICIPATION CHART (S&P 500): The following chart objectively shows the depth and trend of participation for the SPX in two time frames.
- Intermediate-Term - the Silver Cross Index (SCI) shows the percentage of SPX stocks on IT Trend Model BUY signals (20-EMA > 50-EMA). The opposite of the Silver Cross is a "Dark Cross" -- those stocks are, at the very least, in a correction.
- Long-Term - the Golden Cross Index (GCI) shows the percentage of SPX stocks on LT Trend Model BUY signals (50-EMA > 200-EMA). The opposite of a Golden Cross is the "Death Cross" -- those stocks are in a bear market.
The market bias is BEARISH in the intermediate and long terms.
Participation remains in a declining trend and none of the readings are oversold. The Silver Cross Index is moving vertically lower as is the Golden Cross Index. Both are below their signal lines so the IT and LT Biases remain BEARISH. Participation readings are below those Indexes so they are likely to continue lower.
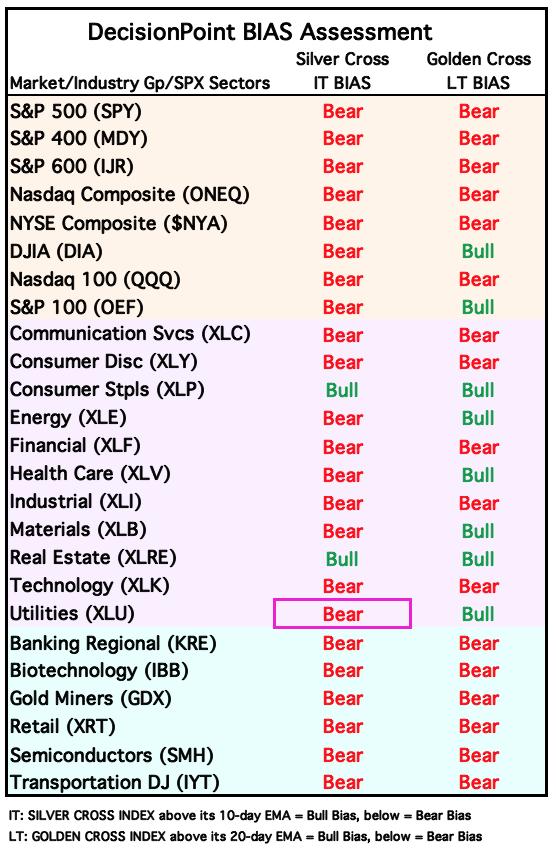
BIAS Assessment: The following table expresses the current BIAS of various price indexes based upon the relationship of the Silver Cross Index to its 10-day EMA (intermediate-term), and of the Golden Cross Index to its 20-day EMA (long-term). When the Index is above the EMA it is bullish, and it is bearish when the Index is below the EMA. The BIAS does not imply that any particular action should be taken. It is information to be used in the decision process.
The items with highlighted borders indicate that the BIAS changed today.
*****************************************************************************************************
CONCLUSION: We are currently looking at today's bounce as temporary. We did see an upside initiation climax so maybe we'll get some followthrough tomorrow. If participation were more healthy we could consider this the start of a new leg up, but it is weak and not oversold. The Bias Table above continues to log more "Bear" biases which is short-term bearish. We think that downside pressure will continued to be applied by tariffs and news in general. Technicals are a mixed with STOs rising and today's bullish climax compared to declining ITBM/ITVM and participation in declining trends. We suspect that choppy trading will continue.
Erin is 10% long, 0% short. (This is intended as information, not a recommendation.)
*****************************************************************************************************
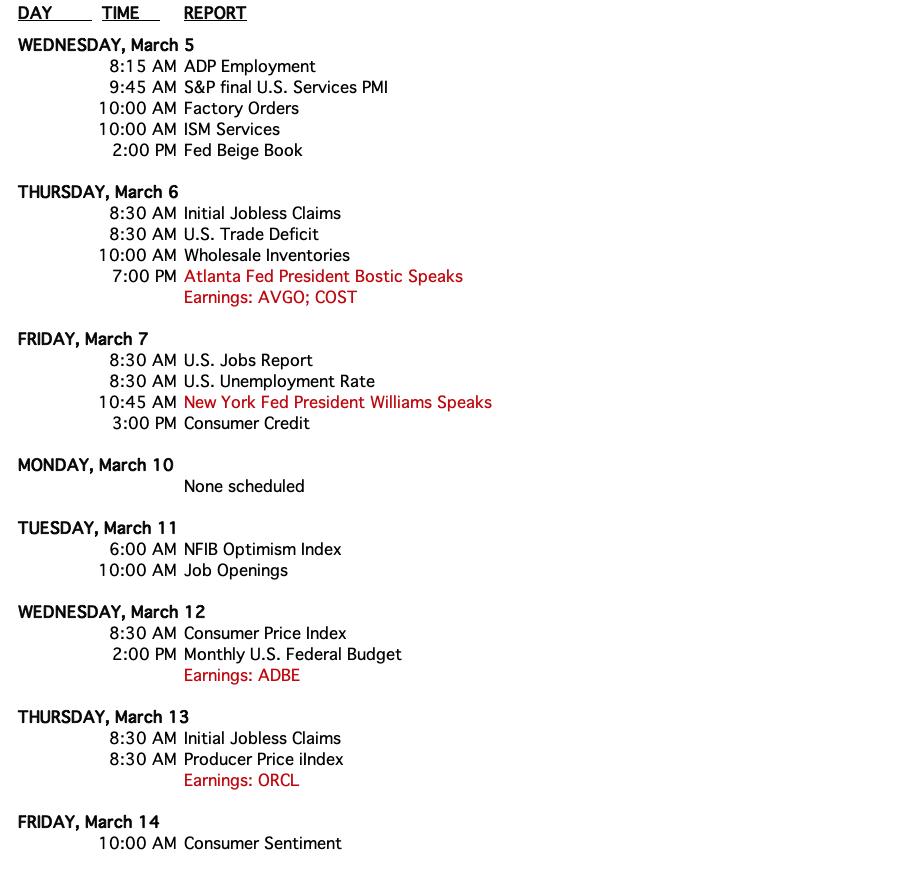
CALENDAR
Have you subscribed the DecisionPoint Diamonds yet? DP does the work for you by providing handpicked stocks/ETFs from exclusive DP scans! Add it with a discount! Contact support@decisionpoint.com for more information!
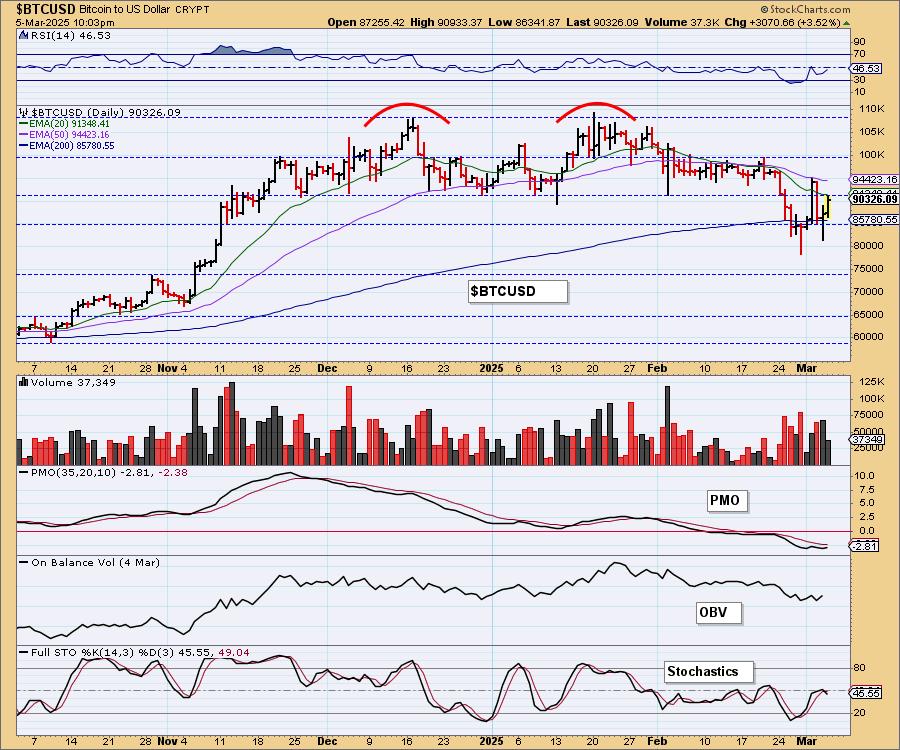
BITCOIN
Bitcoin wants to rally as it has made a nice upside reversal. This has gotten the PMO rising again, but this is tempered by the declining Stochastics. We expect 100,000 to hold as overhead resistance. Price hasn't been able to get above the 50-day EMA. We'll feel better about this rally if it can get back above it.
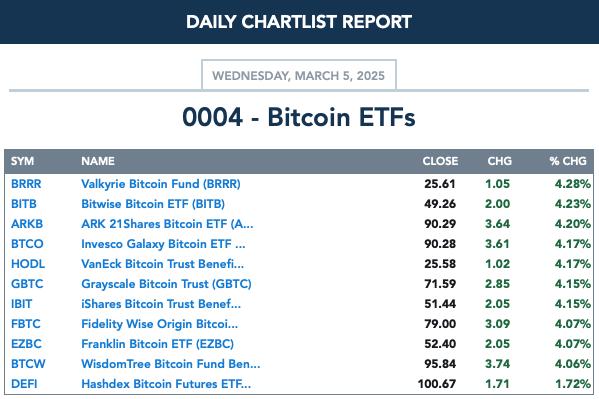
BITCOIN ETFs
INTEREST RATES
Yields continued to move higher today. This could be the start of a new uptrend in interest rates. Declining trends have yet to be broken so we'll stay cautiously optimistic.
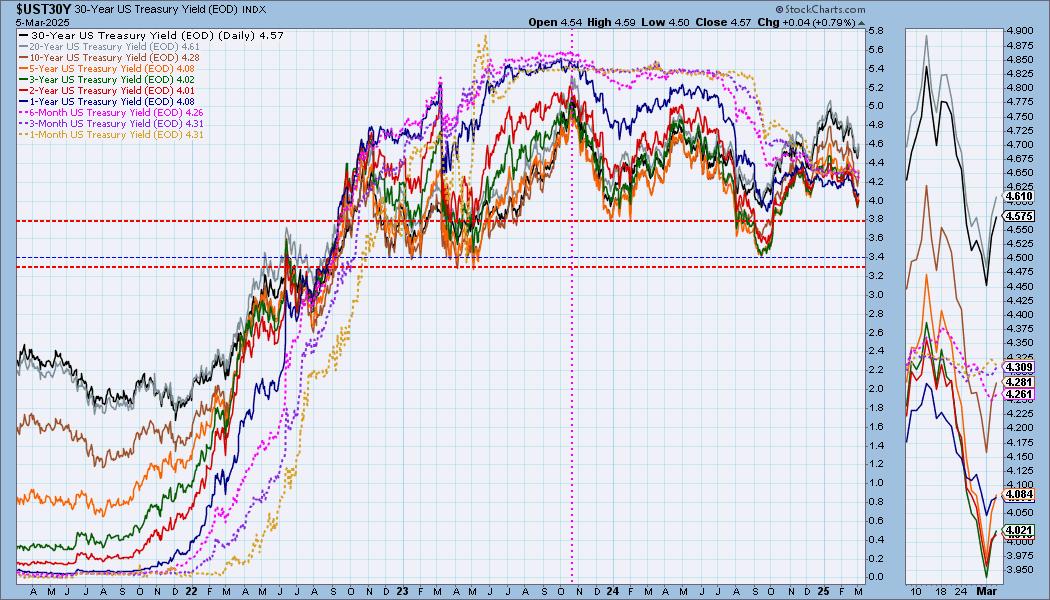
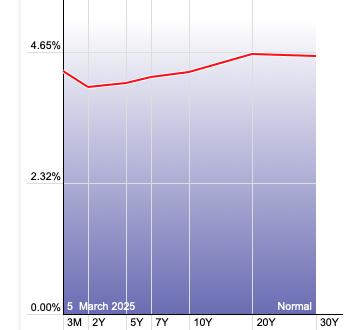
The Yield Curve Chart from StockCharts.com shows us the inversions taking place. The red line should move higher from left to right. Inversions are occurring where it moves downward.
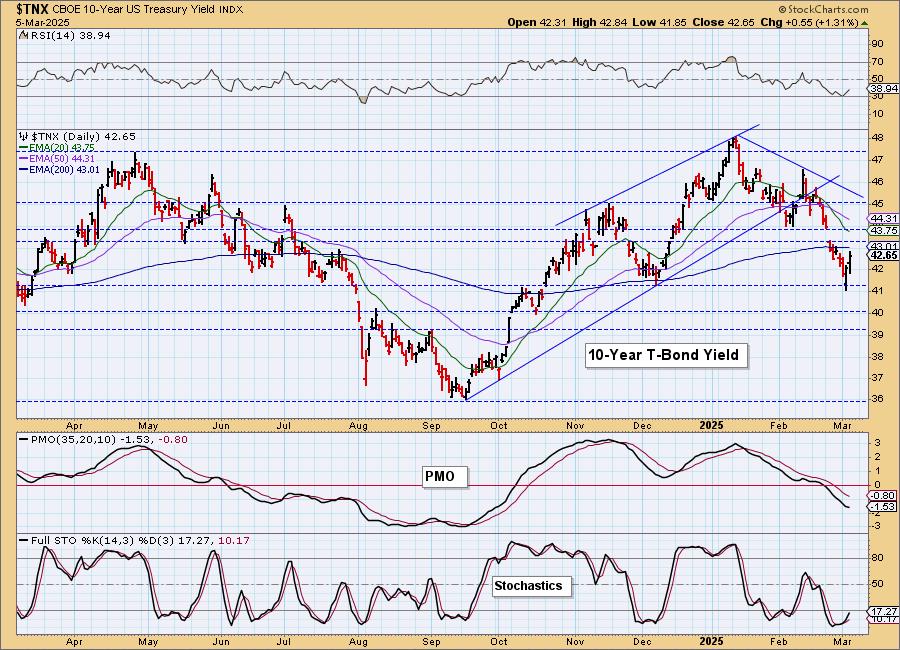
10-YEAR T-BOND YIELD
$TNX is bouncing off support at the December low. It now has to contend with a strong resistance zone at the previous gap. The PMO is still in decline but with Stochastics turning up, we think we could see this advance take hold.
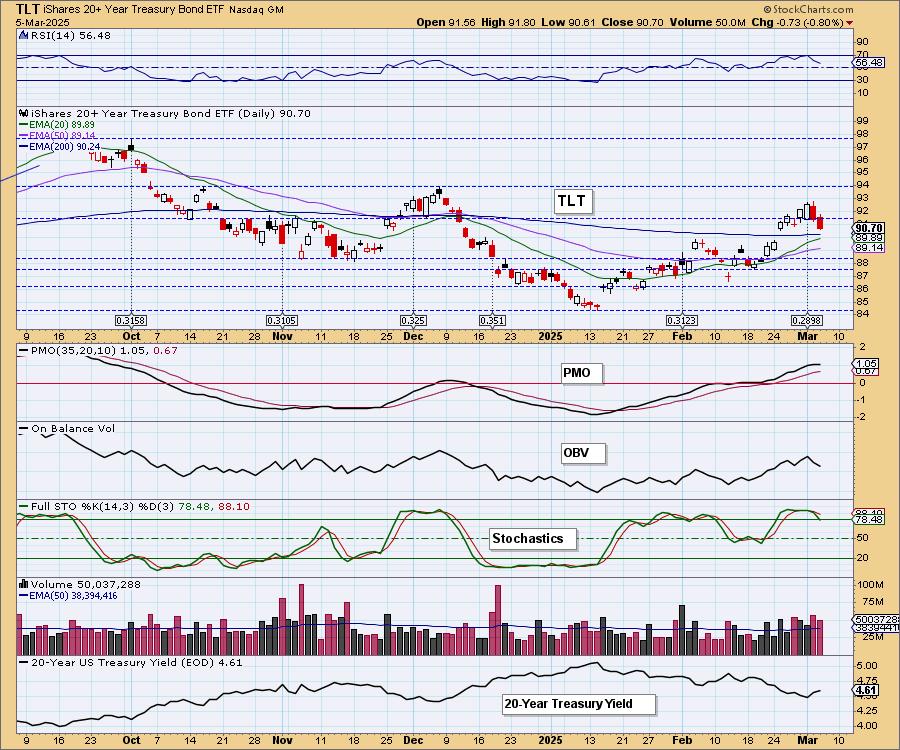
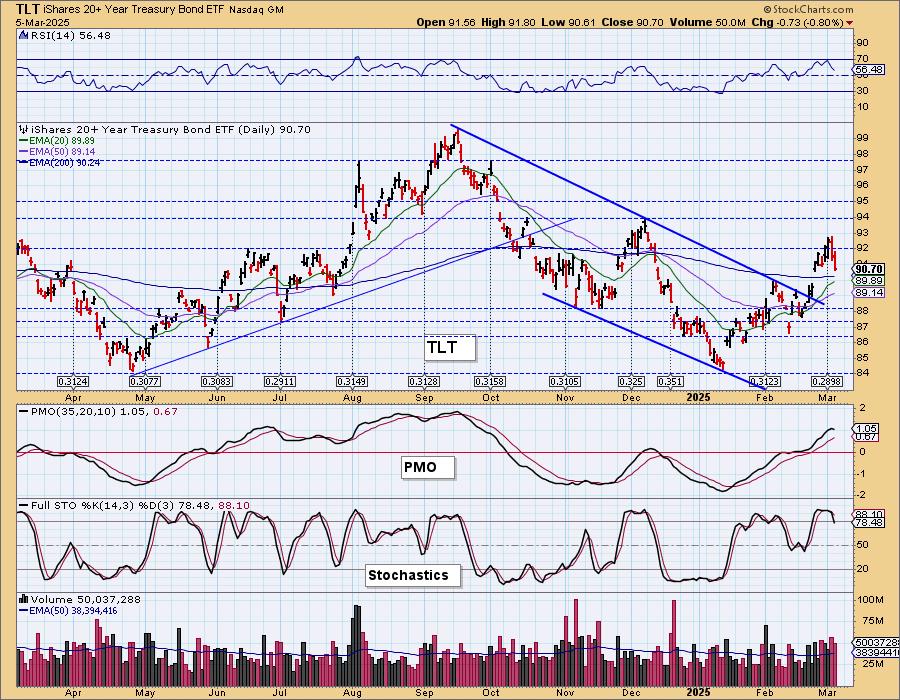
BONDS (TLT)
IT Trend Model: BUY as of 2/25/2025
LT Trend Model: SELL as of 12/13/2024
TLT Daily Chart: Bonds pulled back again and looking at interest rates, we think this may be the start of more decline. The PMO is topping and Stochastics dropped below 80.
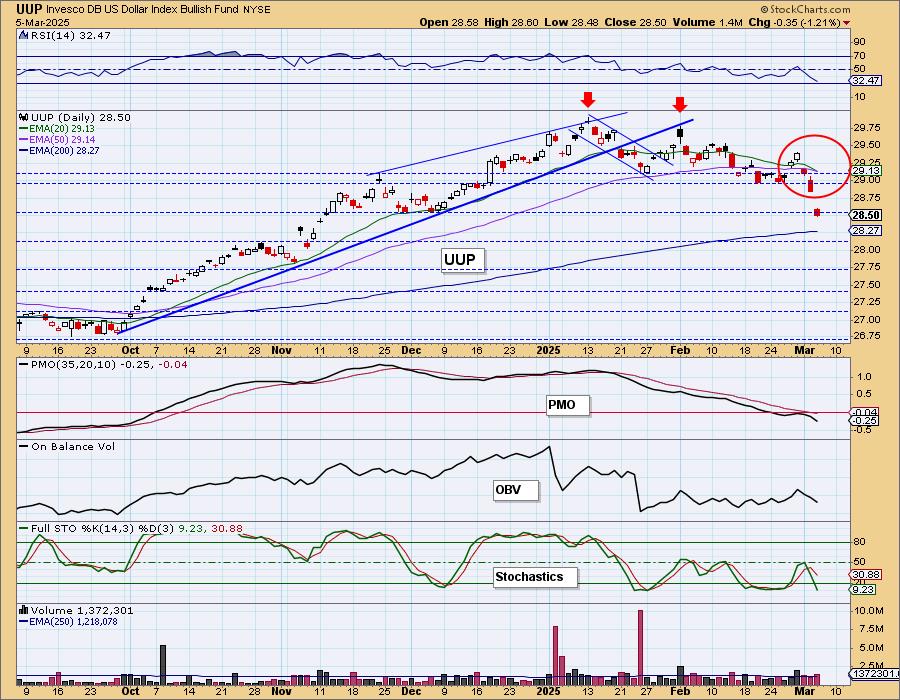
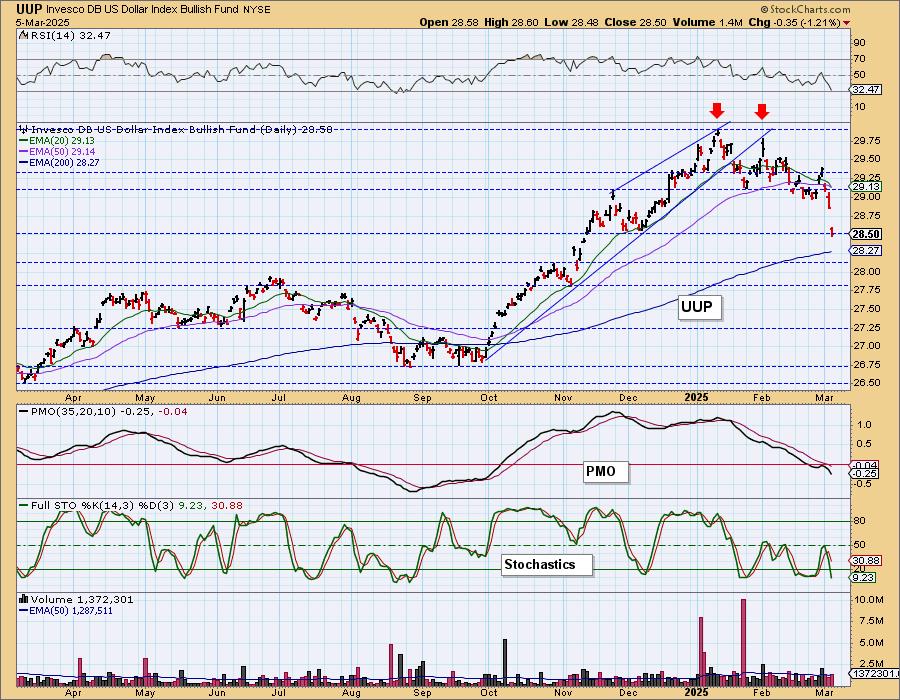
DOLLAR (UUP)
IT Trend Model: NEUTRAL as of 3/5/2025
LT Trend Model: BUY as of 5/25/2023
UUP Daily Chart: The Dollar dropped perilously. The downside target of the double top pattern would take it down to 28.20 or the 200-day EMA. Remember these are 'minimum' downside targets for these patterns. It could certainly move lower from there.
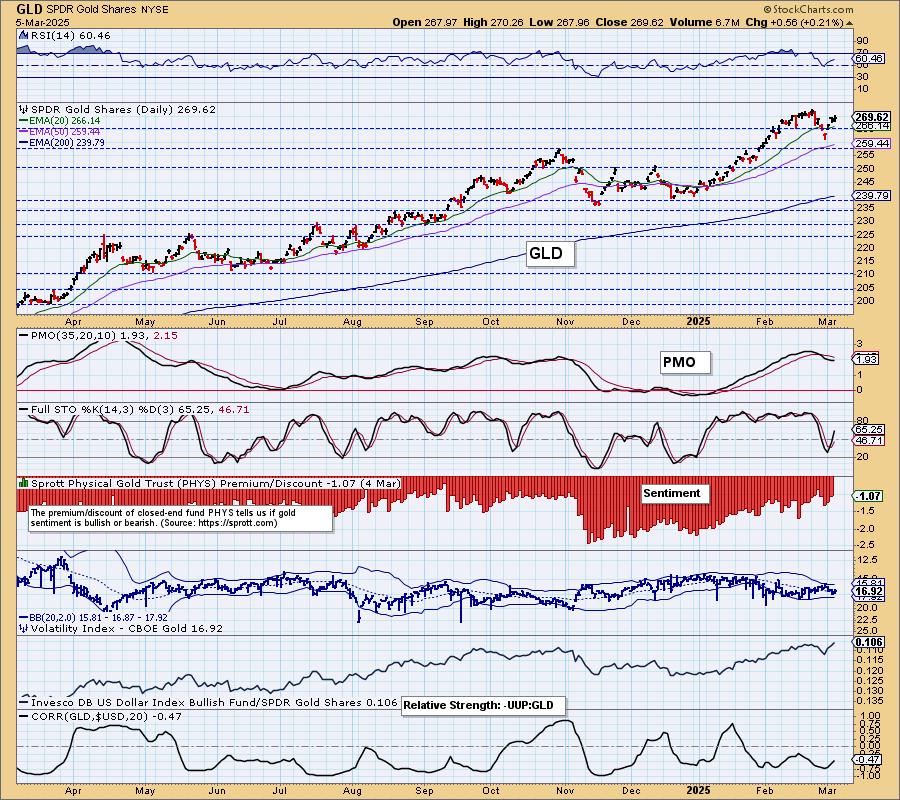
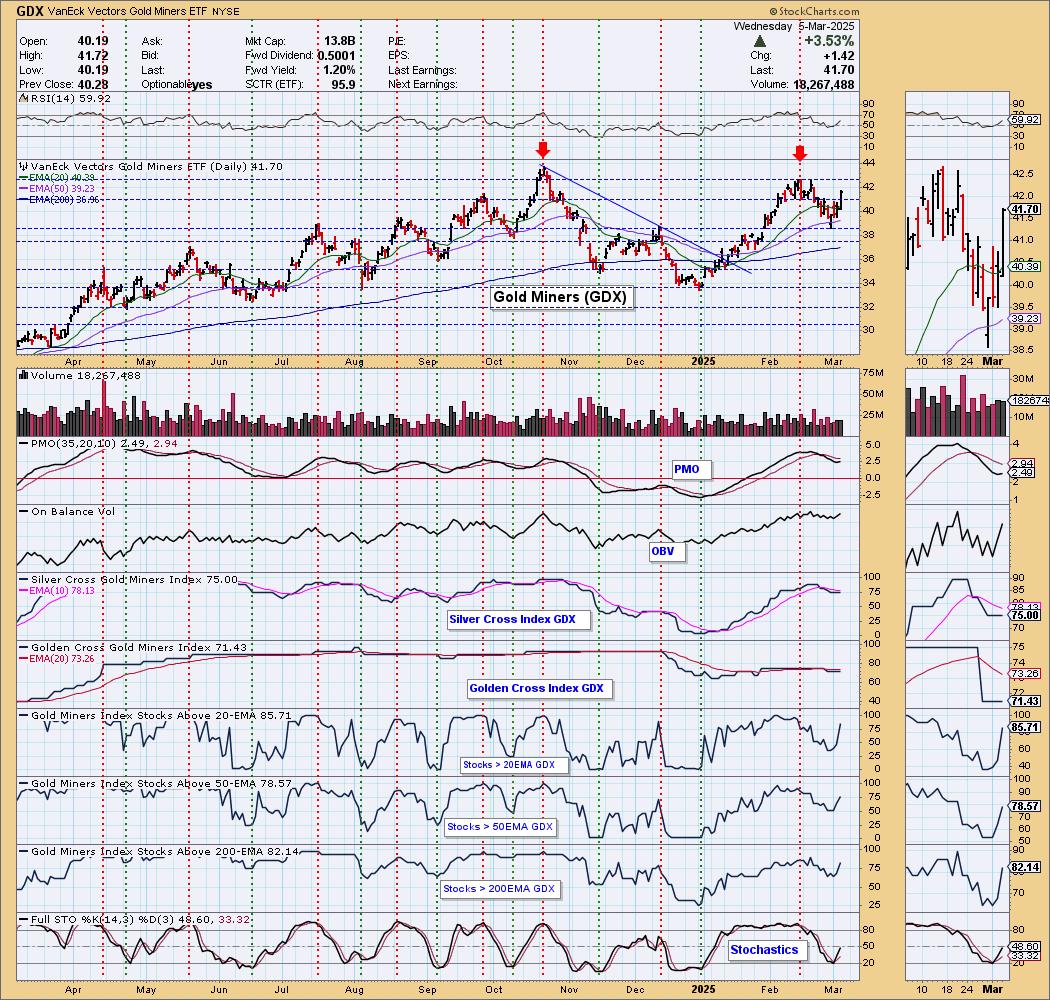
GOLD
IT Trend Model: BUY as of 1/10/2025
LT Trend Model: BUY as of 10/20/2023
GLD Daily Chart: Gold was higher on the day, but not as high as it should've been given the 1.21% decline in the Dollar. We see a declining PMO, but Stochastics are rising and with the Dollar clearly weak, Gold should continue to make its way higher to all-time highs.
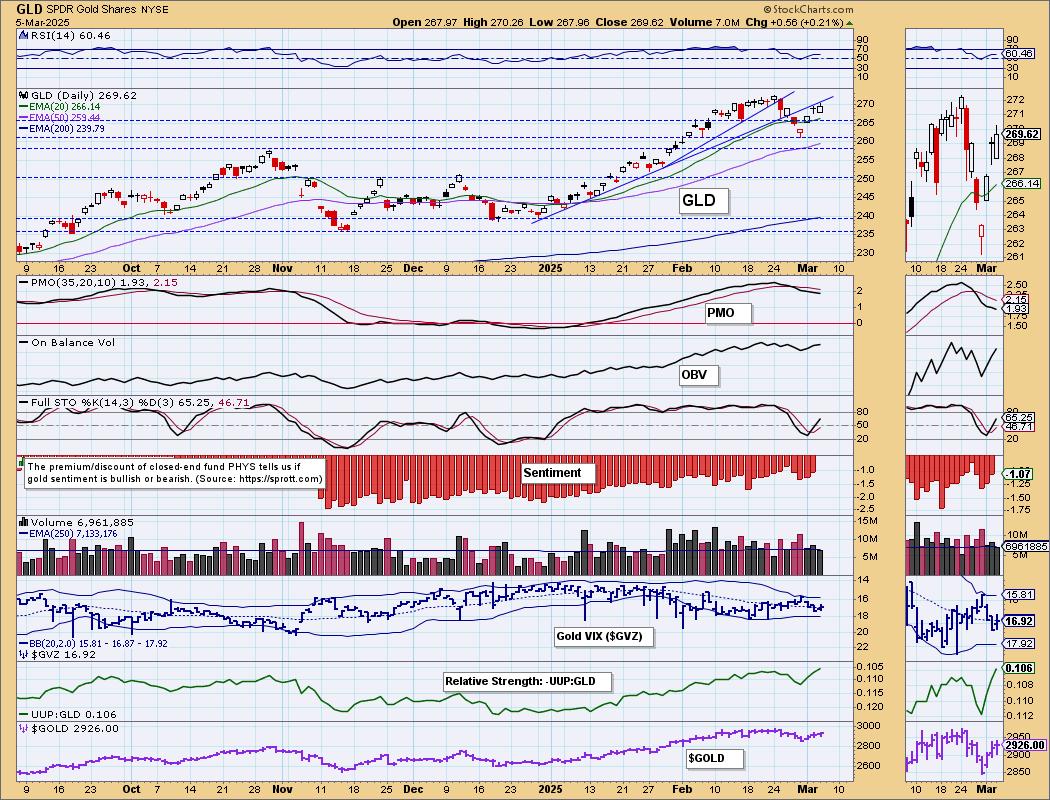
Discounts are in sentiment reversal territory. Investors are more bullish than they have been for awhile as determined by low discount readings. For now, we think it will work in Gold's favor, but if discounts get too low meaning investors get too bullish, then we would look for a downside reversal.
GOLD MINERS (GDX) Daily Chart: Gold Miners had a great day even though Gold was only modestly higher. The declining price trend has been broken and with the Dollar looking so bearish, GDX should have a good time of it. Participation has shot higher and the Silver Cross Index is trying to turn back up. The bearish double top is in jeopardy. Should price breakout above the tops, it would bust the pattern. That isn't out of the question given the current setup.
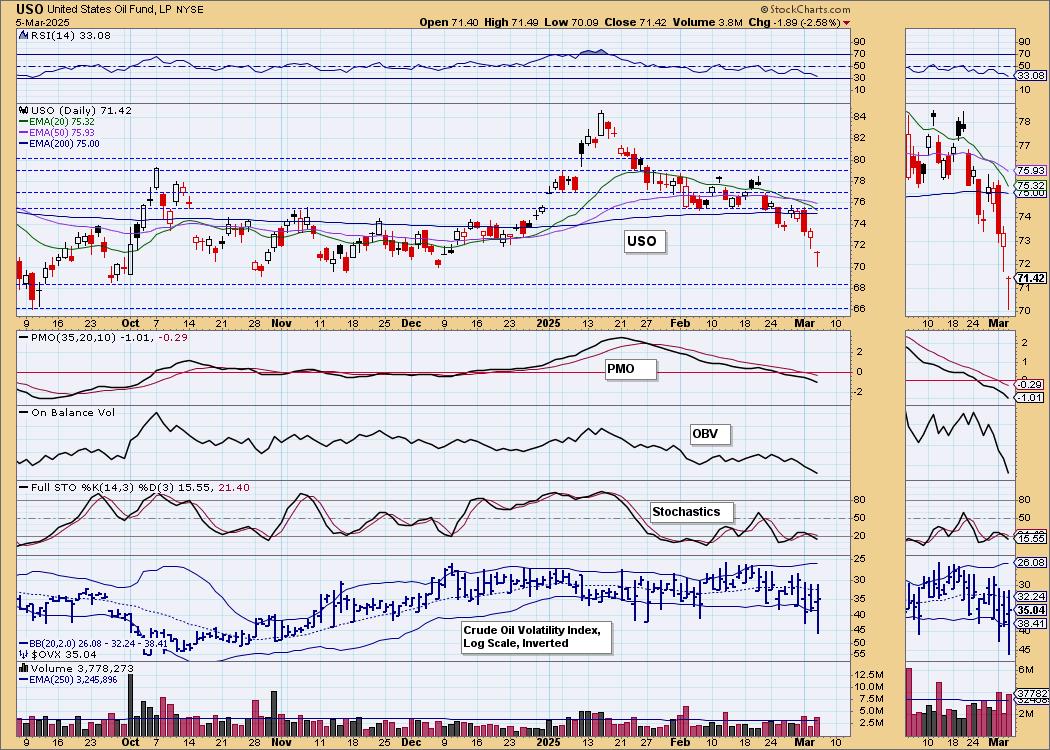
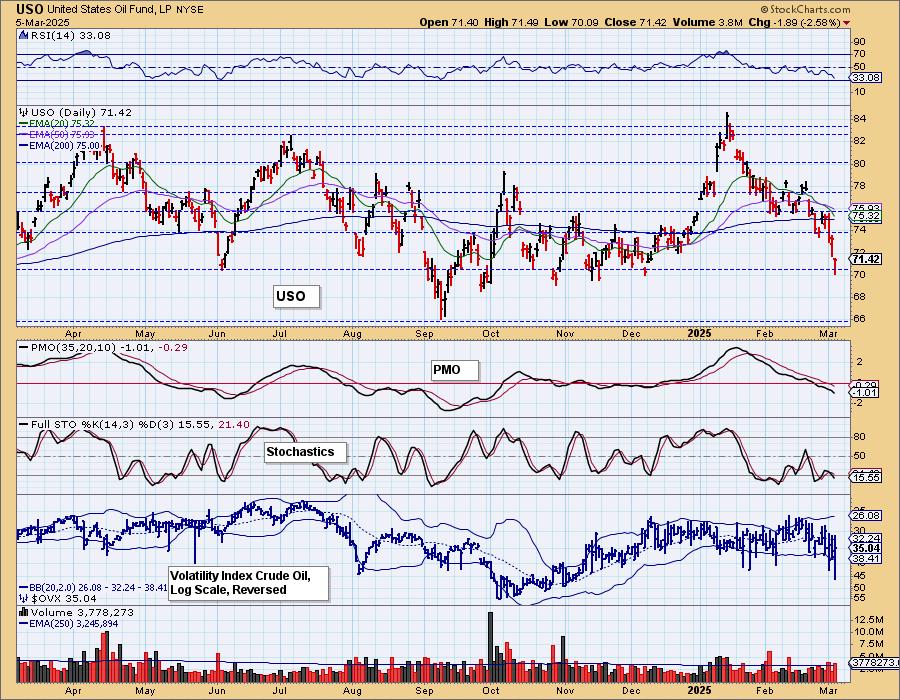
CRUDE OIL (USO)
IT Trend Model: BUY as of 12/24/2024
LT Trend Model: BUY as of 1/10/2025
USO Daily Chart: The decline continued for Crude today. We do have a long tail on today's candlestick and that is somewhat bullish. We saw something similar yesterday and it wasn't helpful. Fundamentals are not working in Crude's favor given the new administration's efforts to bring Oil prices down. We believe this will continue. We think support at 66 will be tested before too long.
Good Luck & Good Trading!
Erin Swenlin and Carl Swenlin
Technical Analysis is a windsock, not a crystal ball. --Carl Swenlin
(c) Copyright 2025 DecisionPoint.com
Disclaimer: This blog is for educational purposes only and should not be construed as financial advice. The ideas and strategies should never be used without first assessing your own personal and financial situation, or without consulting a financial professional. Any opinions expressed herein are solely those of the author, and do not in any way represent the views or opinions of any other person or entity.
DecisionPoint is not a registered investment advisor. Investment and trading decisions are solely your responsibility. DecisionPoint newsletters, blogs or website materials should NOT be interpreted as a recommendation or solicitation to buy or sell any security or to take any specific action.
NOTE: The signal status reported herein is based upon mechanical trading model signals, specifically, the DecisionPoint Trend Model. They define the implied bias of the price index based upon moving average relationships, but they do not necessarily call for a specific action. They are information flags that should prompt chart review. Further, they do not call for continuous buying or selling during the life of the signal. For example, a BUY signal will probably (but not necessarily) return the best results if action is taken soon after the signal is generated. Additional opportunities for buying may be found as price zigzags higher, but the trader must look for optimum entry points. Conversely, exit points to preserve gains (or minimize losses) may be evident before the model mechanically closes the signal.
Helpful DecisionPoint Links:
DecisionPoint Alert Chart List
DecisionPoint Golden Cross/Silver Cross Index Chart List
DecisionPoint Sector Chart List
Price Momentum Oscillator (PMO)