
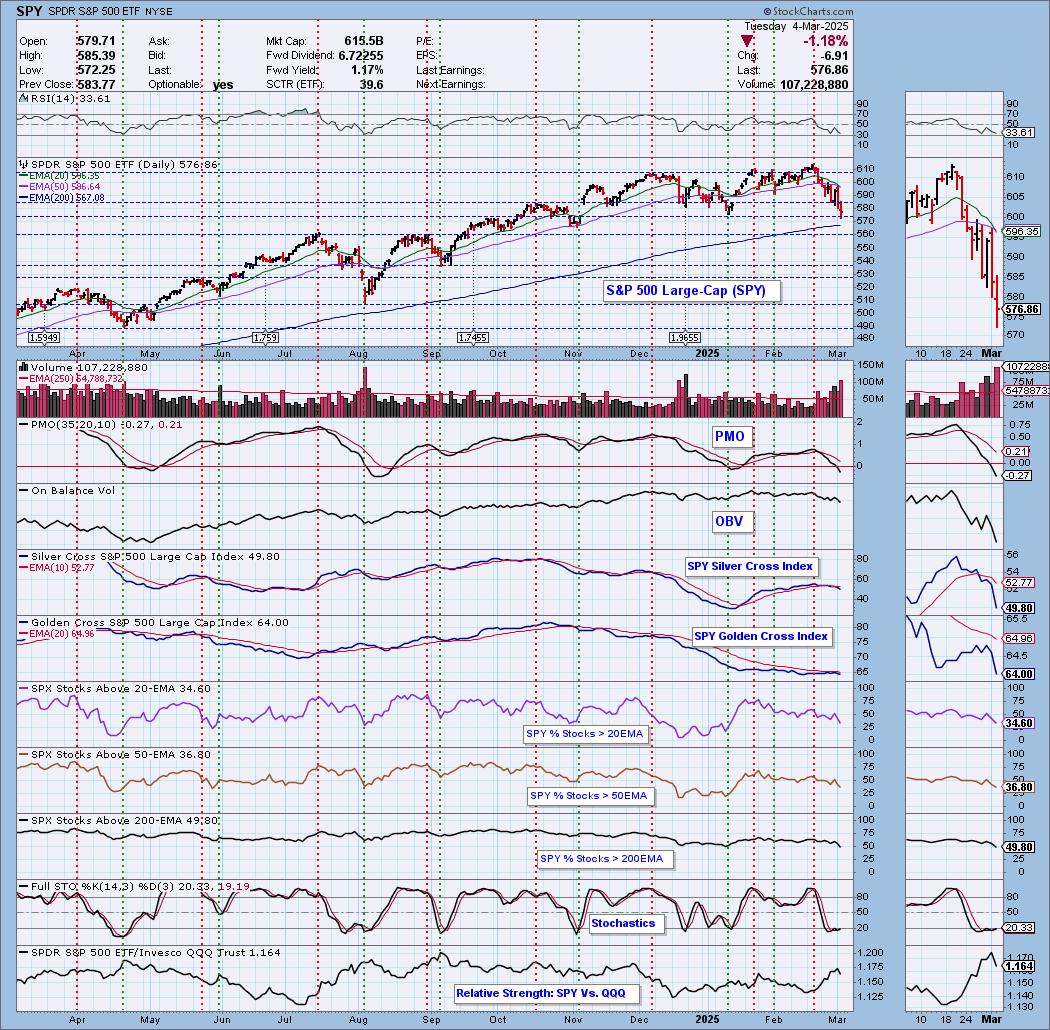
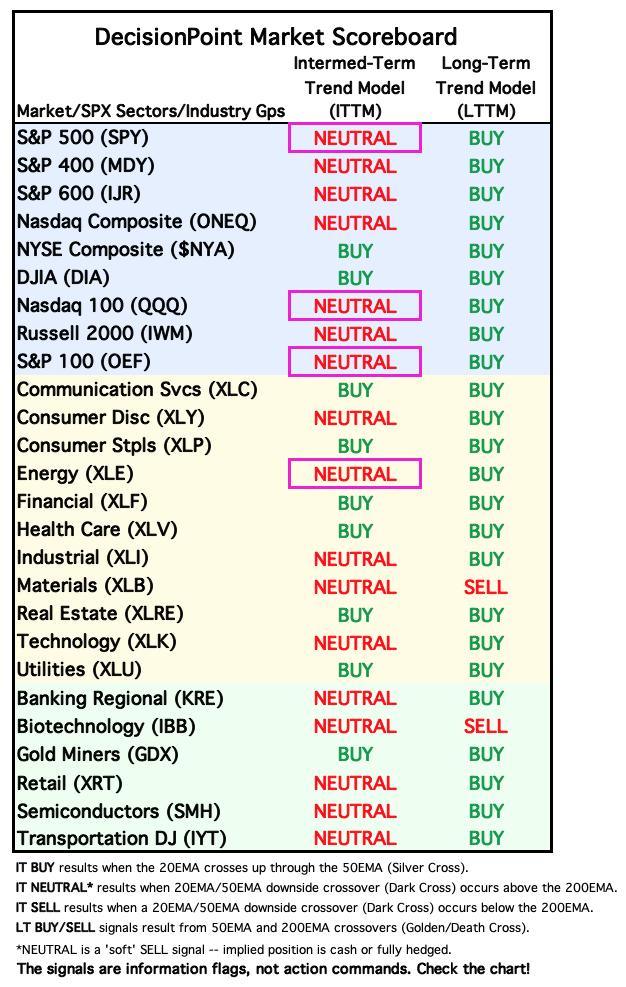
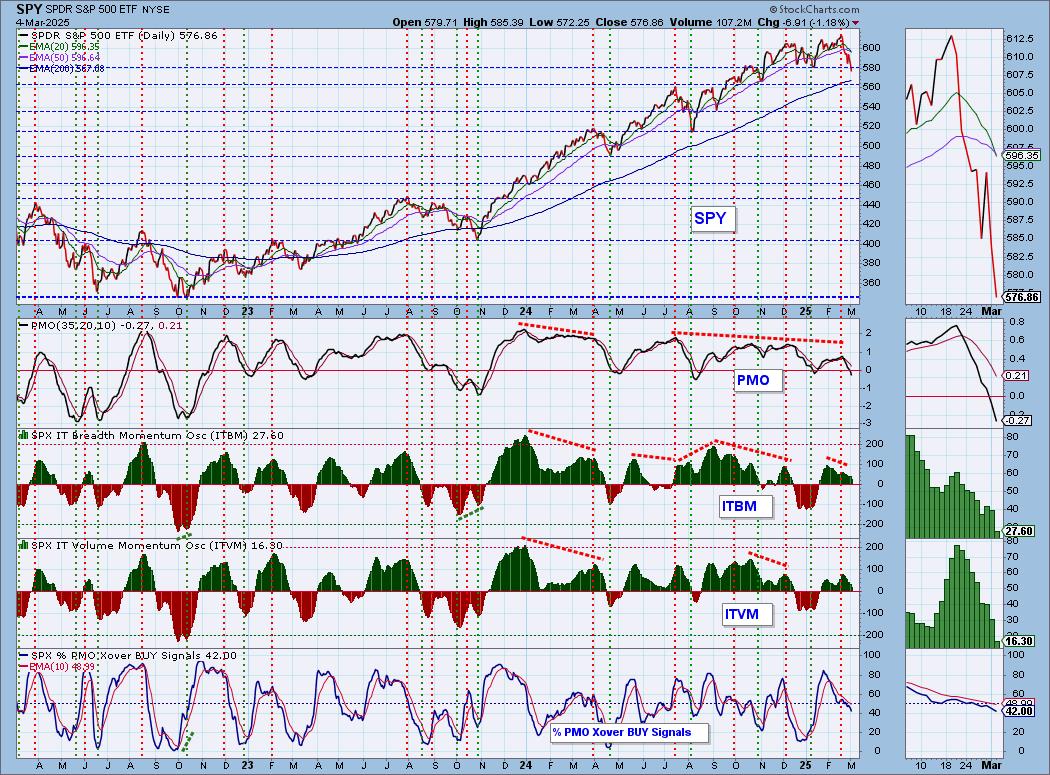
Today the S&P 500 Index ETF (SPY) 20-day EMA crossed down through the 50-day EMA (Dark Cross), above the 200-day EMA, generating an IT Trend Model NEUTRAL Signal. We'll discuss this more throughout the report.
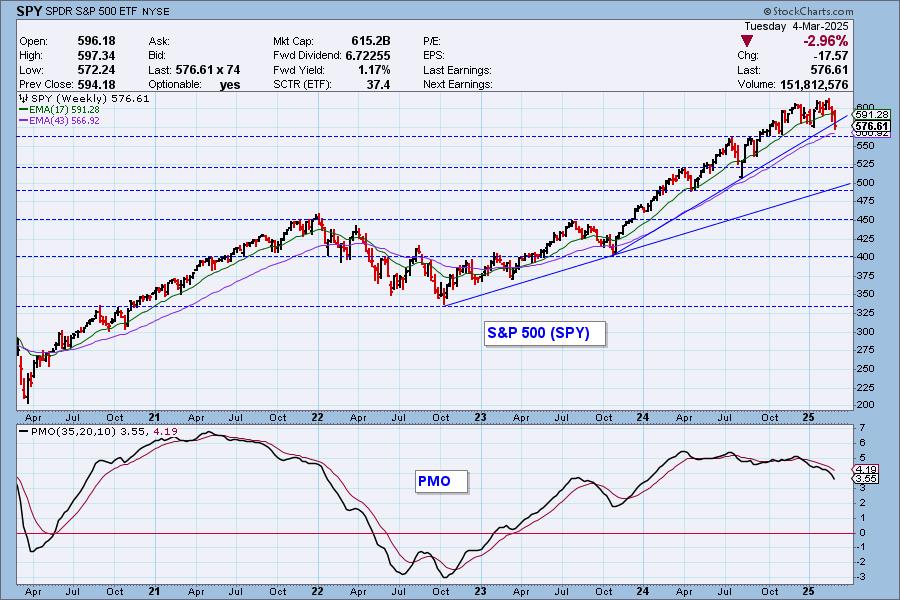
The weekly chart shows SPY violating the rising trend line support. We also spy a bearish double top leading into this breakdown. The weekly PMO is very negative.
__________
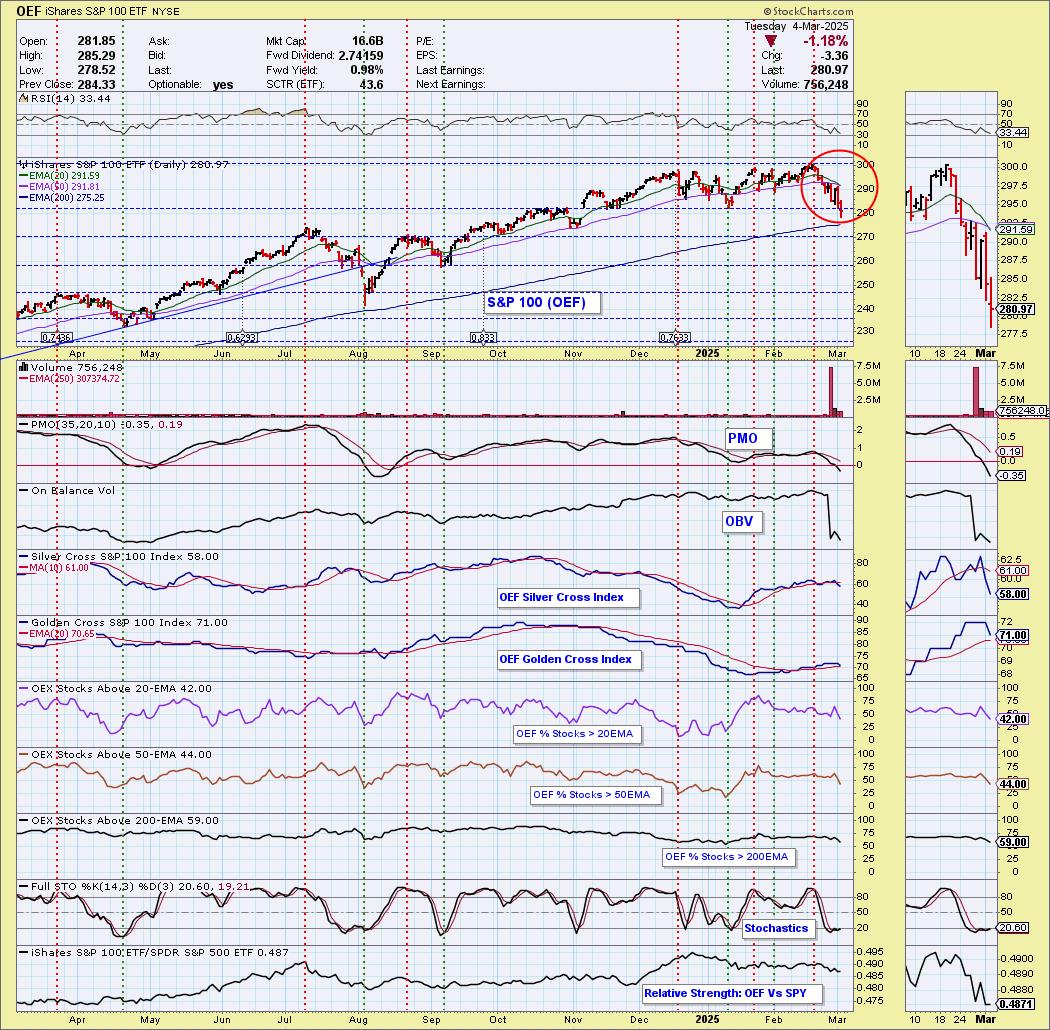
Also today, the S&P 100 Index ETF (OEF) 20-day EMA crossed down through the 50-day EMA (Dark Cross), above the 200-day EMA, generating an IT Trend Model NEUTRAL Signal. A significant support level was broken today. The PMO is traveling lower as are the Silver/Golden Cross Indexes. Participation is weak but not as weak as it could be. Stochastics are trying to turn back up so maybe we'll see a snapback.
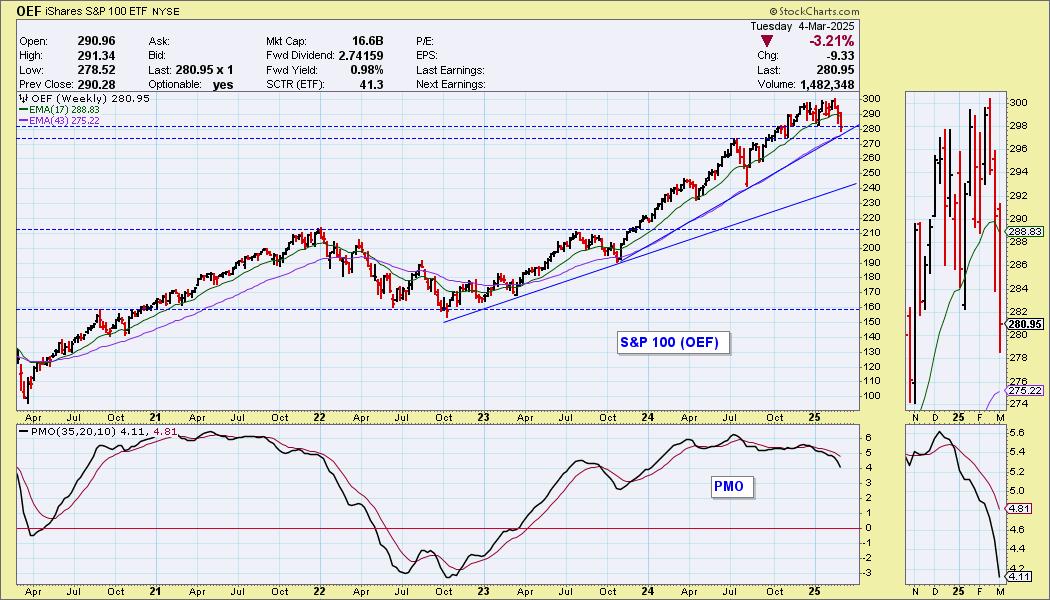
The weekly chart OEF having violated horizontal support and approaching combined rising trend line and horizontal support. The weekly PMO is very negative as it accelerates lower.
__________
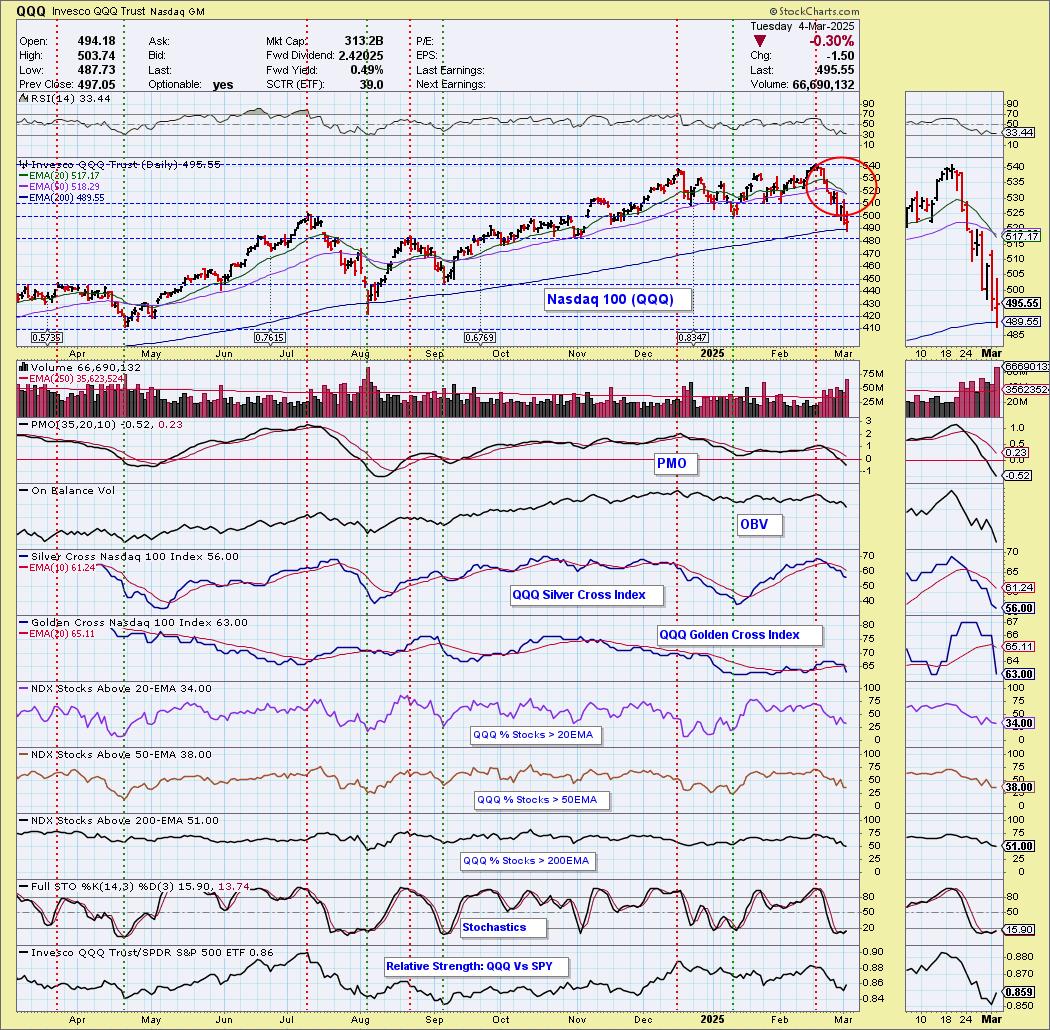
Also today, the Nasdaq 100 Index ETF (QQQ) 20-day EMA crossed down through the 50-day EMA (Dark Cross), above the 200-day EMA, generating an IT Trend Model NEUTRAL Signal. QQQ lost significant support but it is now on the 200-day EMA which could support a reversal. The Silver/Golden Cross Indexes look particularly weak and we have very weak participation although not oversold yet. Stochastics did turn up, but remain below 20 indicating internal weakness.
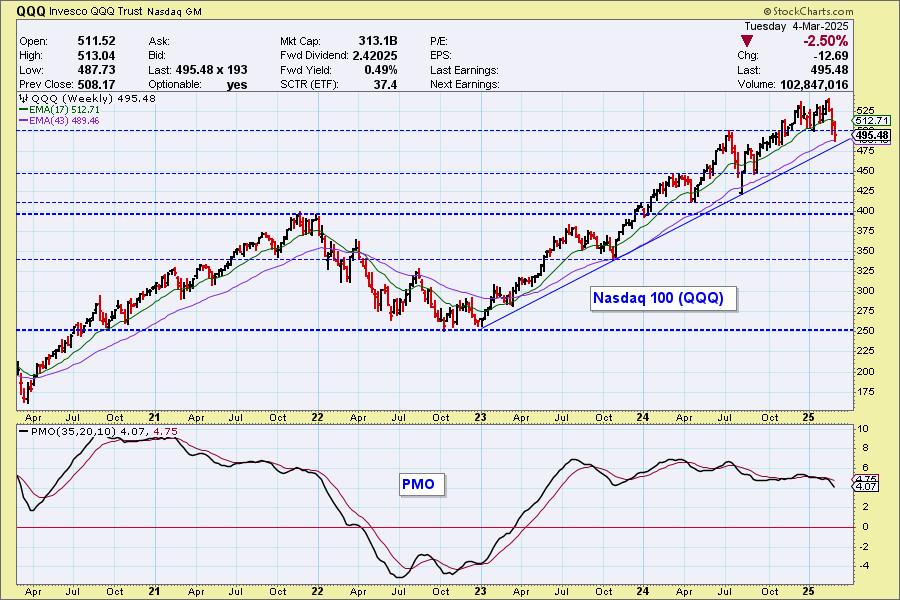
The weekly chart shows QQQ having violated horizontal support, and it is approaching rising trend line support. The weekly PMO is accelerating lower so this rising trend is very vulnerable.
__________
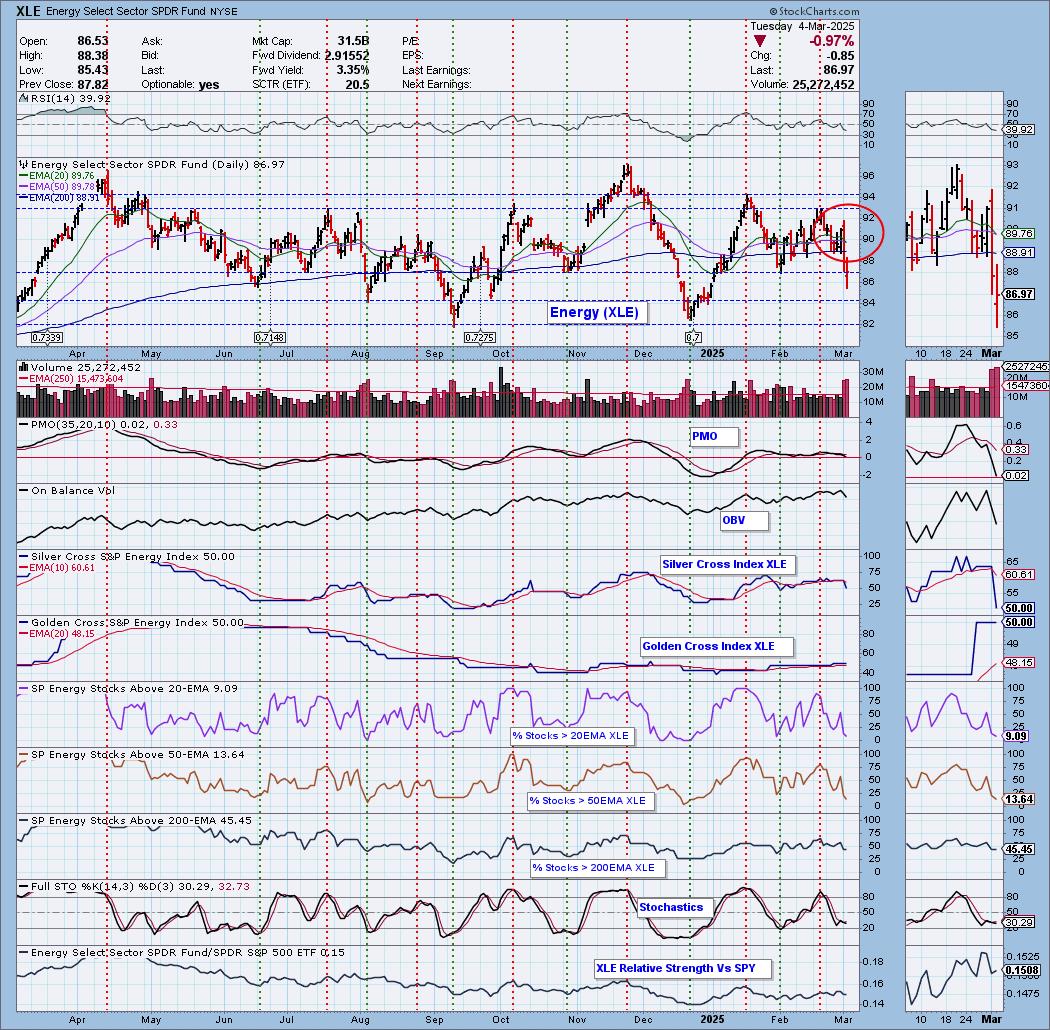
Finally, the Energy Sector ETF (XLE) 20-day EMA crossed down through the 50-day EMA (Dark Cross), above the 200-day EMA, generating an IT Trend Model NEUTRAL Signal. Significant support was lost today, but it did manage to close on it rather than below. Still, the PMO is tumbling lower and we have very weak support. The Silver Cross Index is dropping heavily. Participation is very weak, but it is close to oversold levels. We would look for more downside.
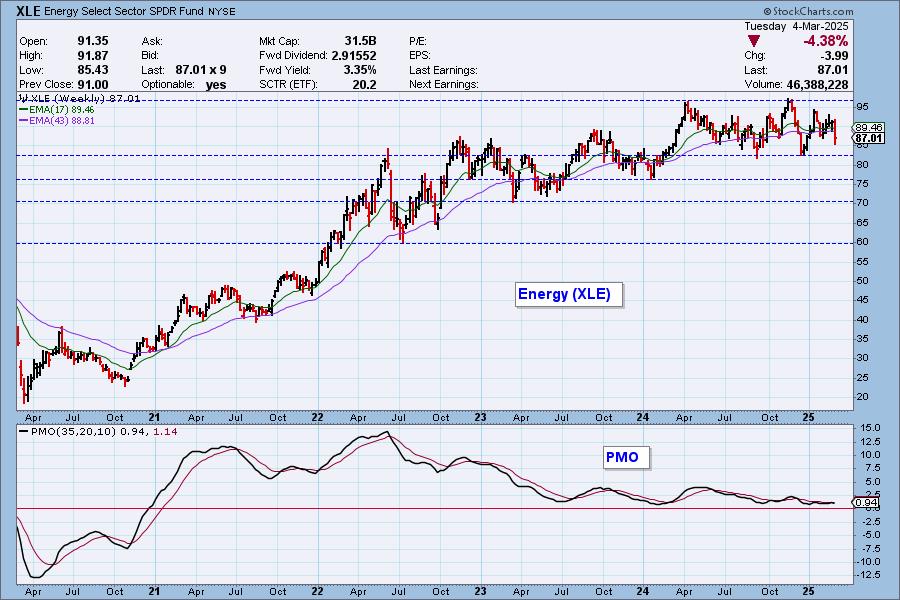
On the weekly chart we can see that XLE has been consolidating for about a year. The weekly PMO is flat and neutral. We would look for a test of support.
The DecisionPoint Alert Weekly Wrap presents an end-of-week assessment of the trend and condition of the Stock Market, the U.S. Dollar, Gold, Crude Oil, and Bonds. The DecisionPoint Alert daily report (Monday through Thursday) is abbreviated and gives updates on the Weekly Wrap assessments.
Watch the latest episode of DecisionPoint on our YouTube channel here!
MARKET/INDUSTRY GROUP/SECTOR INDEXES
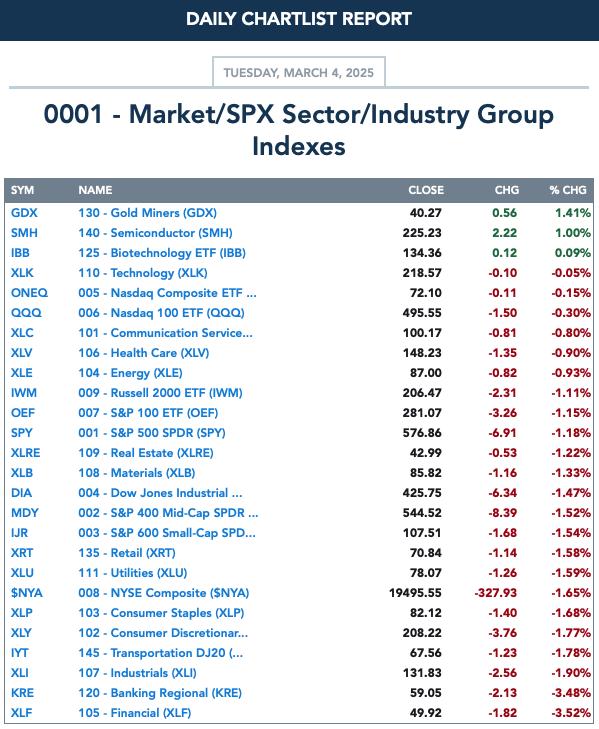
CLICK HERE for Carl's annotated Market Index, Sector, and Industry Group charts.
THE MARKET (S&P 500)
IT Trend Model: NEUTRAL as of 3/4/2025
LT Trend Model: BUY as of 3/29/2023
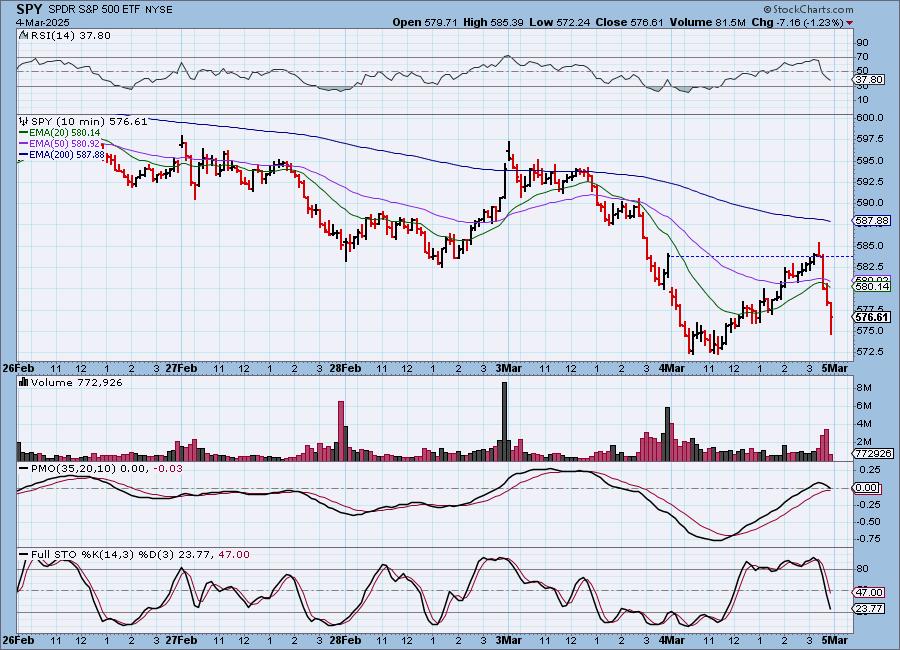
SPY 10-Minute Chart: The market opened lower but spent the day retracing those losses. The final 40 minutes of trading saw a significant decline. It could be attributed to retaliatory tariffs by China and Canada, with a vow from Mexico that it will also add tariffs.
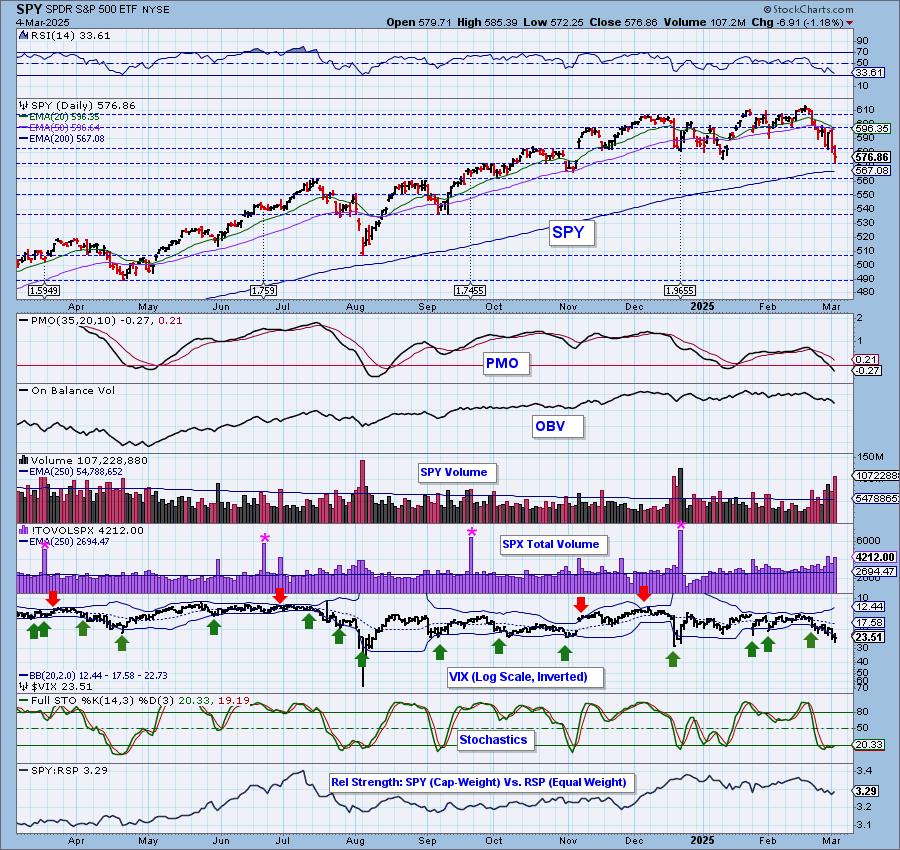
SPY Daily Chart: Support at the January low is being tested. Price did close above it so we could see a small rebound. If not the 200-day EMA is there to possibly save the day. The PMO continues to travel lower below the zero line.
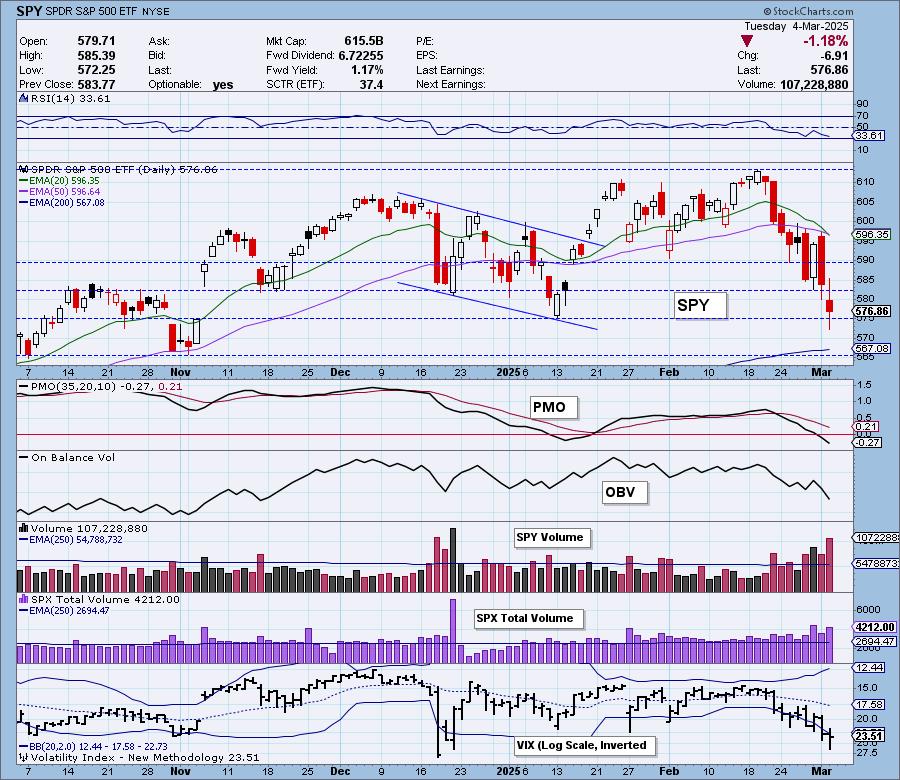
We saw yet another penetration of the lower Bollinger Band for the VIX on the inverted scale as volatility increases with investor's fears being stoked by the decline. Stochastics did rise somewhat, but still remain very weak overall. Mega-caps are still seeing a decline in relative strength v. equal-weight RSP. Their weakness does not help an already weak market.

Here is the latest recording from 3/3. Click HERE to get to our video list.:
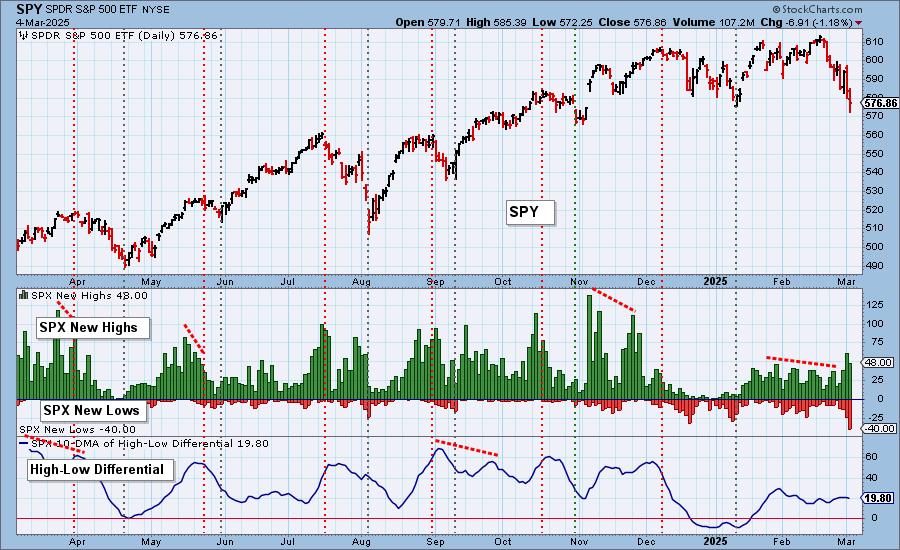
S&P 500 New 52-Week Highs/Lows: There are still some winners out there given the amount of New Highs, but conversely we now see more weakness as New Lows expanded greatly. The High-Low Differential has topped.
Climax* Analysis: Today there were three climax readings among the four relevant indicators, which gives us a downside exhaustion climax. SPX Total Volume expanded and was 156% of the one-year daily average, which is in the neighborhood of blowout volume, which means that today could be a a short-term bottom. We may see a bounce or some churn, but we think there is more downside ahead.
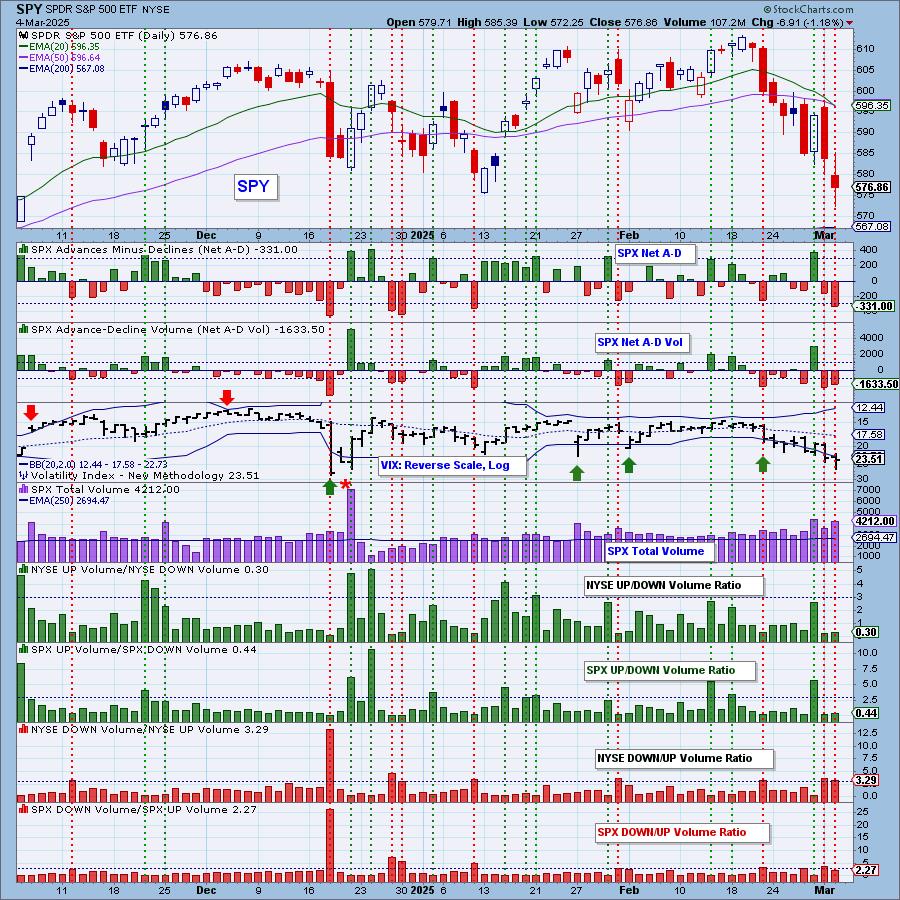
*A climax is a one-day event when market action generates very high readings in, primarily, breadth and volume indicators. We also include the VIX, watching for it to penetrate outside the Bollinger Band envelope. The vertical dotted lines mark climax days -- red for downside climaxes, and green for upside. Climaxes are at their core exhaustion events; however, at price pivots they may be initiating a change of trend.
Short-Term Market Indicators: The short-term market trend is DOWN and the condition is NEUTRAL.
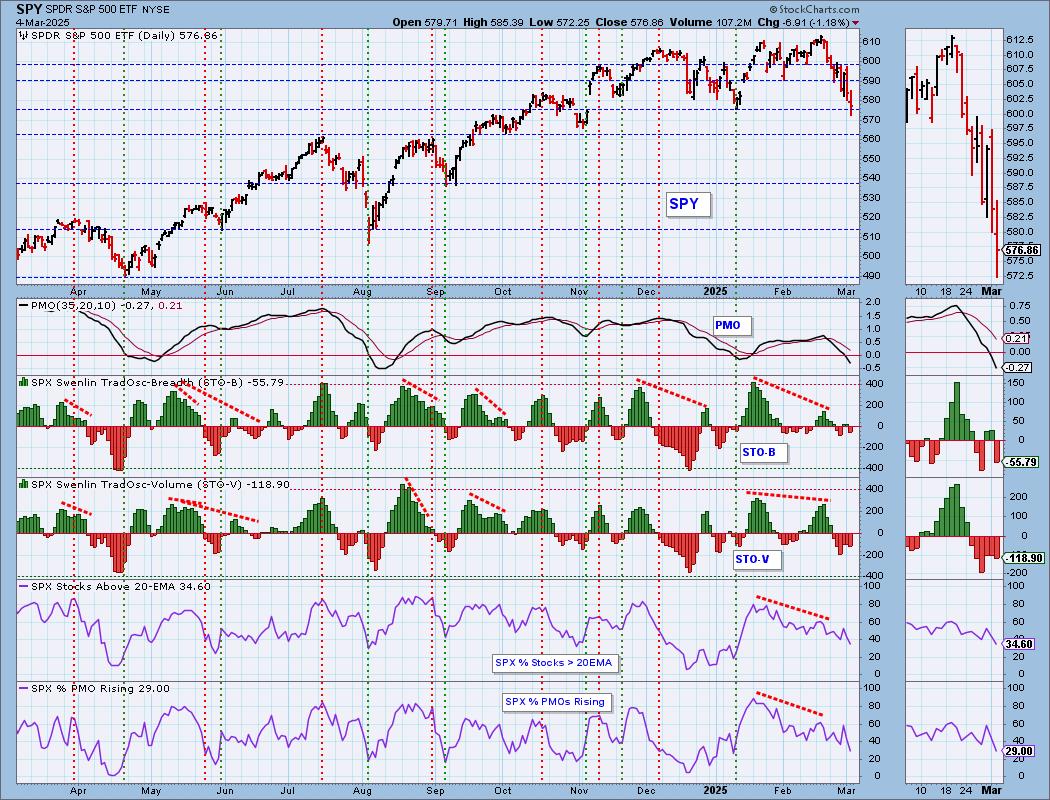
The Swenlin Trading Oscillators (STOs) are getting near-term oversold, but they have much further to fall based on December's readings. Participation continues to thin. We lost a great deal of rising PMOs, but that indicator still isn't oversold.
Intermediate-Term Market Indicators: The intermediate-term market trend is UP and the condition is NEUTRAL.
The ITBM and ITVM dropped heavily today confirming an already weak market and declining STOs. More PMO BUY Signals were lost on the decline.
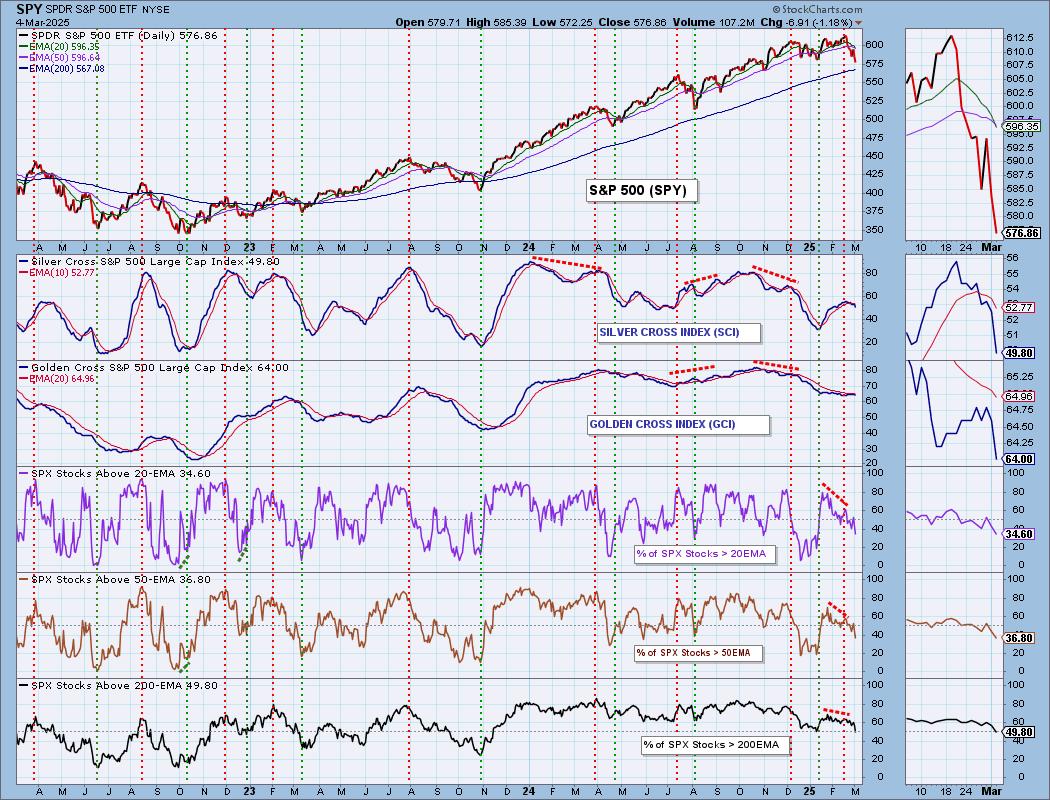
PARTICIPATION CHART (S&P 500): The following chart objectively shows the depth and trend of participation for the SPX in two time frames.
- Intermediate-Term - the Silver Cross Index (SCI) shows the percentage of SPX stocks on IT Trend Model BUY signals (20-EMA > 50-EMA). The opposite of the Silver Cross is a "Dark Cross" -- those stocks are, at the very least, in a correction.
- Long-Term - the Golden Cross Index (GCI) shows the percentage of SPX stocks on LT Trend Model BUY signals (50-EMA > 200-EMA). The opposite of a Golden Cross is the "Death Cross" -- those stocks are in a bear market.
The market bias is BEARISH in the intermediate and long terms.
The negative divergences on participation played out as expected with this decline. Readings are low but are not at all oversold. The Silver Cross Index and Golden Cross Index are beginning to accelerate lower. Both are below their signal lines so the IT and LT Bias are BEARISH.
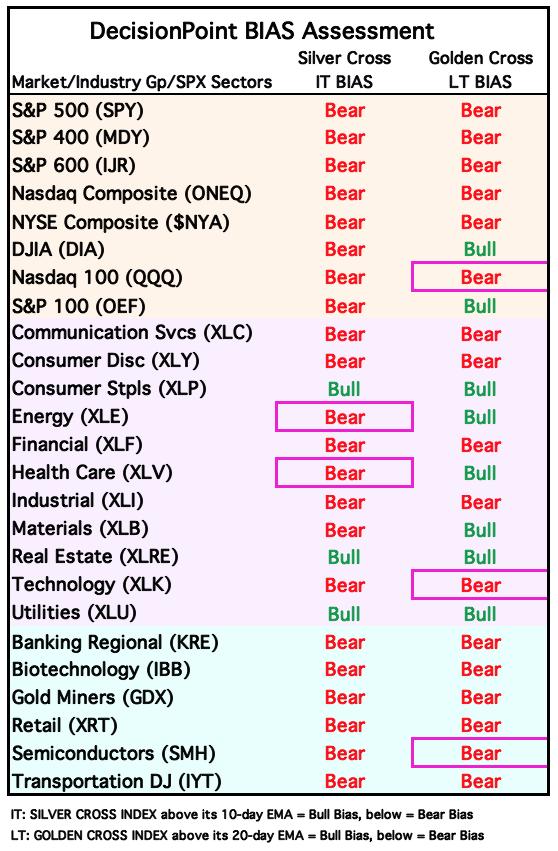
BIAS Assessment: The following table expresses the current BIAS of various price indexes based upon the relationship of the Silver Cross Index to its 10-day EMA (intermediate-term), and of the Golden Cross Index to its 20-day EMA (long-term). When the Index is above the EMA it is bullish, and it is bearish when the Index is below the EMA. The BIAS does not imply that any particular action should be taken. It is information to be used in the decision process.
The items with highlighted borders indicate that the BIAS changed today.
*****************************************************************************************************
CONCLUSION: A trade war is upon us and the market doesn't like it one bit as it dropped perilously to end trading today on news of retaliatory tariffs. Our indicators were already configured negatively with STOs and the ITBM/ITVM in decline. Now the High-Low Differential has topped and we note that participation while weak is not oversold. All of this will apply downside pressure. However, we did see a downside exhaustion climax which could mean a snapback. Overall the market is very weak and with tariffs as a backdrop, we are likely to see churn if nothing else. We would look at any rally as "dead cat" bounce material. With the rising trend on the weekly chart being broken, the market is likely to continue to trend lower.
Erin is 10% long, 0% short. (This is intended as information, not a recommendation.)
*****************************************************************************************************
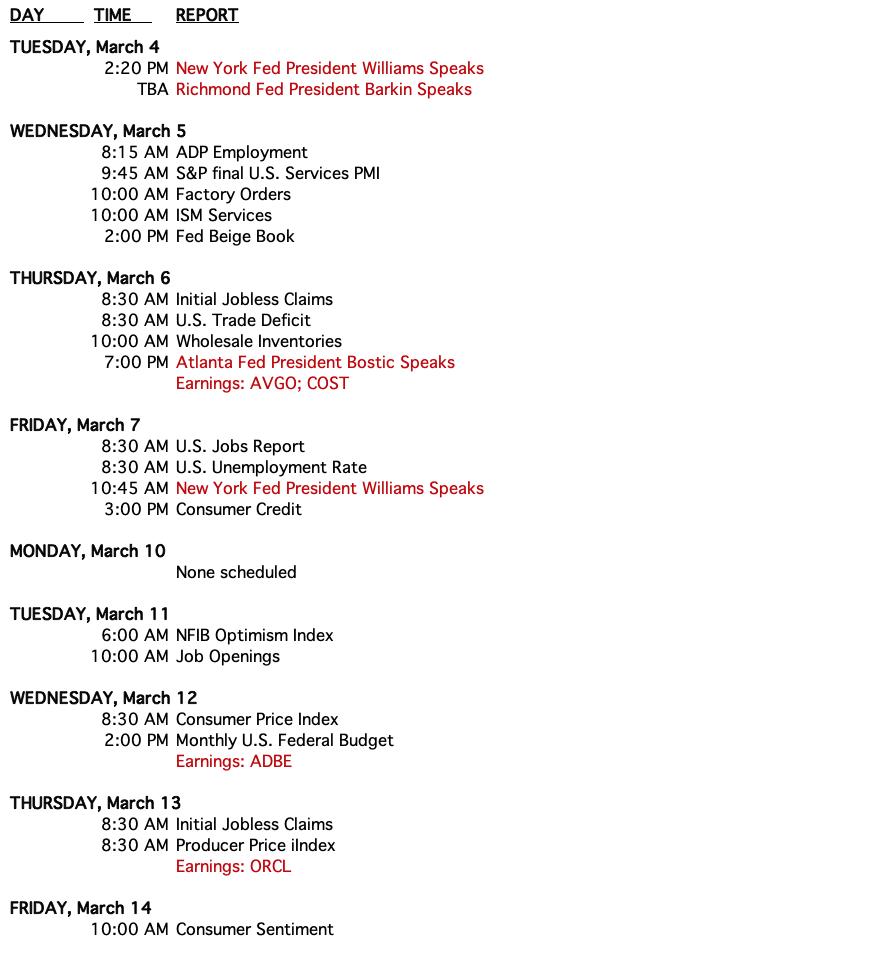
CALENDAR
Have you subscribed the DecisionPoint Diamonds yet? DP does the work for you by providing handpicked stocks/ETFs from exclusive DP scans! Add it with a discount! Contact support@decisionpoint.com for more information!
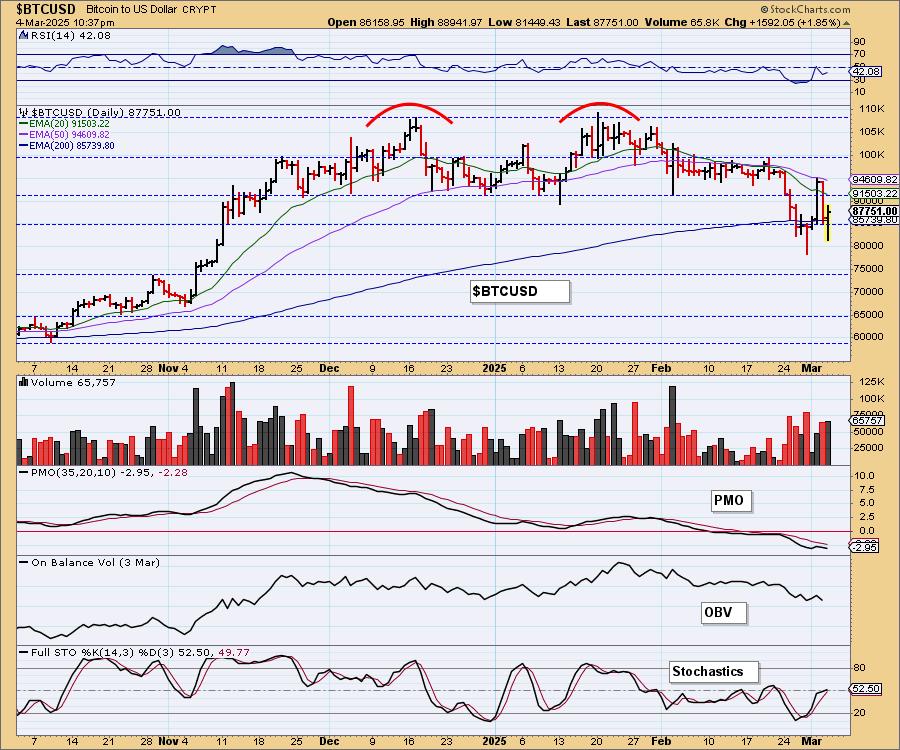
BITCOIN
Bitcoin is so far avoiding a drop to the minimum downside target of the bearish double top. The target is 75,000. Today saw a nice rally that brought price back above the 200-day EMA. We still don't like the configuration of the PMO with its top beneath the signal line, but Stochastics are rising again and made it to positive territory so maybe we'll see a little more upside from here.
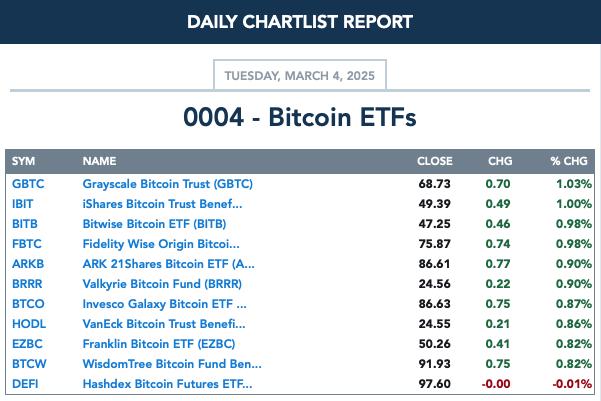
BITCOIN ETFs
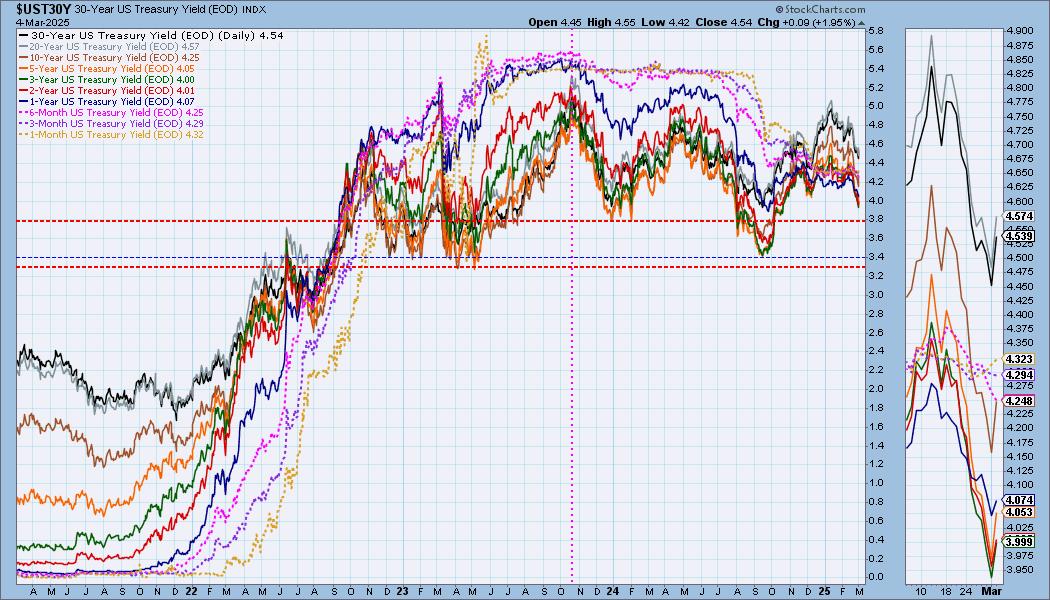
INTEREST RATES
Yields reversed higher today. They were due for a bounce and that's what we got. The declining trends are still there so we think this is temporary. We're looking for support levels to be tested soon.
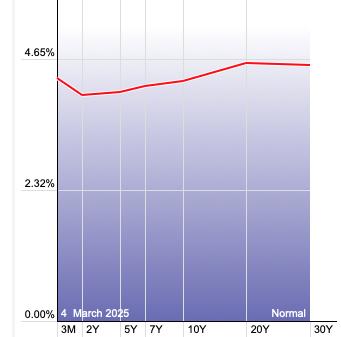
The Yield Curve Chart from StockCharts.com shows us the inversions taking place. The red line should move higher from left to right. Inversions are occurring where it moves downward.
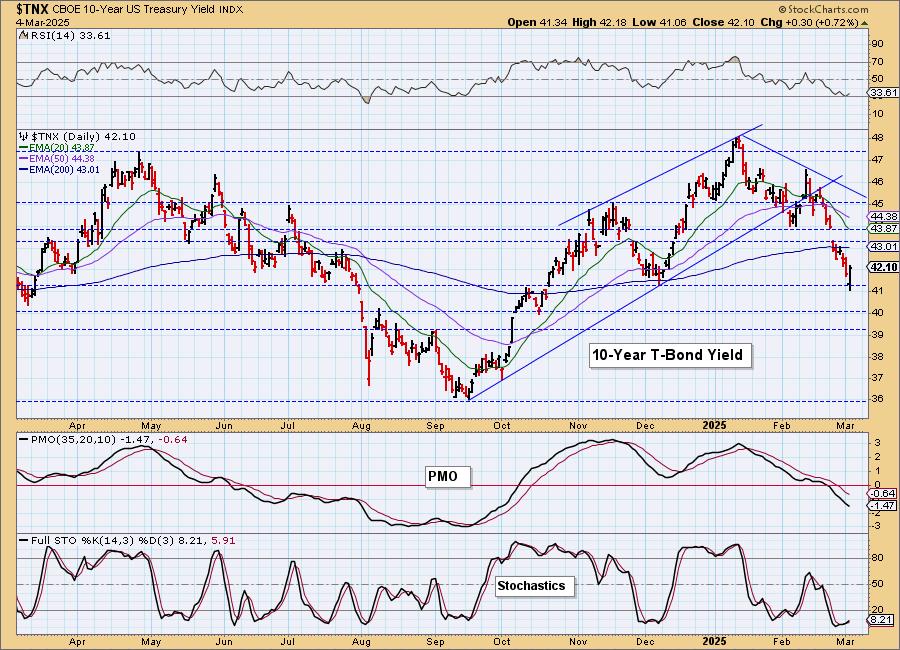
10-YEAR T-BOND YIELD
$TNX bounced today but still set a lower high and lower low. This is a good place to see the bounce given it had landed on support at the December low. We still it as vulnerable to more downside given the negative not oversold RSI and falling PMO. Stochastics are rising again, but given they are below 20, there is still internal weakness.
BONDS (TLT)
IT Trend Model: BUY as of 2/25/2025
LT Trend Model: SELL as of 12/13/2024
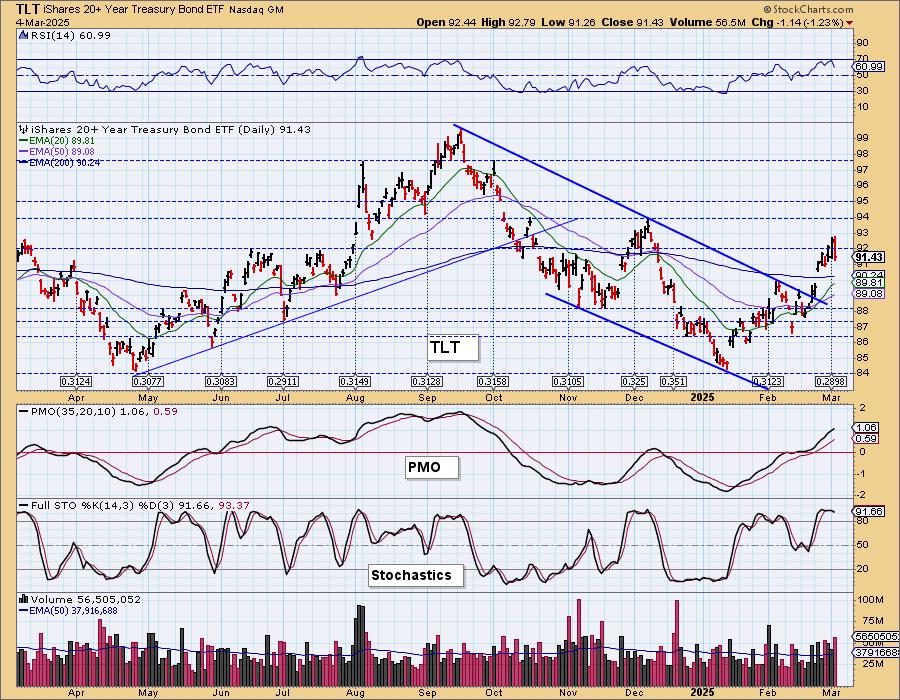
TLT Daily Chart: Bonds pulled back today as yields were higher. TLT still looks quite bullish with its rising PMO and Stochastics holding above 80. We're still looking for a move to 94.
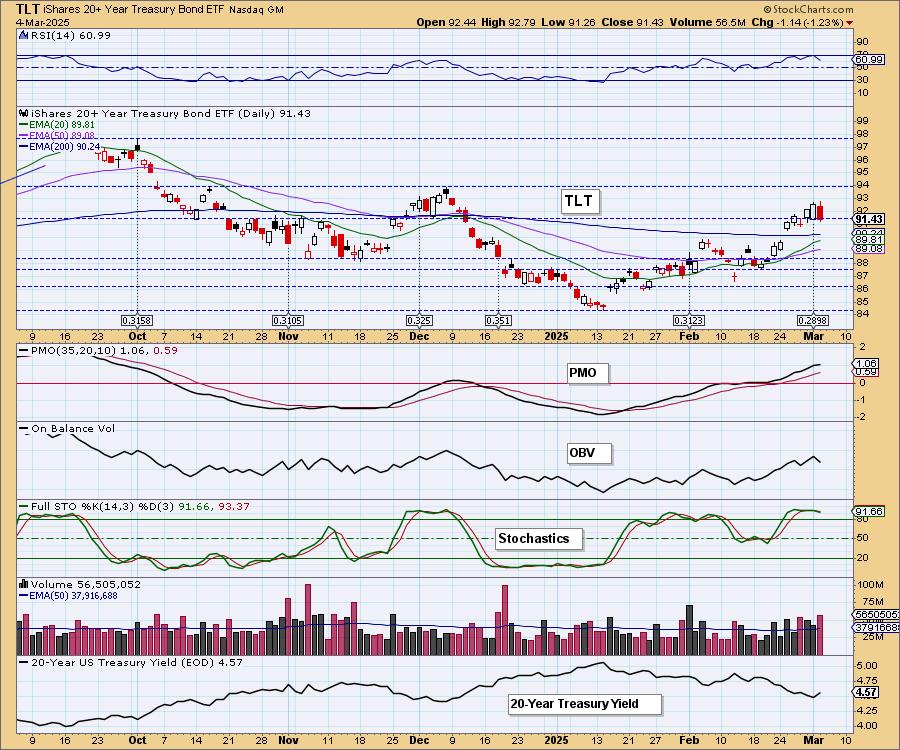
The breakout from the declining trend channel was especially bullish.
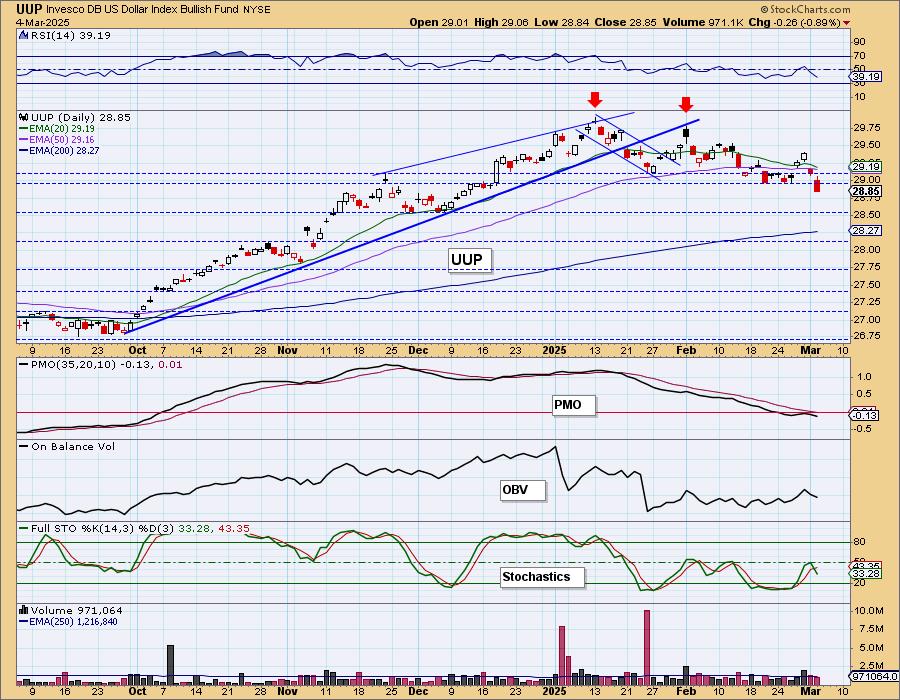
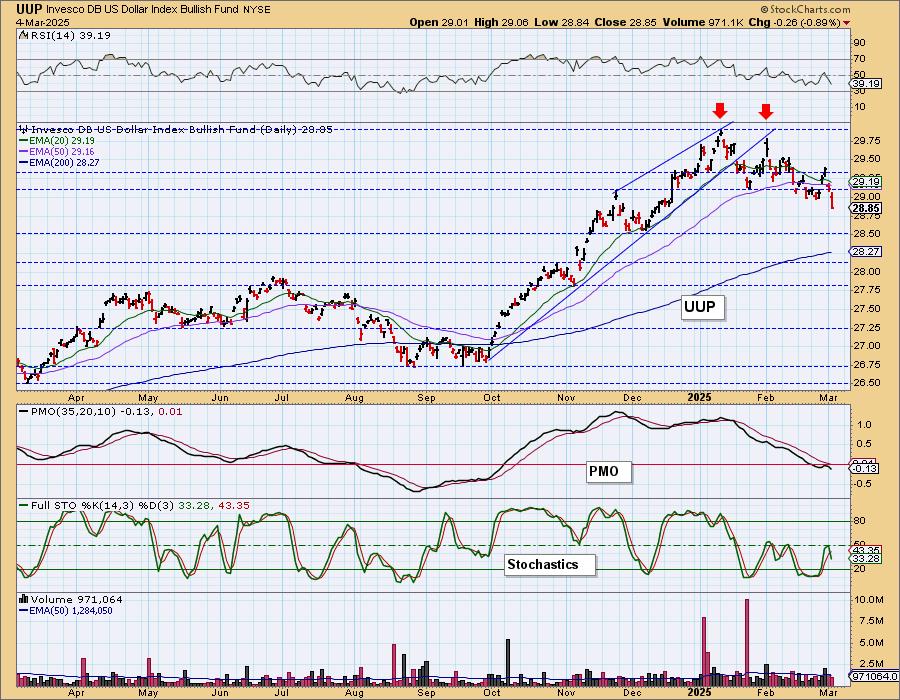
DOLLAR (UUP)
IT Trend Model: BUY as of 10/9/2024
LT Trend Model: BUY as of 5/25/2023
UUP Daily Chart: Tariff talk tends to be good for the Dollar, but not today. It dropped below strong support finally. We have a PMO top beneath the signal line and zero line so weakness is clear. Stochastics confirm this breakdown and suggest more downside ahead.
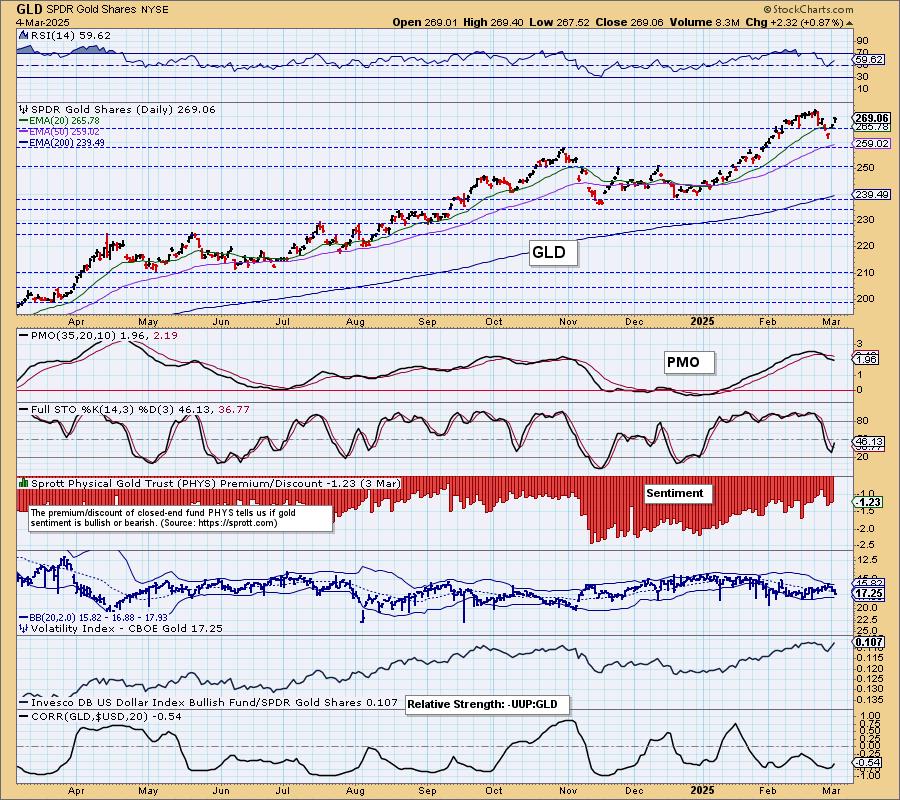
GOLD
IT Trend Model: BUY as of 1/10/2025
LT Trend Model: BUY as of 10/20/2023
GLD Daily Chart: Investors seem to be warming up to Gold again given the weakness in the market. A declining Dollar helped too. It looks like it is ready to set all-time highs again. The PMO is trying to turn back up and Stochastics are rising.
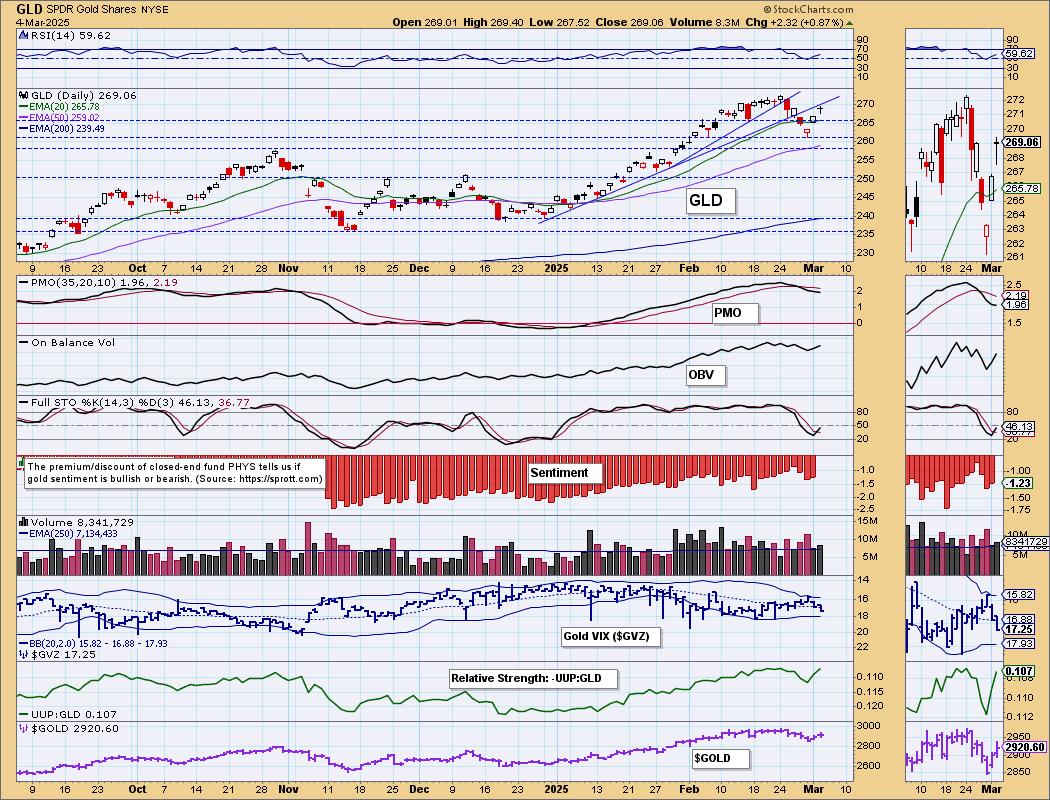
We also see that Gold's relative strength line rose significantly today. It looks good for Gold right now.
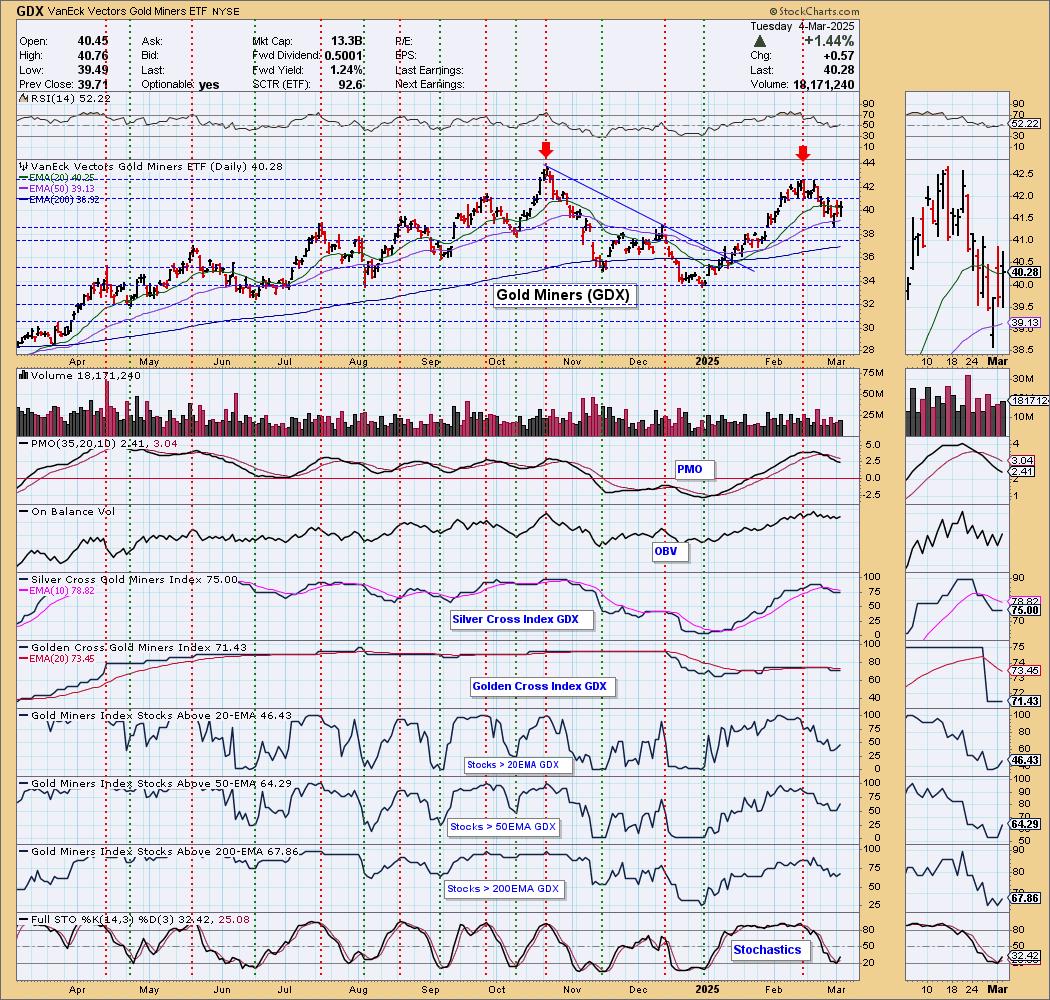
GOLD MINERS (GDX) Daily Chart: Gold's rally seems to have helped GDX. Participation is still in a declining trend, but isn't what we'd call incredibly weak, more 'modestly' weak. This could give GDX the opportunity to rally higher with Gold. However, these are companies and thus are subject to the winds of the market. If we continue to see marked weakness in the market, it will likely be slow going for GDX.
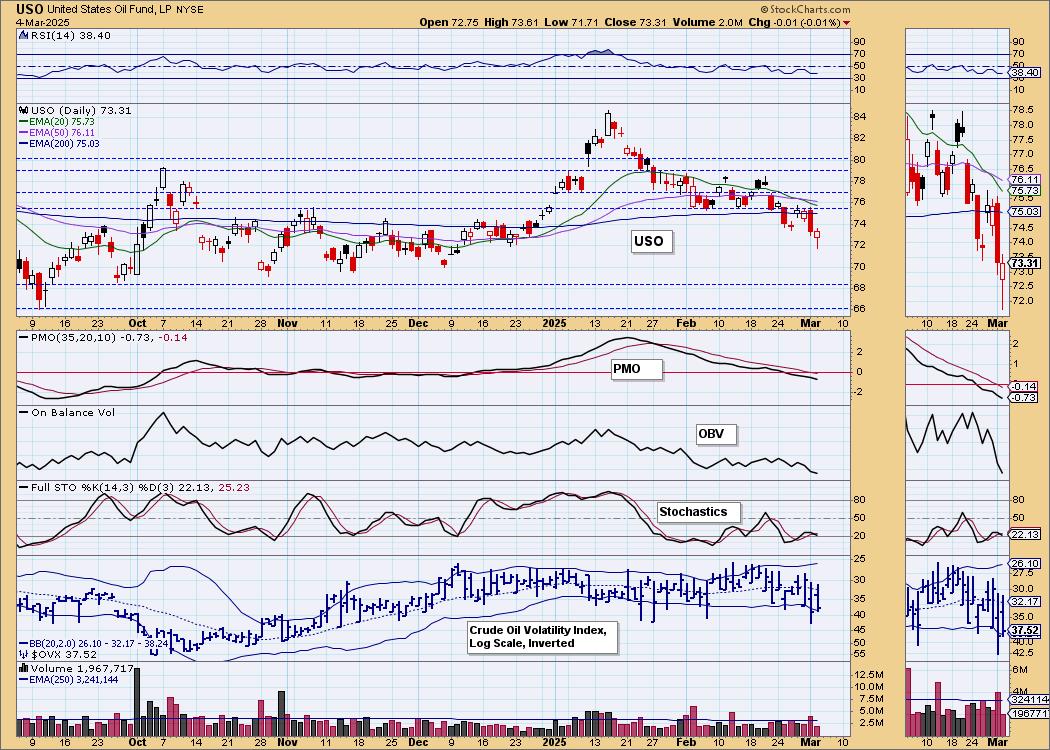
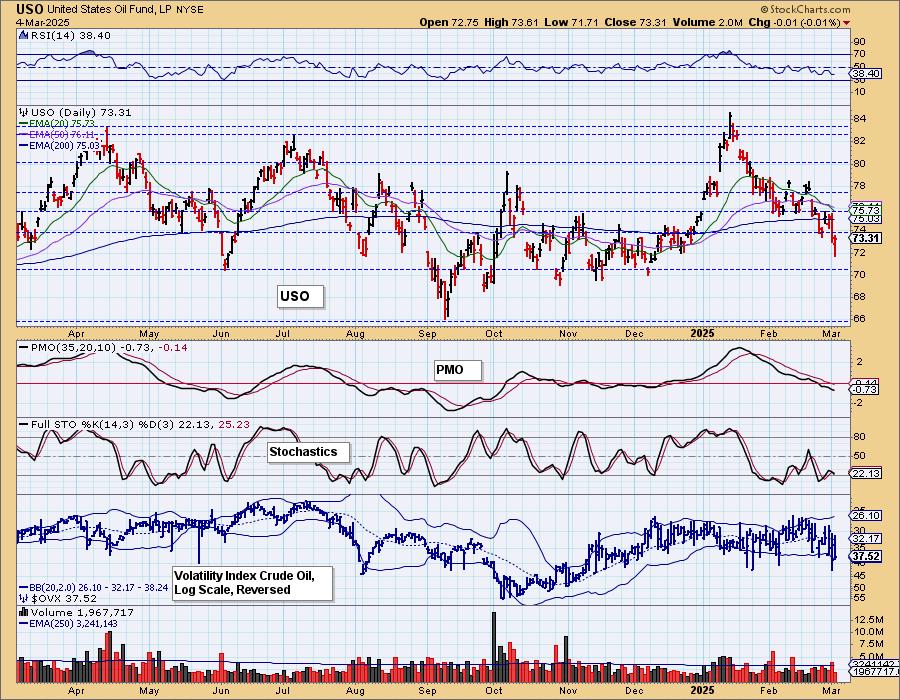
CRUDE OIL (USO)
IT Trend Model: BUY as of 12/24/2024
LT Trend Model: BUY as of 1/10/2025
USO Daily Chart: Crude Oil declined again today but did form a bullish hollow red candlestick that also had a long tail so it was hammer-like as well. This could mean a small rally ahead. However, Stochastics are in decline alongside the PMO. The RSI is negative and not oversold. If we get a bounce it will be short lived.
Good Luck & Good Trading!
Erin Swenlin and Carl Swenlin
Technical Analysis is a windsock, not a crystal ball. --Carl Swenlin
(c) Copyright 2025 DecisionPoint.com
Disclaimer: This blog is for educational purposes only and should not be construed as financial advice. The ideas and strategies should never be used without first assessing your own personal and financial situation, or without consulting a financial professional. Any opinions expressed herein are solely those of the author, and do not in any way represent the views or opinions of any other person or entity.
DecisionPoint is not a registered investment advisor. Investment and trading decisions are solely your responsibility. DecisionPoint newsletters, blogs or website materials should NOT be interpreted as a recommendation or solicitation to buy or sell any security or to take any specific action.
NOTE: The signal status reported herein is based upon mechanical trading model signals, specifically, the DecisionPoint Trend Model. They define the implied bias of the price index based upon moving average relationships, but they do not necessarily call for a specific action. They are information flags that should prompt chart review. Further, they do not call for continuous buying or selling during the life of the signal. For example, a BUY signal will probably (but not necessarily) return the best results if action is taken soon after the signal is generated. Additional opportunities for buying may be found as price zigzags higher, but the trader must look for optimum entry points. Conversely, exit points to preserve gains (or minimize losses) may be evident before the model mechanically closes the signal.
Helpful DecisionPoint Links:
DecisionPoint Alert Chart List
DecisionPoint Golden Cross/Silver Cross Index Chart List
DecisionPoint Sector Chart List
Price Momentum Oscillator (PMO)