
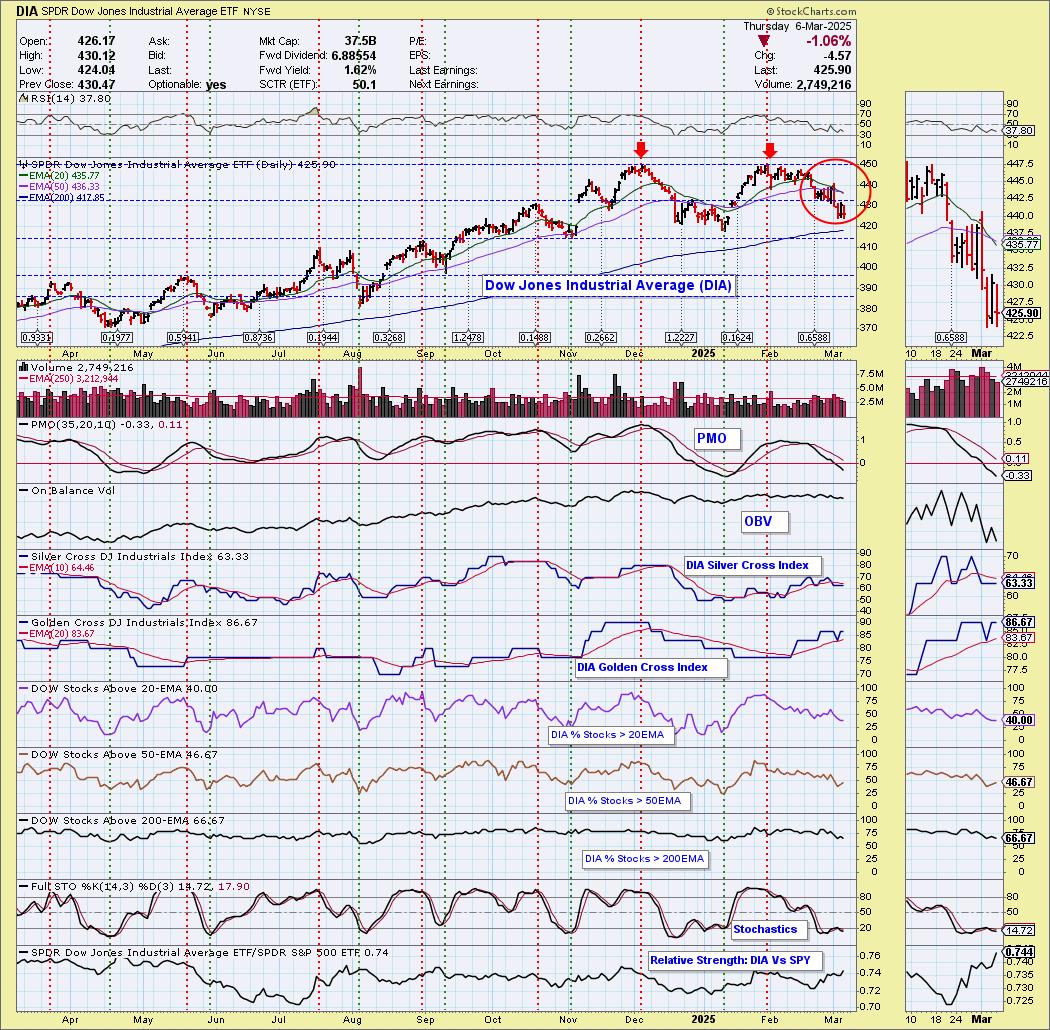
Today the Dow Jone Industrial Average ETF (DIA) 20-day EMA crossed down through the 50-day EMA (Dark Cross), above the 200-day EMA, generating an IT Trend Model NEUTRAL Signal. Price is about to reach support at the 200-day EMA and the 2025 low. We have a large bearish double top formation that does seem to suggest that support will not hold here.
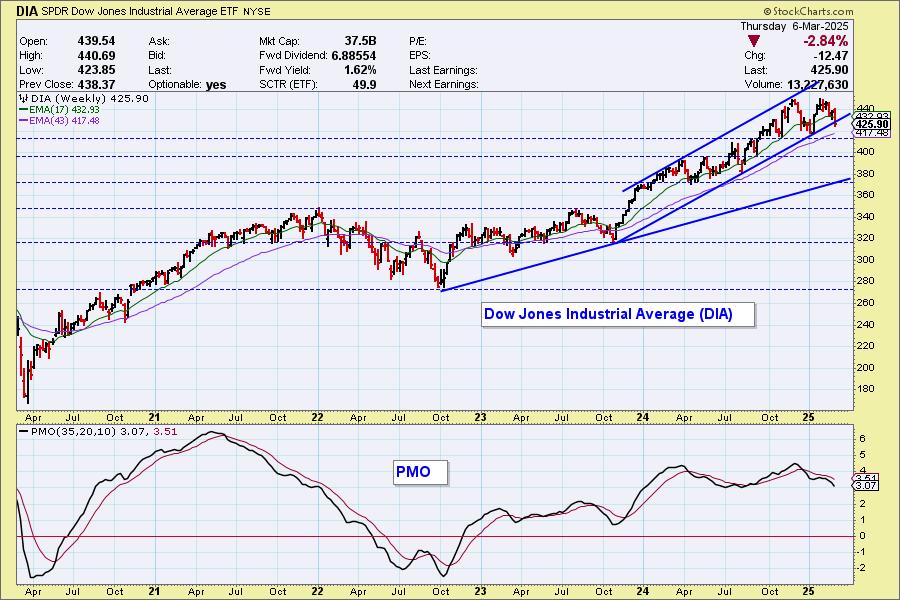
The rising trend channel on the weekly chart is being compromised. The weekly PMO is accelerating lower. The double top looks ominous.
The DecisionPoint Alert Weekly Wrap presents an end-of-week assessment of the trend and condition of the Stock Market, the U.S. Dollar, Gold, Crude Oil, and Bonds. The DecisionPoint Alert daily report (Monday through Thursday) is abbreviated and gives updates on the Weekly Wrap assessments.
Watch the latest episode of DecisionPoint on our YouTube channel here!
MARKET/INDUSTRY GROUP/SECTOR INDEXES
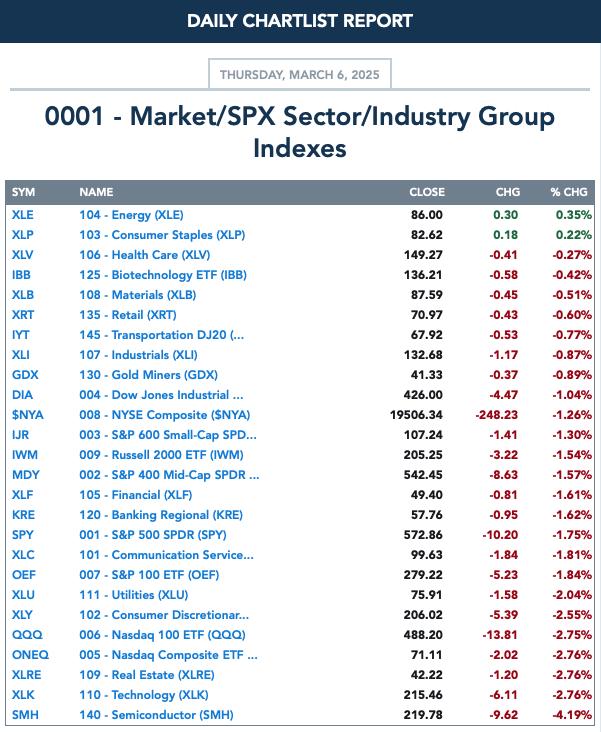
CLICK HERE for Carl's annotated Market Index, Sector, and Industry Group charts.
THE MARKET (S&P 500)
IT Trend Model: NEUTRAL as of 3/4/2025
LT Trend Model: BUY as of 3/29/2023
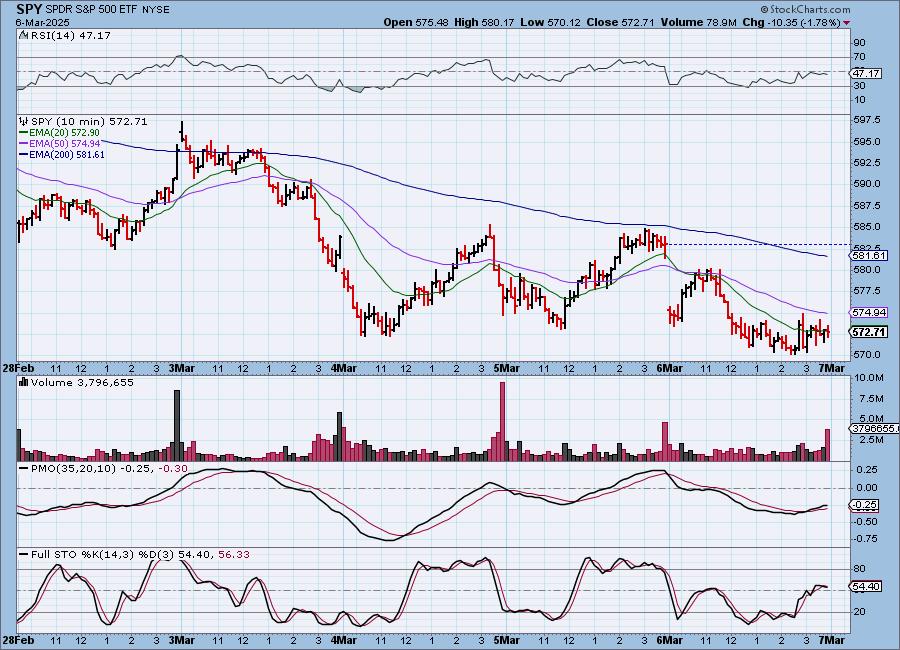
SPY 10-Minute Chart: The market attempted to rally after the initial gap down on the open, but that rally failed and price continued to make its way lower. This does look like possible bottoming formation in the very short term. The 10-minute PMO is rising on a Crossover BUY Signal.
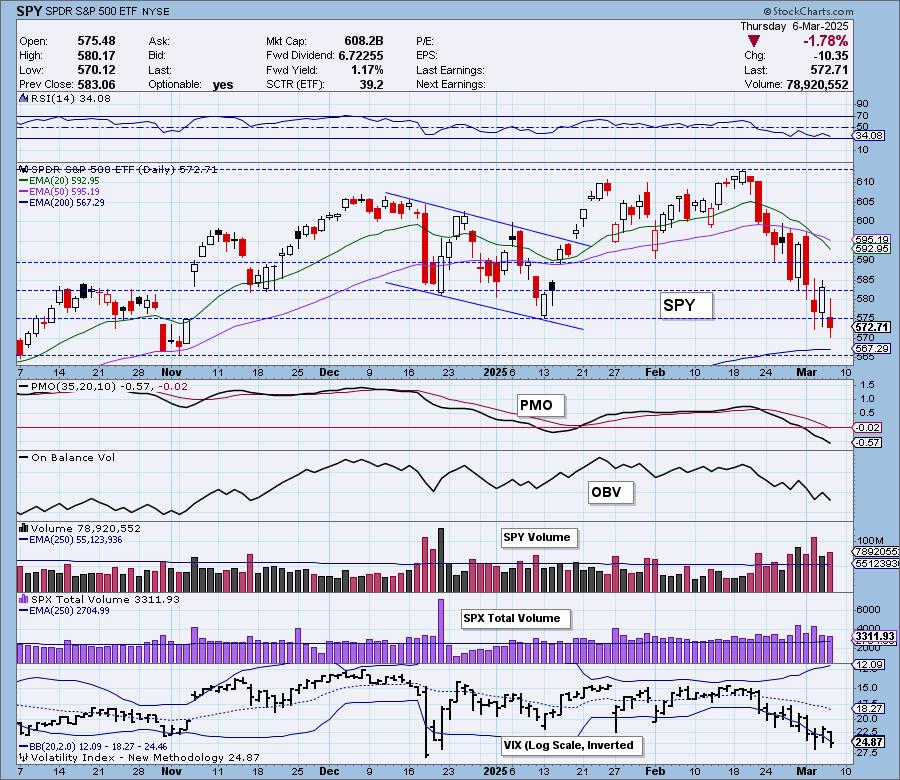
SPY Daily Chart: Support was broken with today's decline, but there is another support level nearby as well as the 200-day EMA that could prevent further breakdown. The PMO continues to decline below the zero line and the RSI is negative and NOT oversold yet. More decline could follow.
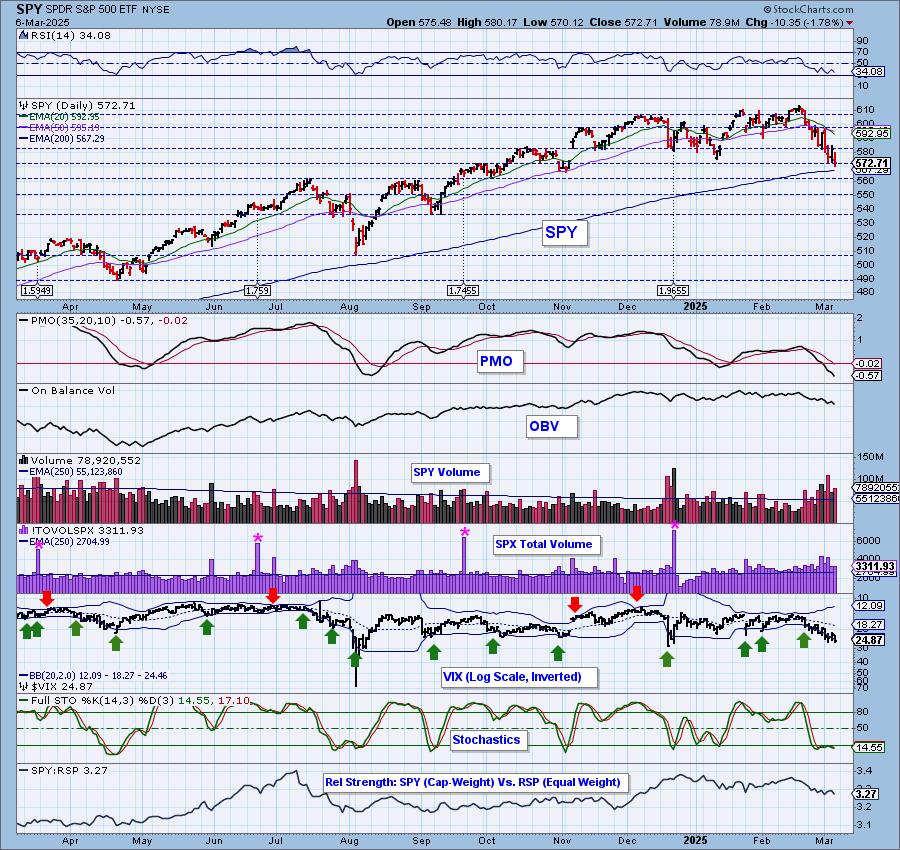
Fear continues to rise within the market as the VIX continues to drop below its lower Bollinger Band on the inverted scale. It is reaching levels not seen since December of 2024. Stochastics have topped below 20 indicating severe internal weakness. The relative strength line to equal-weight RSP continues to trend lower as mega-caps continue to lose their prior dominance.

Here is the latest recording from 3/3. Click HERE to get to our video list.:
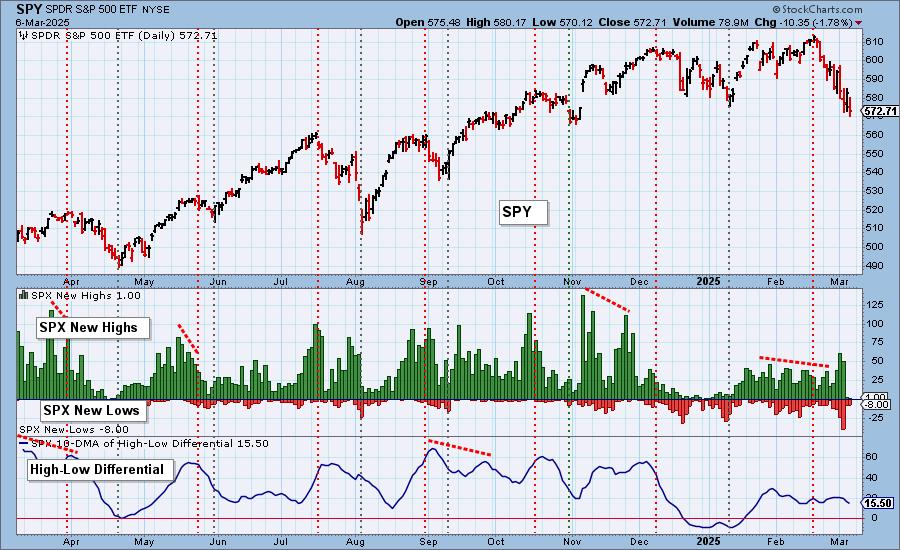
S&P 500 New 52-Week Highs/Lows: We saw only one New High today, but we also saw a contraction of New Lows. The High-Low Differential is moving lower in bearish fashion.
Climax* Analysis: There were two climax readings on the four relevant indicators, giving us a downside initiation climax. We have now had five consecutive climax days, and each of the last four has reversed the one that preceded it. If tomorrow follows this pattern, we should have strong up day, but we wouldn't bet the farm on that. SPX Total Volume was solid, but not enough to indicate a blowout.
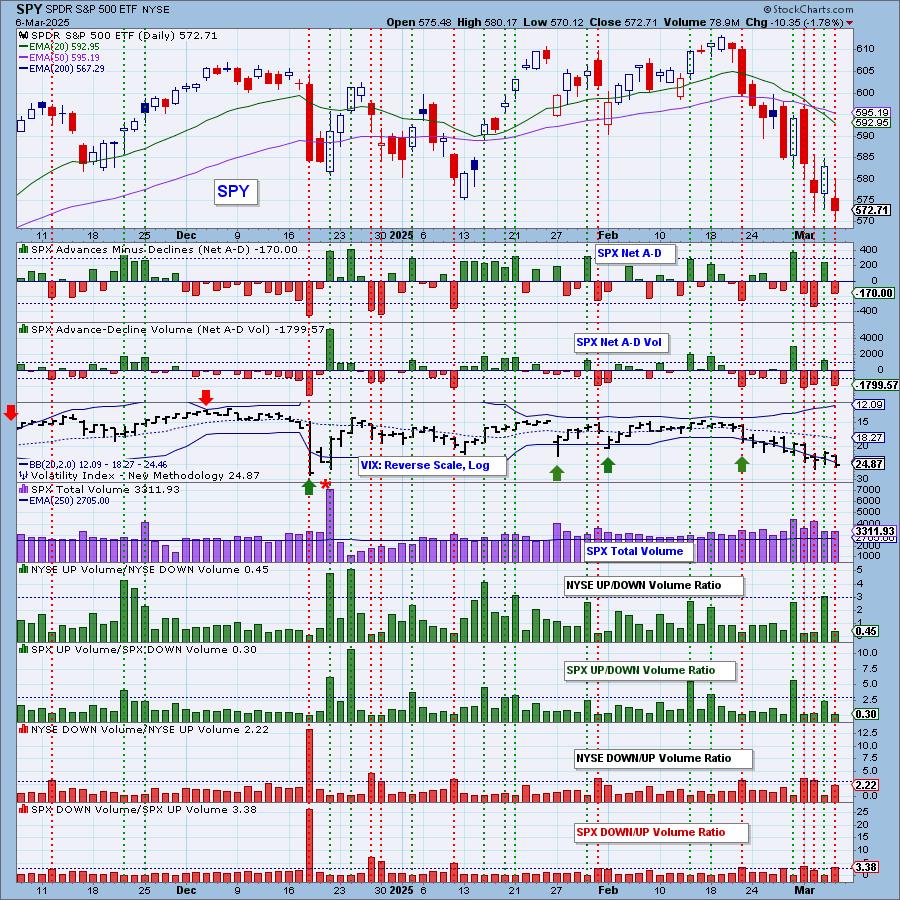
*A climax is a one-day event when market action generates very high readings in, primarily, breadth and volume indicators. We also include the VIX, watching for it to penetrate outside the Bollinger Band envelope. The vertical dotted lines mark climax days -- red for downside climaxes, and green for upside. Climaxes are at their core exhaustion events; however, at price pivots they may be initiating a change of trend.
Short-Term Market Indicators: The short-term market trend is DOWN and the condition is NEUTRAL.
Swenlin Trading Oscillators (STOs) rose again today setting up a possible rally for tomorrow. However, they have been whipped around with this wacky price action and they are in negative territory so we aren't going to put too much emphasis on their current rise. Participation was lower and we lost more rising PMOs, not a surprise.
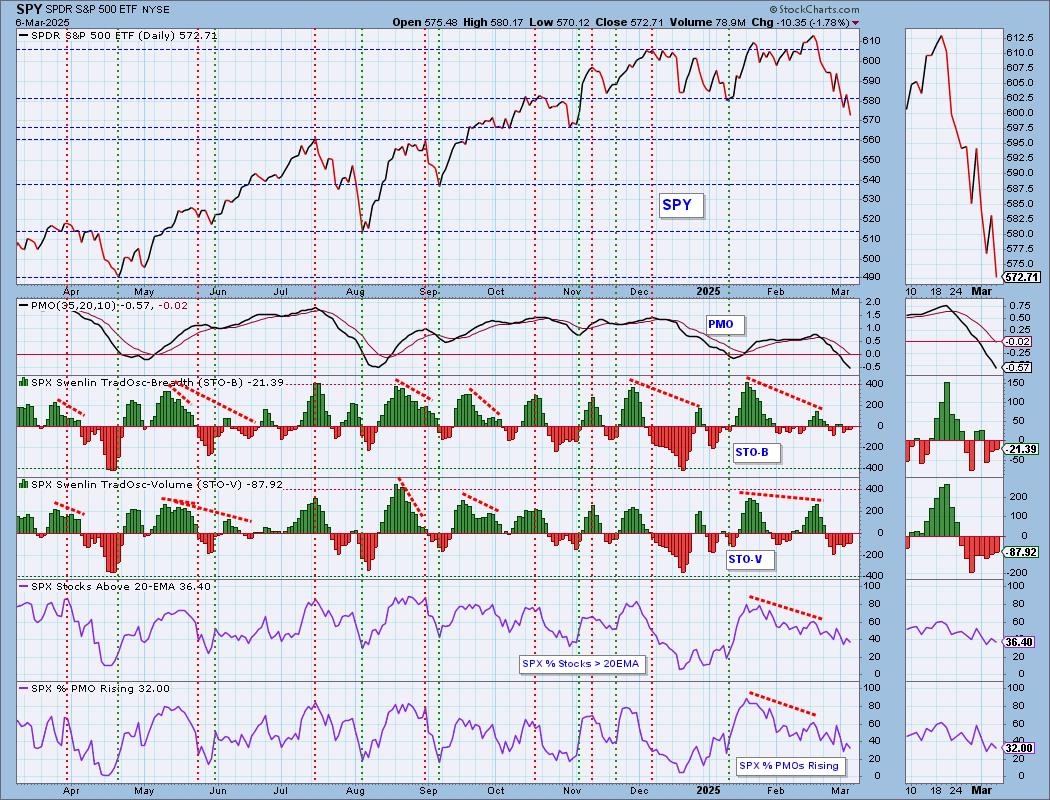
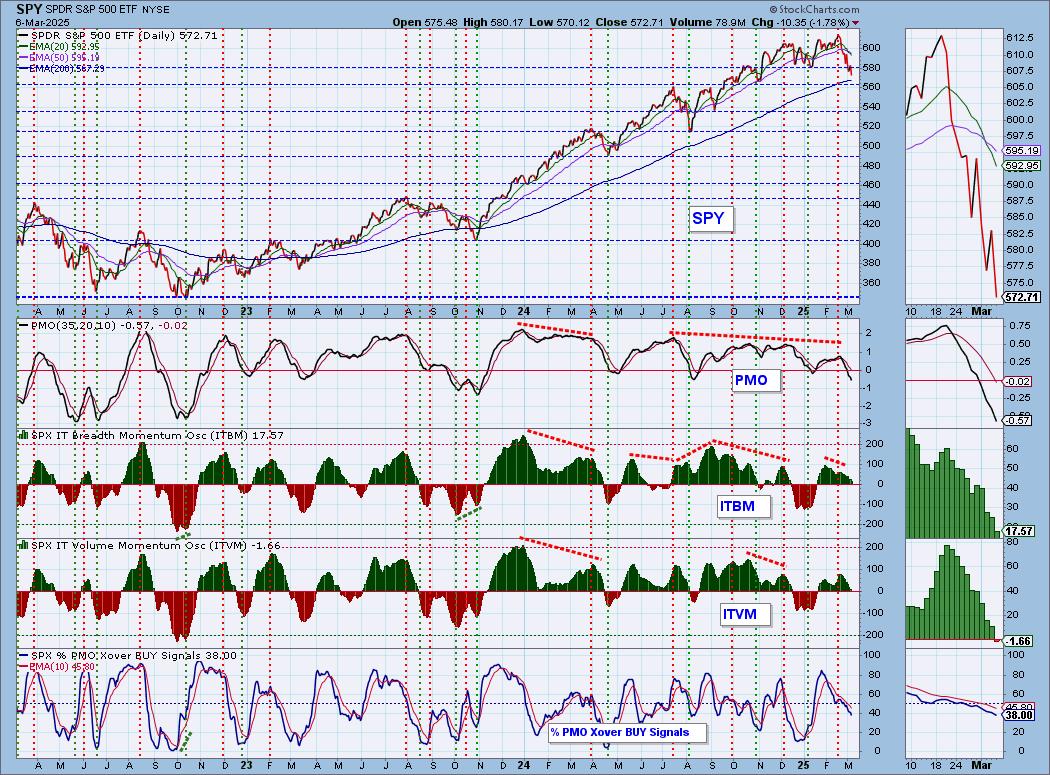
Intermediate-Term Market Indicators: The intermediate-term market trend is DOWN and the condition is NEUTRAL.
Given the rising trend out of the November 2023 low has been violated, we suggest that the intermediate-term trend is DOWN. The ITBM and ITVM and moving lower and the ITVM hit negative territory today. As expected, we lost more PMO Crossover BUY Signals.
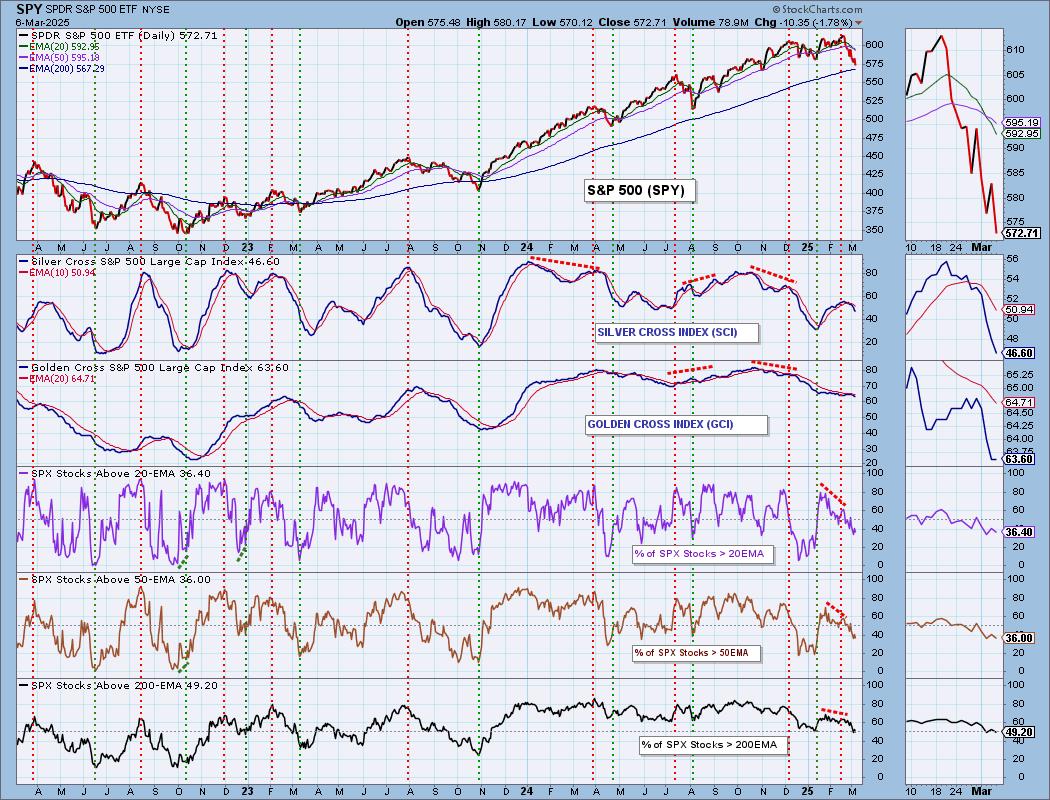
PARTICIPATION CHART (S&P 500): The following chart objectively shows the depth and trend of participation for the SPX in two time frames.
- Intermediate-Term - the Silver Cross Index (SCI) shows the percentage of SPX stocks on IT Trend Model BUY signals (20-EMA > 50-EMA). The opposite of the Silver Cross is a "Dark Cross" -- those stocks are, at the very least, in a correction.
- Long-Term - the Golden Cross Index (GCI) shows the percentage of SPX stocks on LT Trend Model BUY signals (50-EMA > 200-EMA). The opposite of a Golden Cross is the "Death Cross" -- those stocks are in a bear market.
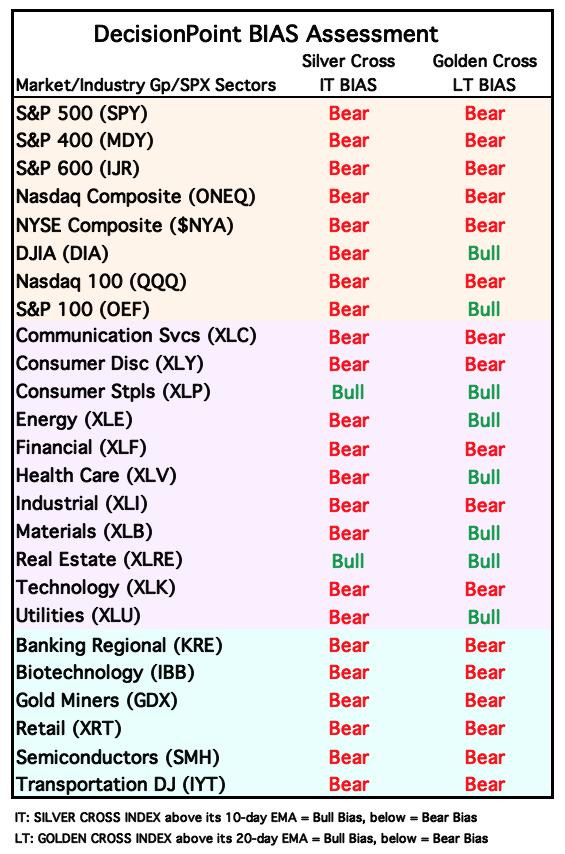
The market bias is BEARISH in the intermediate and long terms.
The declining trends continue on participation of stocks above key moving averages. The Silver Cross Index looks terrible as it accelerates lower. It is below its signal line so the IT Bias is BEARISH. The Golden Cross Index was unchanged today. It remains below its signal line so the LT Bias is also BEARISH.
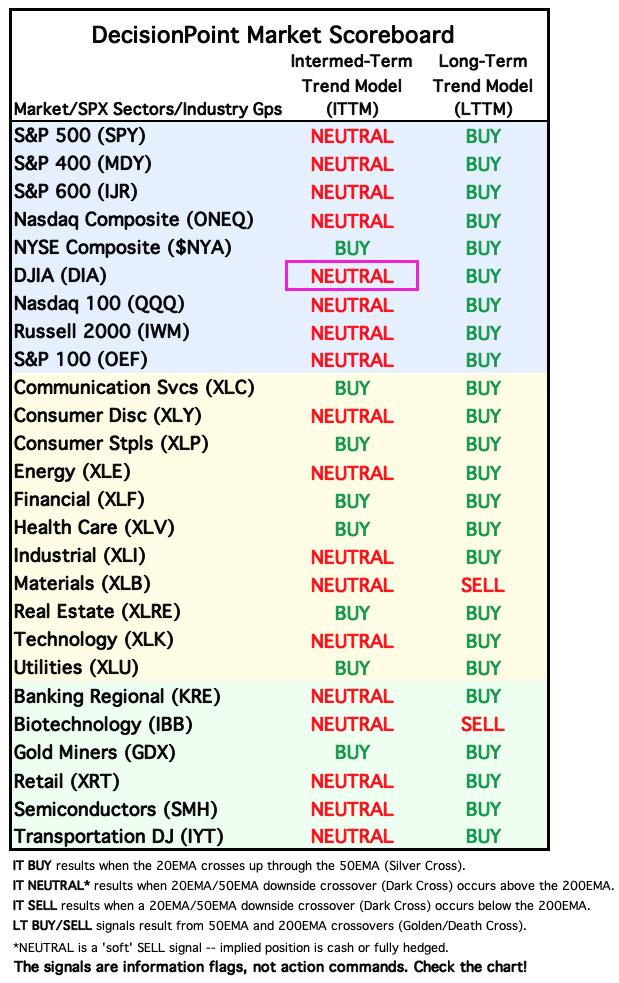
BIAS Assessment: The following table expresses the current BIAS of various price indexes based upon the relationship of the Silver Cross Index to its 10-day EMA (intermediate-term), and of the Golden Cross Index to its 20-day EMA (long-term). When the Index is above the EMA it is bullish, and it is bearish when the Index is below the EMA. The BIAS does not imply that any particular action should be taken. It is information to be used in the decision process.
The items with highlighted borders indicate that the BIAS changed today.
*****************************************************************************************************
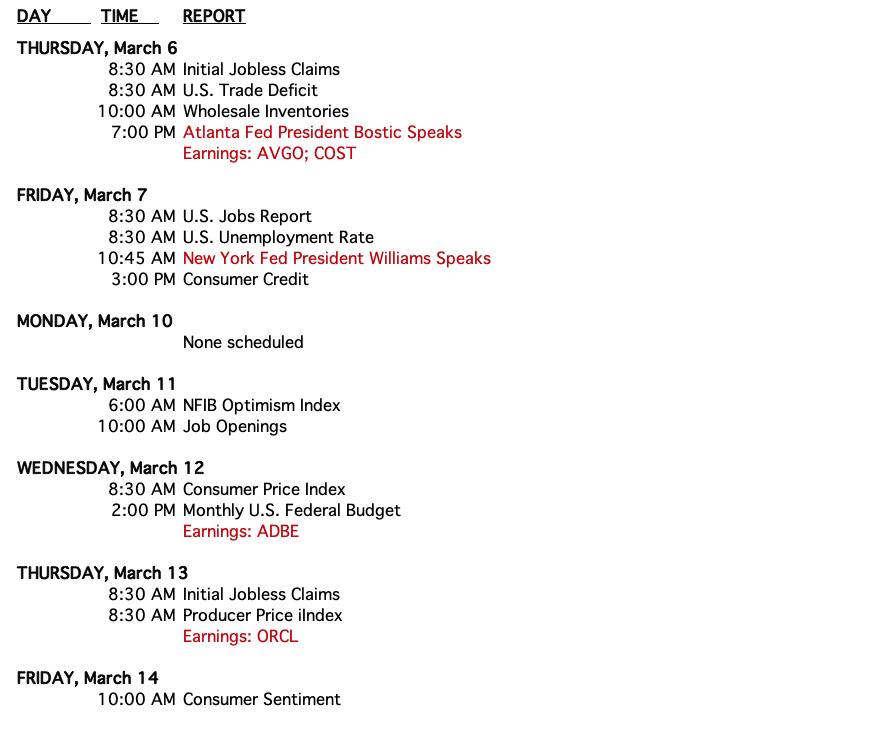
CONCLUSION: We very volatile trading that reminds us of the jagged drop in 2020 during COVID. This time trade wars are the catalyst. News seems to be bouncing the index around. We see the jobs report tomorrow and this could be a key player in the market's direction tomorrow. We have rising STOs, but a downside initiation climax. The rest of our indicators are in decline. The market is internally weak so it should continue to move lower, but with sloppy trading like we've seen, we wouldn't be surprised by another rally. We do believe there will be more downside in the intermediate term.
Erin is 10% long, 0% short. (This is intended as information, not a recommendation.)
*****************************************************************************************************
CALENDAR
Have you subscribed the DecisionPoint Diamonds yet? DP does the work for you by providing handpicked stocks/ETFs from exclusive DP scans! Add it with a discount! Contact support@decisionpoint.com for more information!
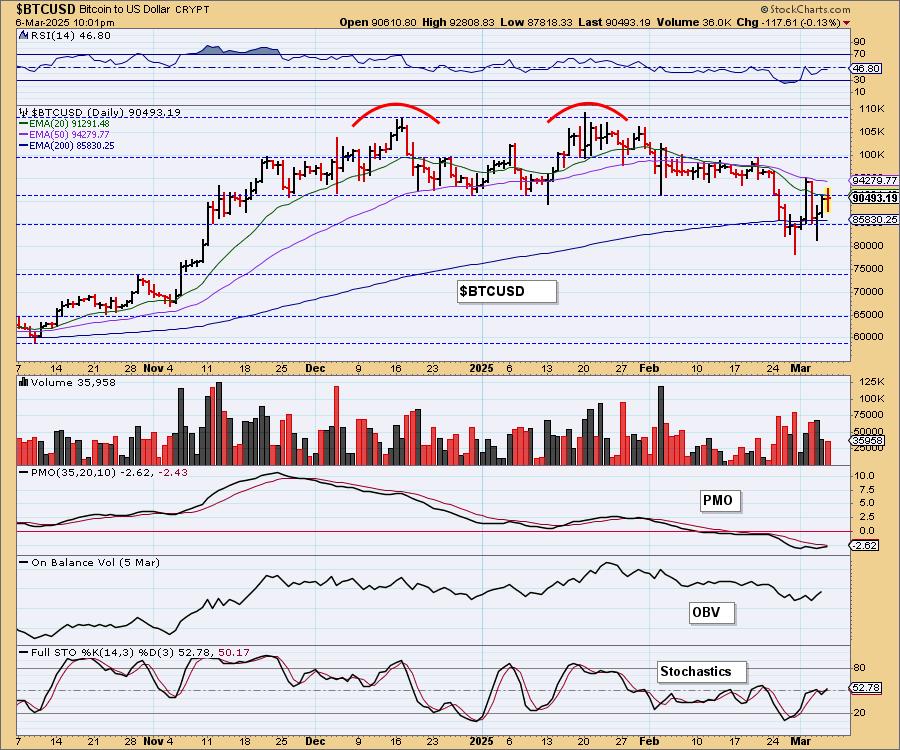
BITCOIN
We saw a higher low and higher high on today's decline so a rising trend is being established again. We are sitting at resistance so we'll see if this will turn into anything. The PMO is nearing a Crossover BUY Signal but for now we would view this as diminishing weakness not new strength. We think we'll see some consolidation below 100,000.
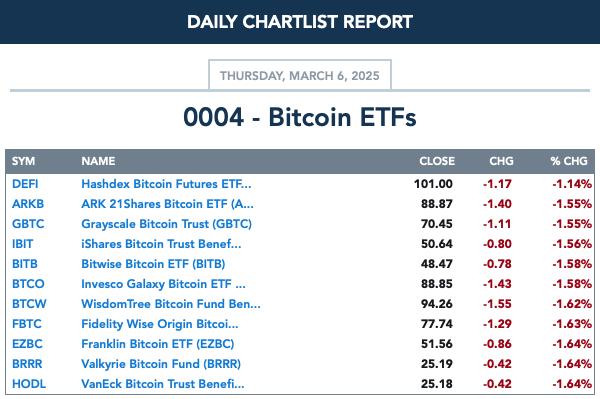
BITCOIN ETFs
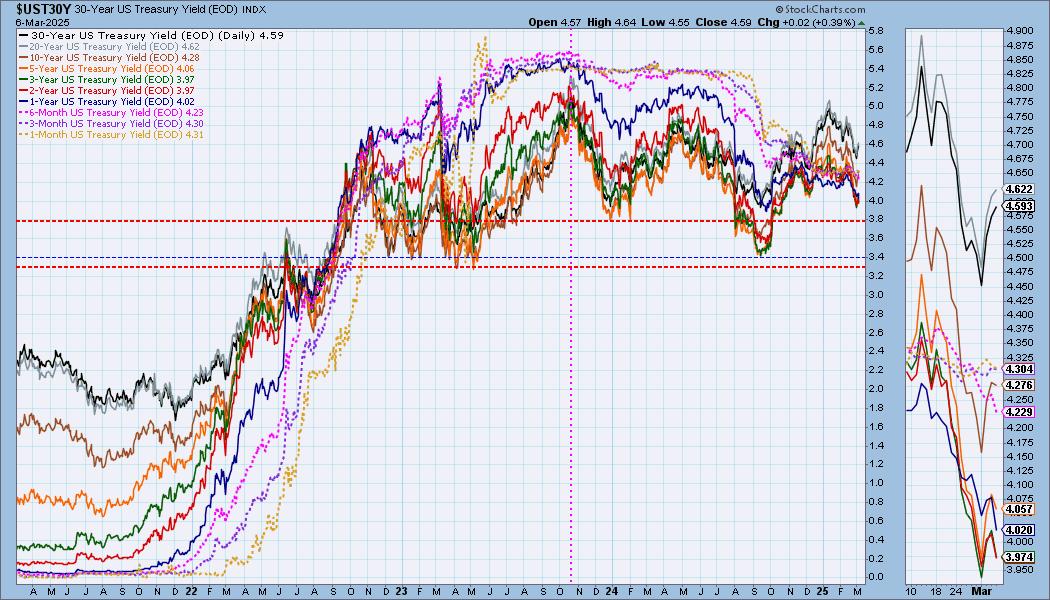
INTEREST RATES
Yields were mixed on the day. We are watching for a possible inflection point on yields that would get them rising again. It's still early.
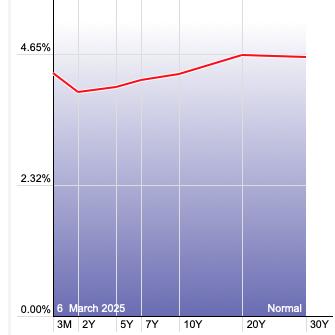
The Yield Curve Chart from StockCharts.com shows us the inversions taking place. The red line should move higher from left to right. Inversions are occurring where it moves downward.
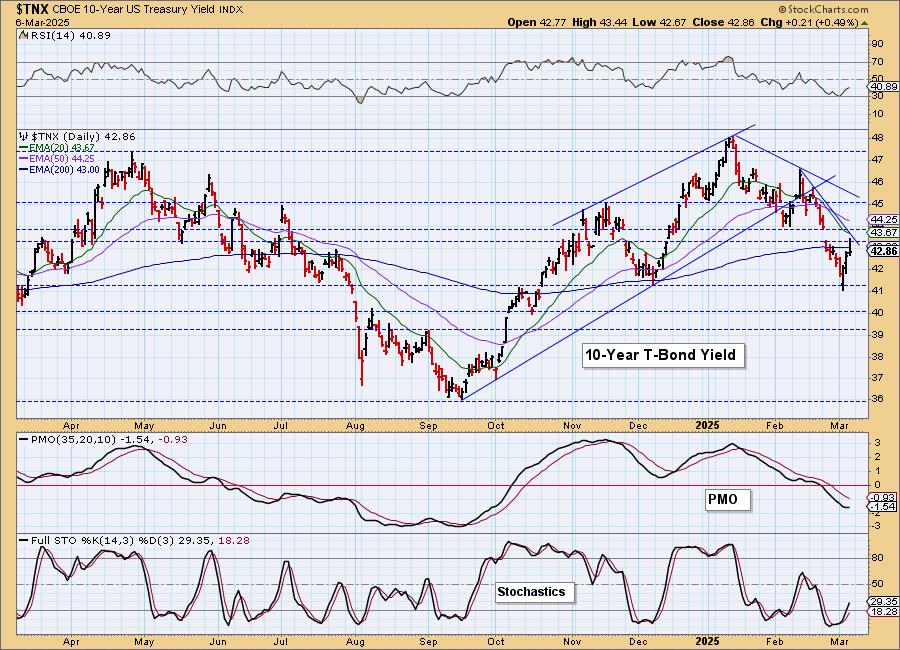
10-YEAR T-BOND YIELD
Yesterday's comments still apply:
"$TNX is bouncing off support at the December low. It now has to contend with a strong resistance zone at the previous gap. The PMO is still in decline but with Stochastics turning up, we think we could see this advance take hold."
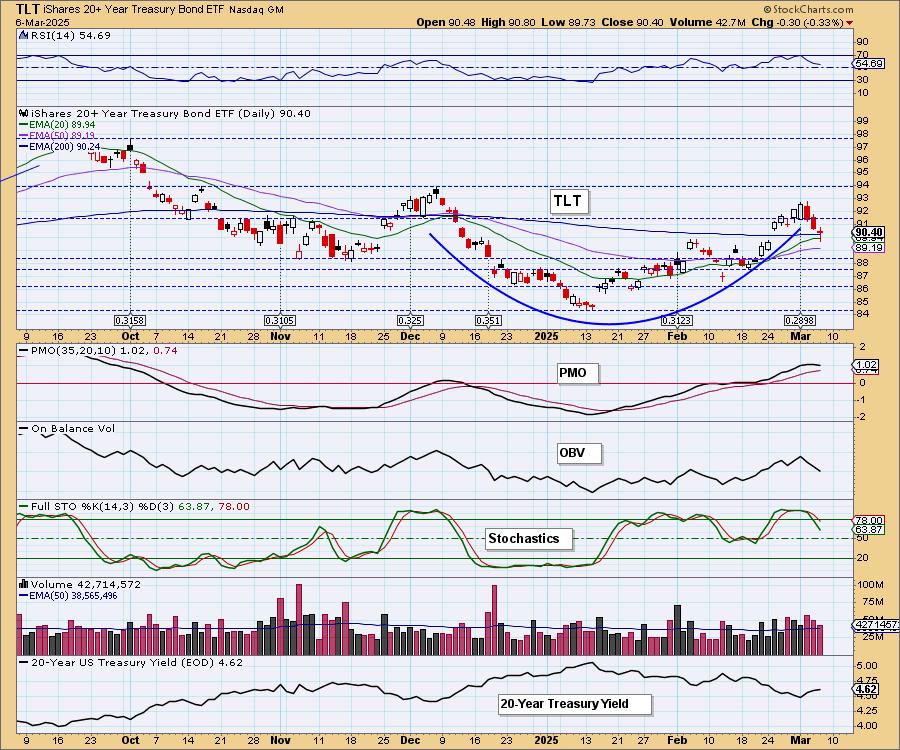
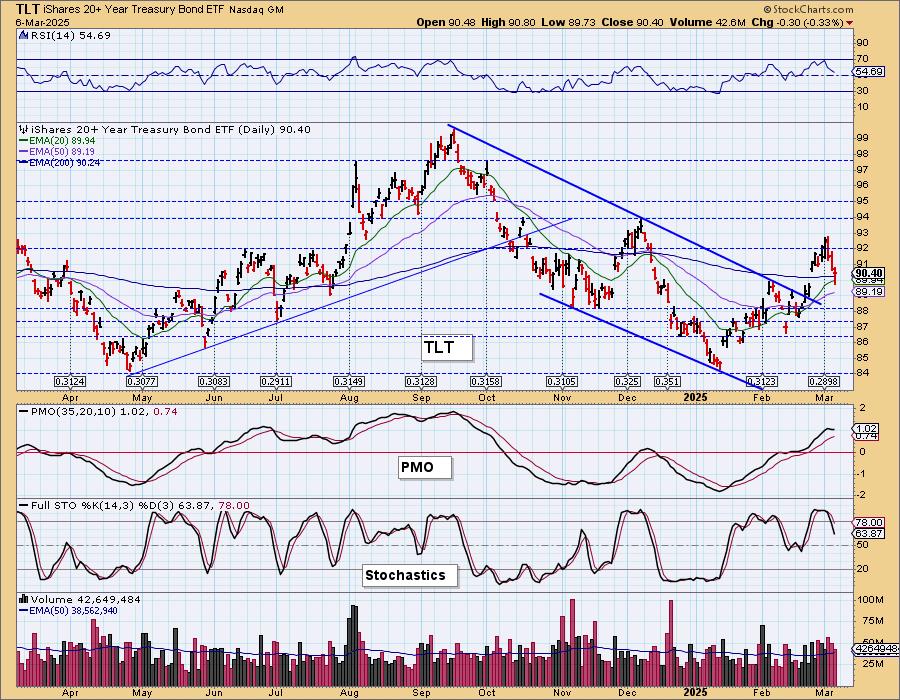
BONDS (TLT)
IT Trend Model: BUY as of 2/25/2025
LT Trend Model: SELL as of 12/13/2024
TLT Daily Chart: We could be looking at a bullish cup with handle pattern developing. With yields gaining strength we think the handle will continue to build. The PMO is in decline now suggesting diminishing strength. Stochastics look particularly bearish.
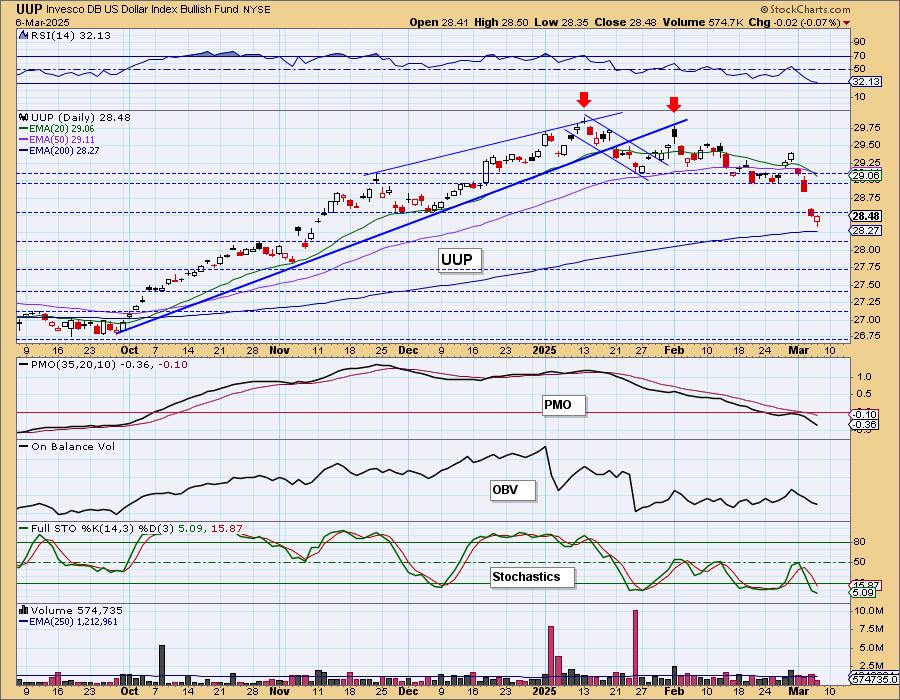
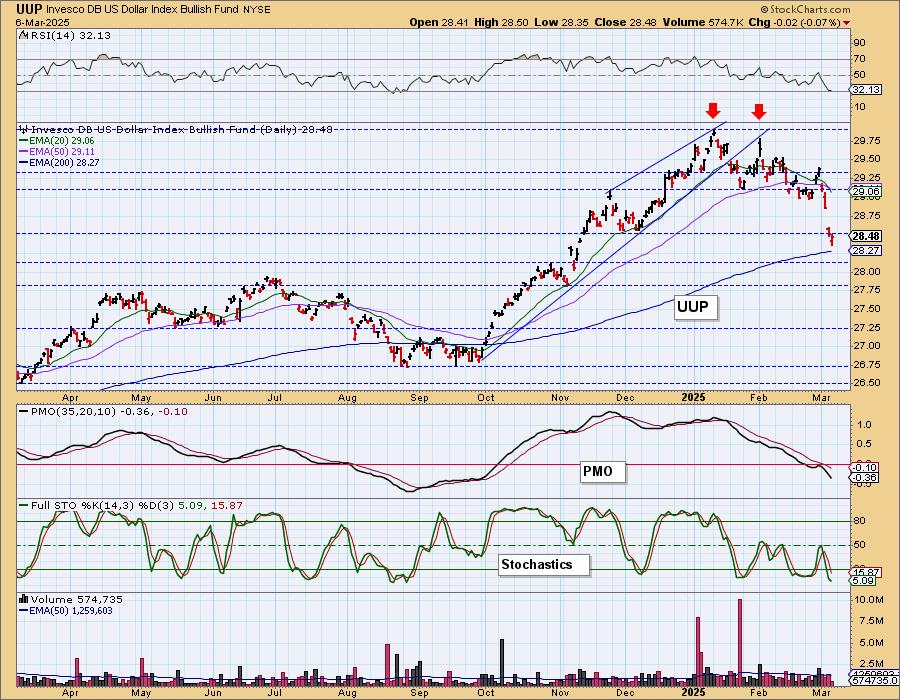
DOLLAR (UUP)
IT Trend Model: NEUTRAL as of 3/5/2025
LT Trend Model: BUY as of 5/25/2023
UUP Daily Chart: The Dollar fell again today but did form a bullish hollow red candlestick on top of the 200-day EMA. Still, with the PMO in decline and Stochastics below 20 we would look for price to drop a bit further from here. The minimum downside target of the bearish double top is about to be reached close to 28.00. We'll look for a possible rebound when we get closer to that level.
GOLD
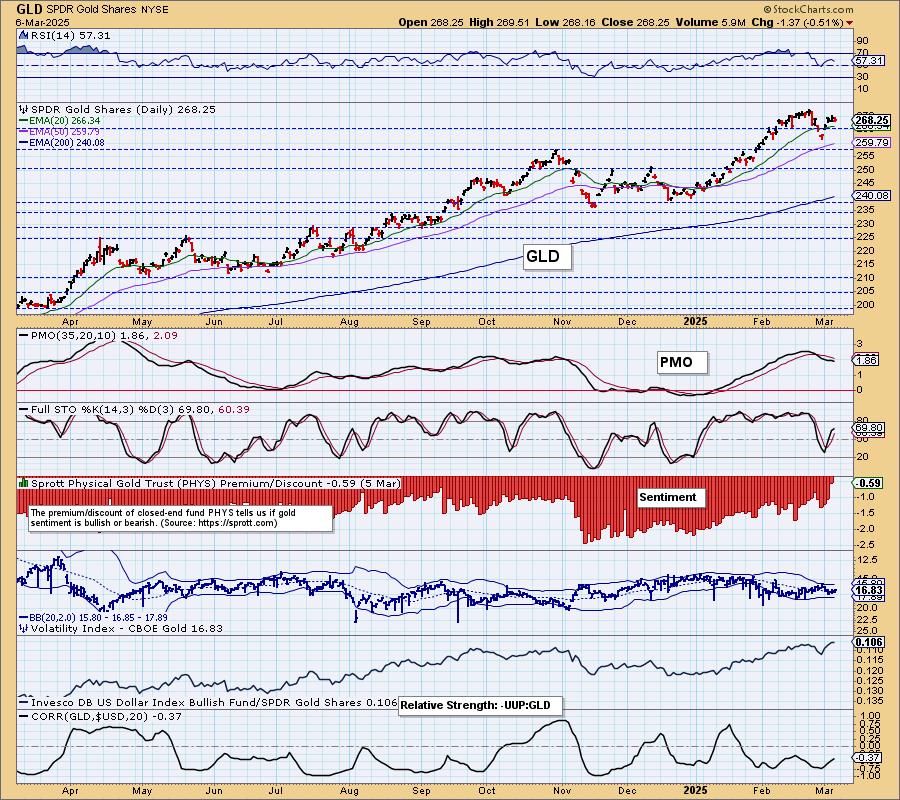
IT Trend Model: BUY as of 1/10/2025
LT Trend Model: BUY as of 10/20/2023
GLD Daily Chart: Gold dropped and is so far unable to recapture its prior rising trend. The PMO is still in decline but we sense more weakness ahead for the Dollar. Continued decline could also spur a flight to safety in Gold. We are looking for all-time highs.
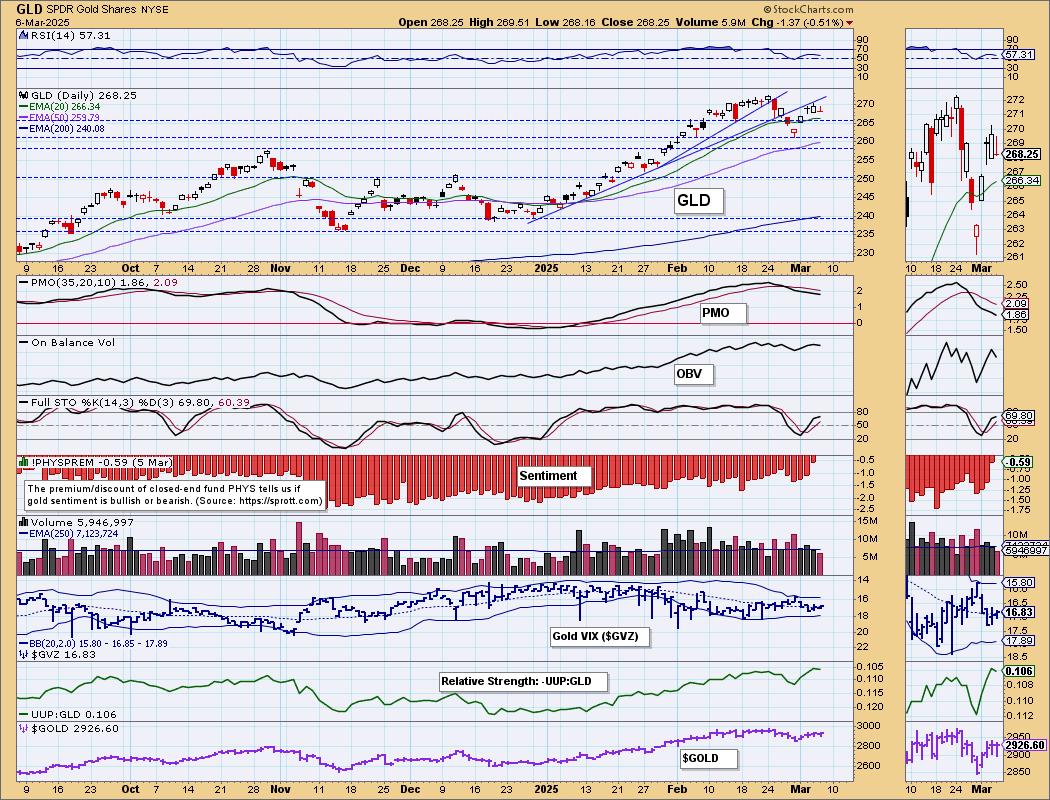
Discounts really dropped yesterday so investors are definitely bullish on Gold right now. That should help lift it higher, but it also leaves us vulnerable to a downside reversal on sentiment that is getting too bullish. It will be interesting to see if we make it into premium territory.
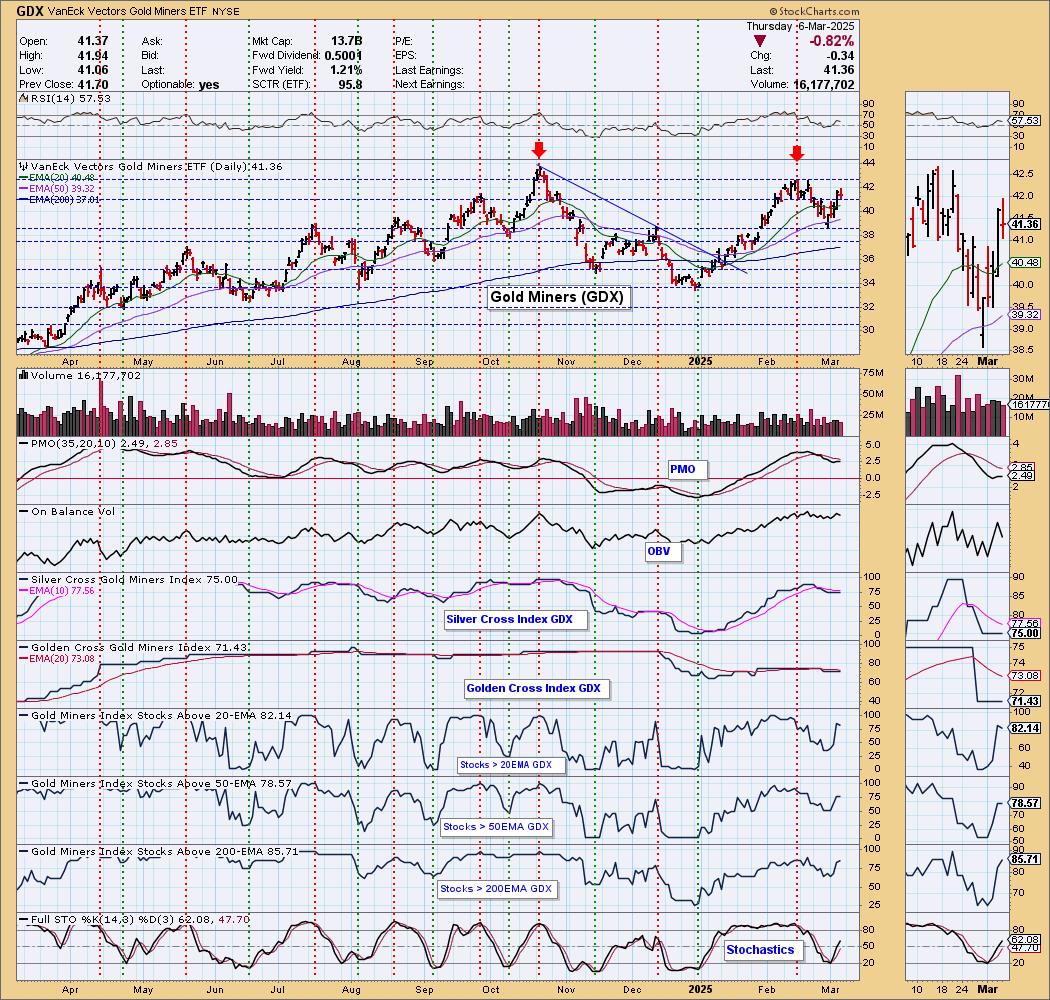
GOLD MINERS (GDX) Daily Chart: Gold Miners struggled on the decline in Gold and the market. We still see a short-term rising trend and with the Dollar in decline we think that price will test the second of the two tops within the bearish double top. That would begin to bust this bearish pattern, but for now it is still in force. Participation is healthy enough to see more upside here, but if Gold does reverse on its falling PMO and bullish sentiment, GDX will struggle to get above both of those tops. For now we look for a test of resistance.
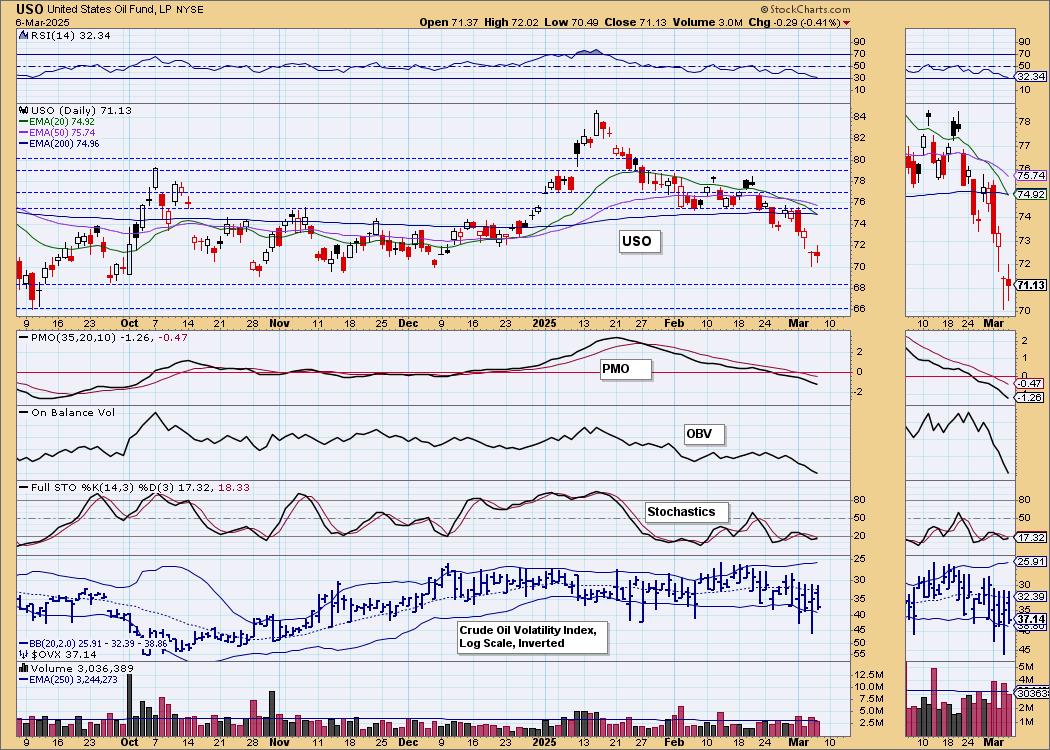
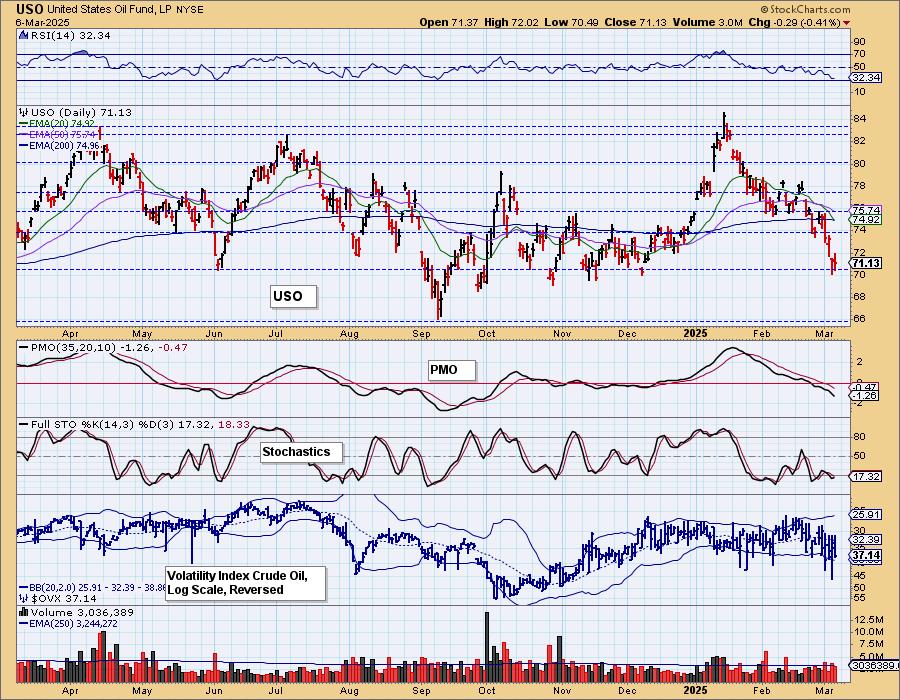
CRUDE OIL (USO)
IT Trend Model: BUY as of 12/24/2024
LT Trend Model: BUY as of 1/10/2025
USO Daily Chart: Bullish candlesticks have not helped Crude find some relief from this decline. The PMO continues lower and the RSI isn't oversold yet. Stochastics are below 20. We think we'll see a test of support at 68 at a minimum with a high likelihood that it could drop to 66.
Good Luck & Good Trading!
Erin Swenlin and Carl Swenlin
Technical Analysis is a windsock, not a crystal ball. --Carl Swenlin
(c) Copyright 2025 DecisionPoint.com
Disclaimer: This blog is for educational purposes only and should not be construed as financial advice. The ideas and strategies should never be used without first assessing your own personal and financial situation, or without consulting a financial professional. Any opinions expressed herein are solely those of the author, and do not in any way represent the views or opinions of any other person or entity.
DecisionPoint is not a registered investment advisor. Investment and trading decisions are solely your responsibility. DecisionPoint newsletters, blogs or website materials should NOT be interpreted as a recommendation or solicitation to buy or sell any security or to take any specific action.
NOTE: The signal status reported herein is based upon mechanical trading model signals, specifically, the DecisionPoint Trend Model. They define the implied bias of the price index based upon moving average relationships, but they do not necessarily call for a specific action. They are information flags that should prompt chart review. Further, they do not call for continuous buying or selling during the life of the signal. For example, a BUY signal will probably (but not necessarily) return the best results if action is taken soon after the signal is generated. Additional opportunities for buying may be found as price zigzags higher, but the trader must look for optimum entry points. Conversely, exit points to preserve gains (or minimize losses) may be evident before the model mechanically closes the signal.
Helpful DecisionPoint Links:
DecisionPoint Alert Chart List
DecisionPoint Golden Cross/Silver Cross Index Chart List
DecisionPoint Sector Chart List
Price Momentum Oscillator (PMO)