
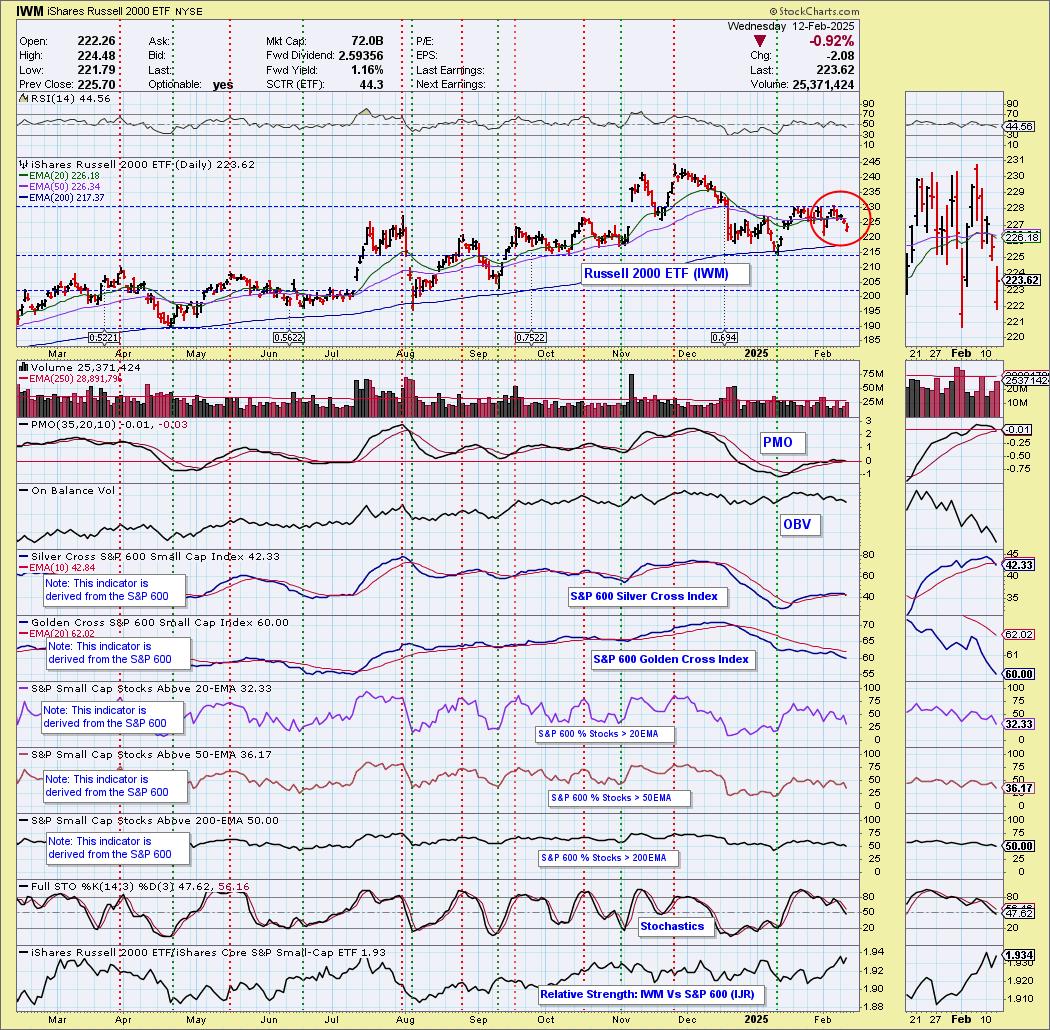
Today the Russell 2000 ETF (IWM) 20-day EMA crossed down through the 50-day EMA (Dark Cross), above the 200-day EMA, generating an IT Trend Model NEUTRAL Signal. Price failed at overhead resistance and is essentially forming a double top. The PMO has dropped beneath the zero line. The Silver Cross Index had a BEARISH Shift across its signal line today. We expect more downside.
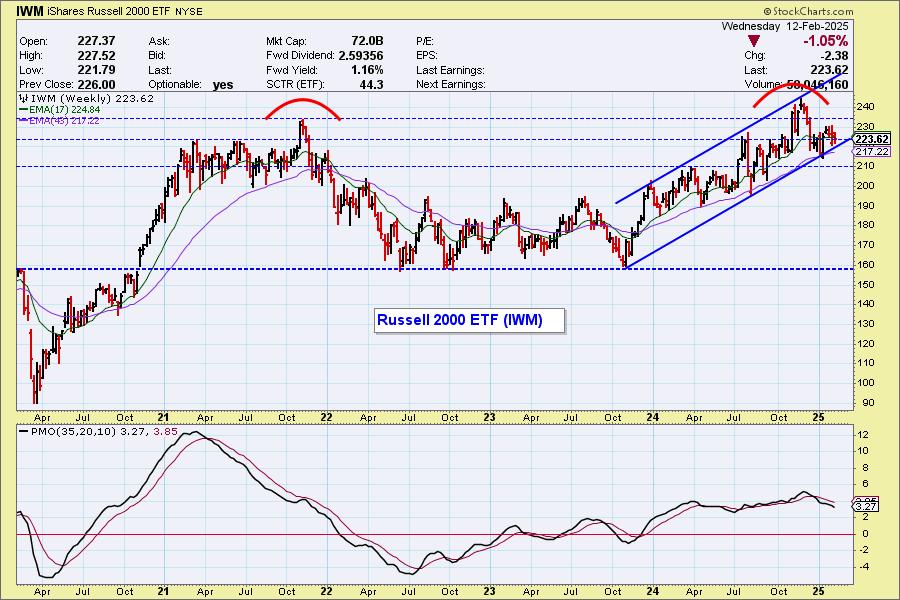
The weekly IWM chart shows a long-term double top, but the rising trend channel is still intact. The weekly PMO is in decline and price did not test the top of the rising trend channel before reversing suggesting this rising trendline is vulnerable.
___________
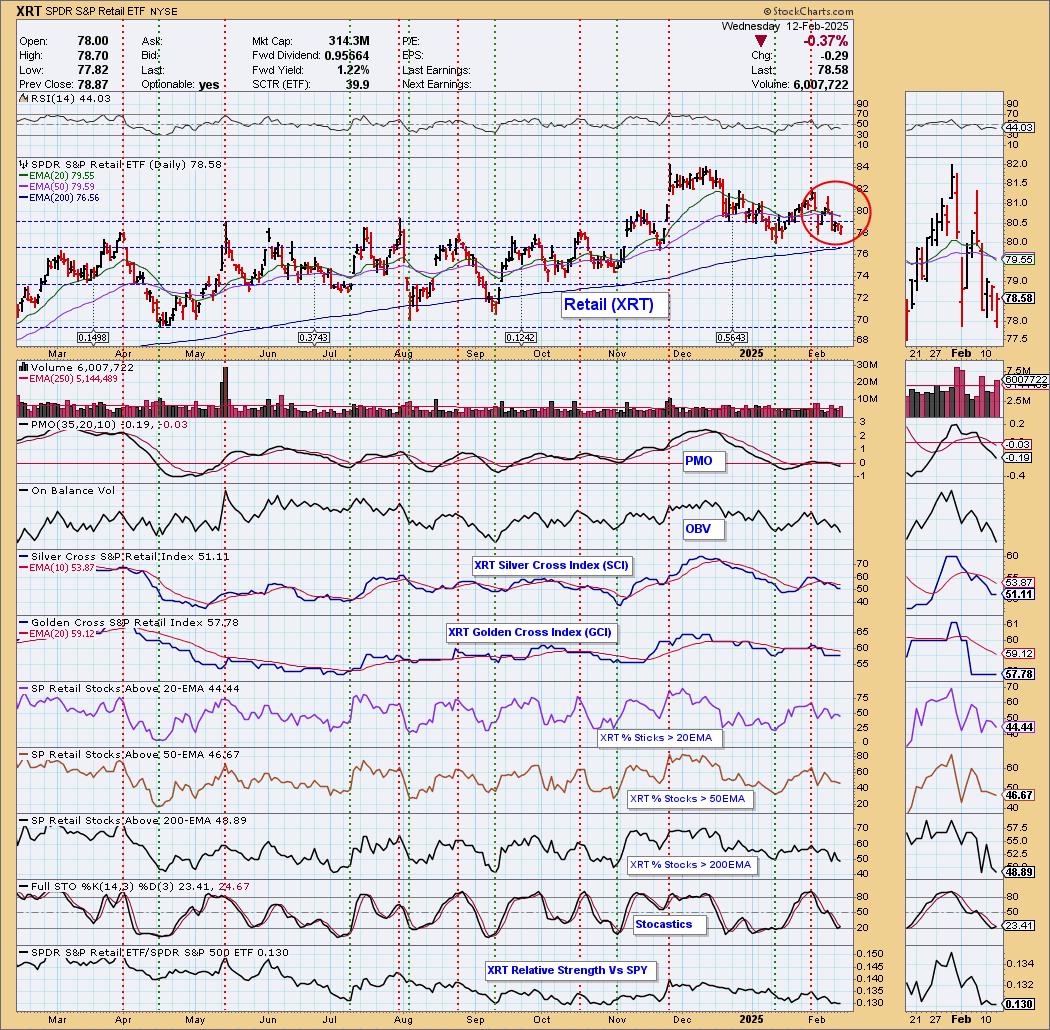
Also today, the Retail ETF (XRT) 20-day EMA crossed down through the 50-day EMA (Dark Cross), above the 200-day EMA, generating an IT Trend Model NEUTRAL Signal. Support is near, but we have a double top. The PMO is in decline and participation is trending lower. Support is vulnerable.
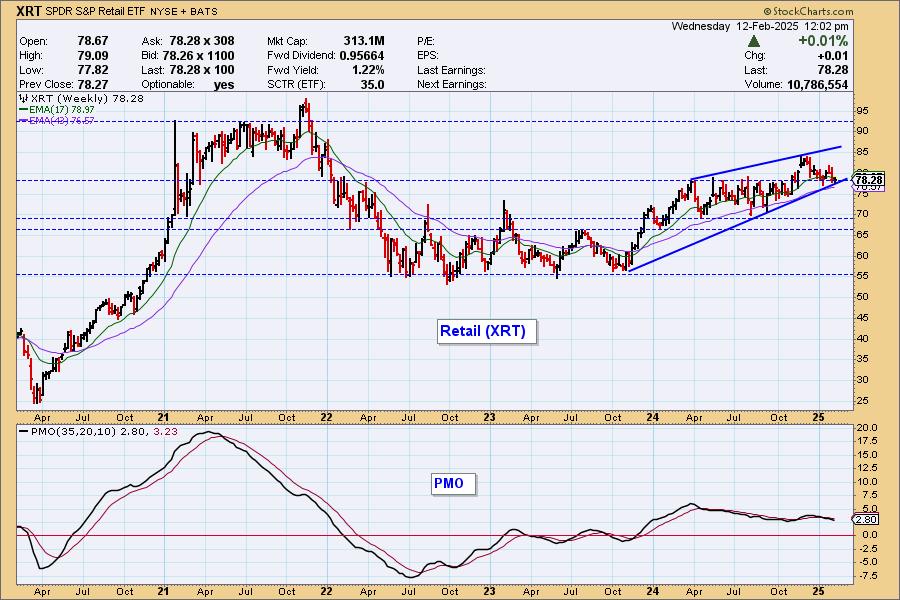
The XRT weekly chart has a large rising wedge, which will likely have a bearish outcome. The weekly PMO is in agreement.
___________
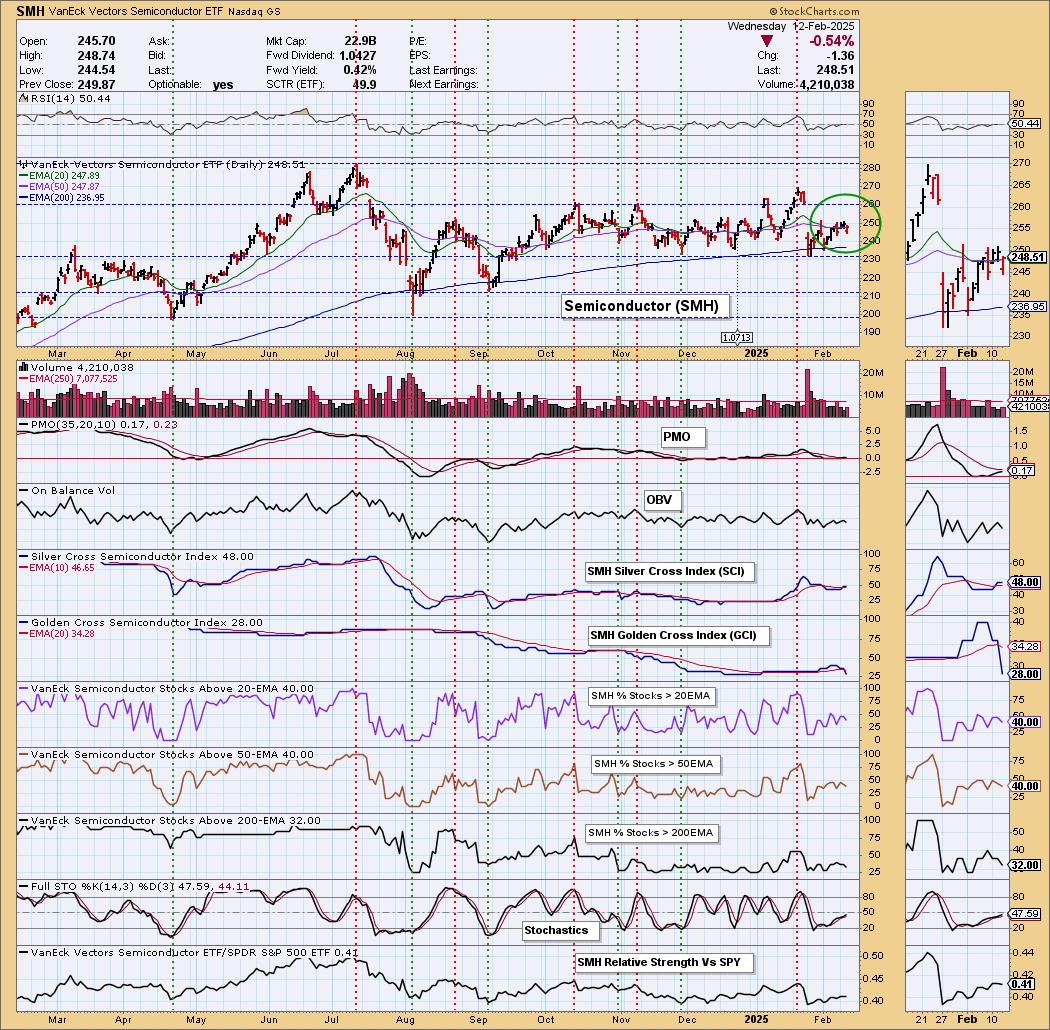
Finally, the Semiconductor ETF (SMH) 20-day EMA crossed up through the 50-day EMA (Silver Cross), generating an IT Trend Model BUY Signal. It's another whipsaw signal, giving us no clear sign of price breaking out of the trading range. The chart isn't that bearish given participation is technically in a rising trend and the PMO is nearing a Crossover BUY Signal, but it does appear price is curling over. We don't expect much out of this signal. A drop beneath the 50-day EMA will cancel the signal out.
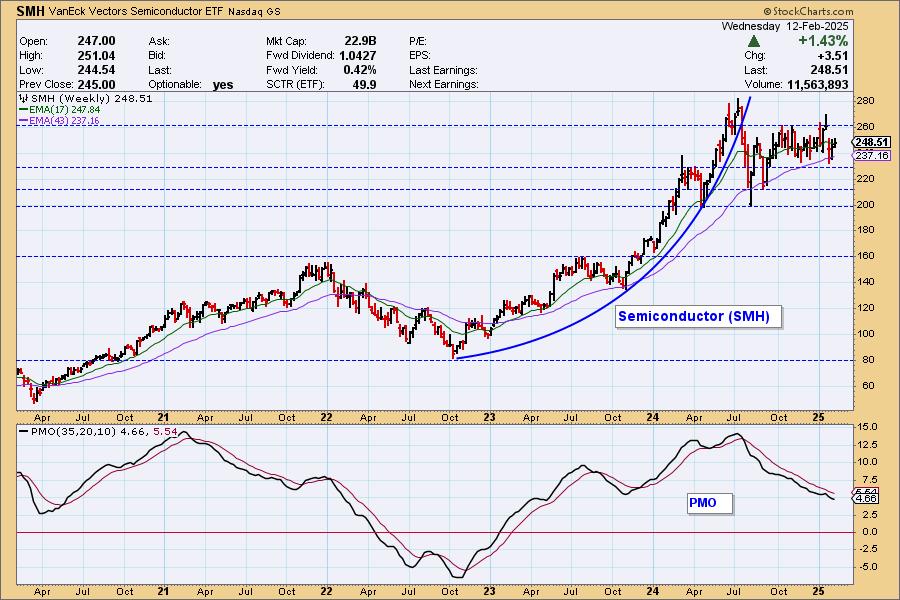
The SMH weekly chart shows a broken parabolic advance, followed by what appears to be a high-level consolidation. The weekly PMO is in decline below its signal line. Price is going nowhere.
The DecisionPoint Alert Weekly Wrap presents an end-of-week assessment of the trend and condition of the Stock Market, the U.S. Dollar, Gold, Crude Oil, and Bonds. The DecisionPoint Alert daily report (Monday through Thursday) is abbreviated and gives updates on the Weekly Wrap assessments.
Watch the latest episode of DecisionPoint on our YouTube channel here!
MARKET/INDUSTRY GROUP/SECTOR INDEXES
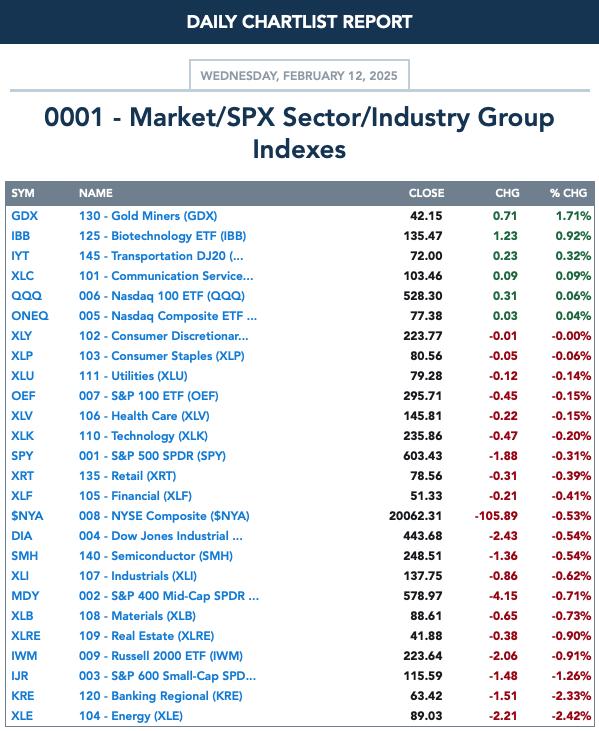
CLICK HERE for Carl's annotated Market Index, Sector, and Industry Group charts.
THE MARKET (S&P 500)
IT Trend Model: BUY as of 8/14/2024
LT Trend Model: BUY as of 3/29/2023
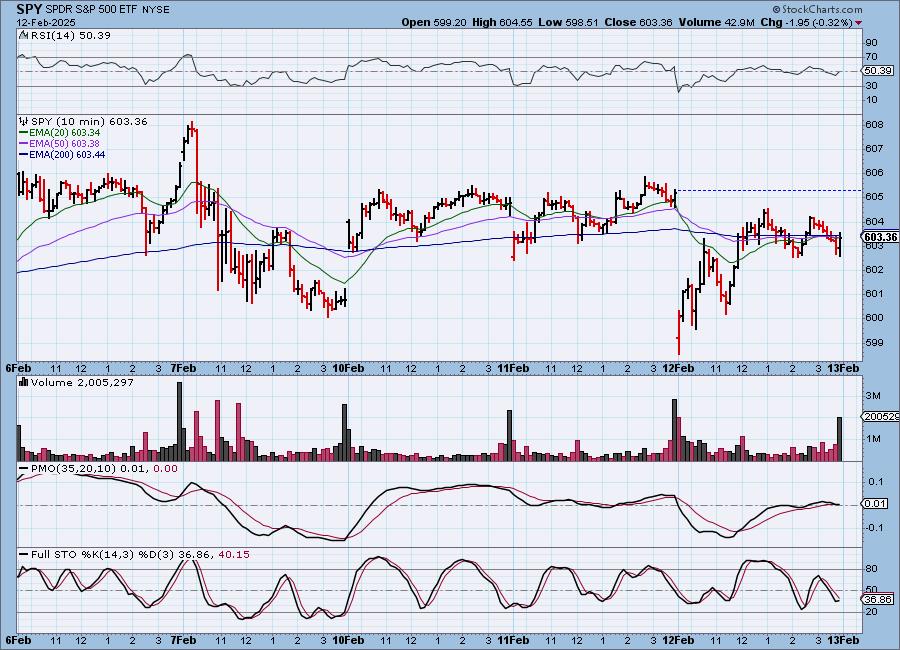
SPY 10-Minute Chart: Price gapped down on the open, but did manage to rise out of those lows. It has now formed a bearish double top and the 10-minute PMO is nearing a Crossover SELL Signal. This doesn't bode well for tomorrow.
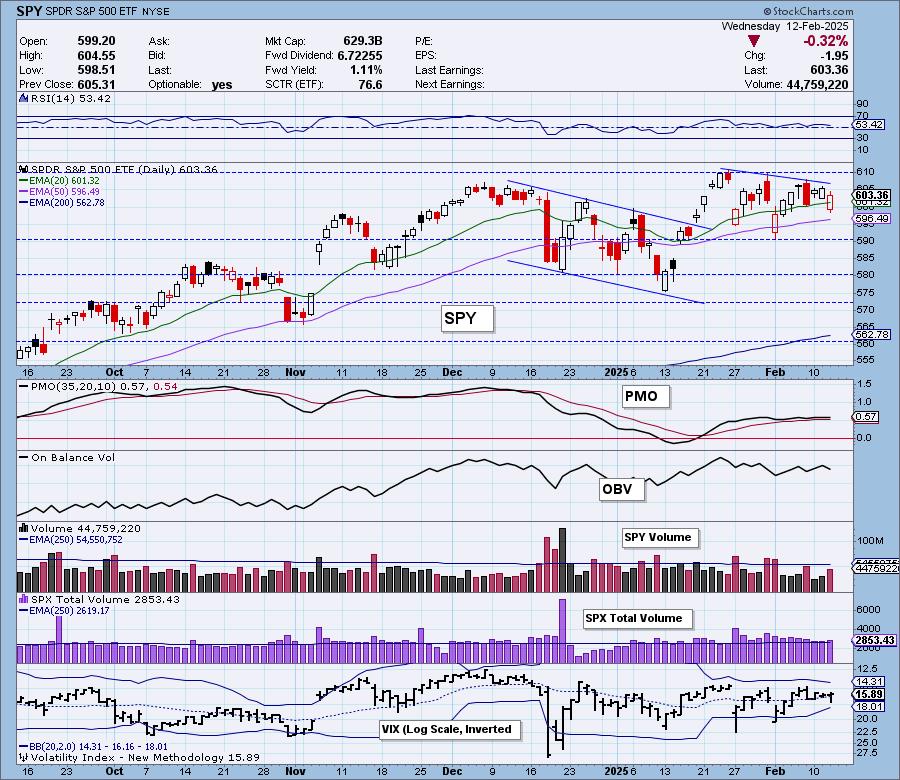
SPY Daily Chart: Yesterday's bullish engulfing candlestick didn't play out as expected. We do have a bullish hollow red candlestick, but the PMO has turned over again. The declining trend is solid.
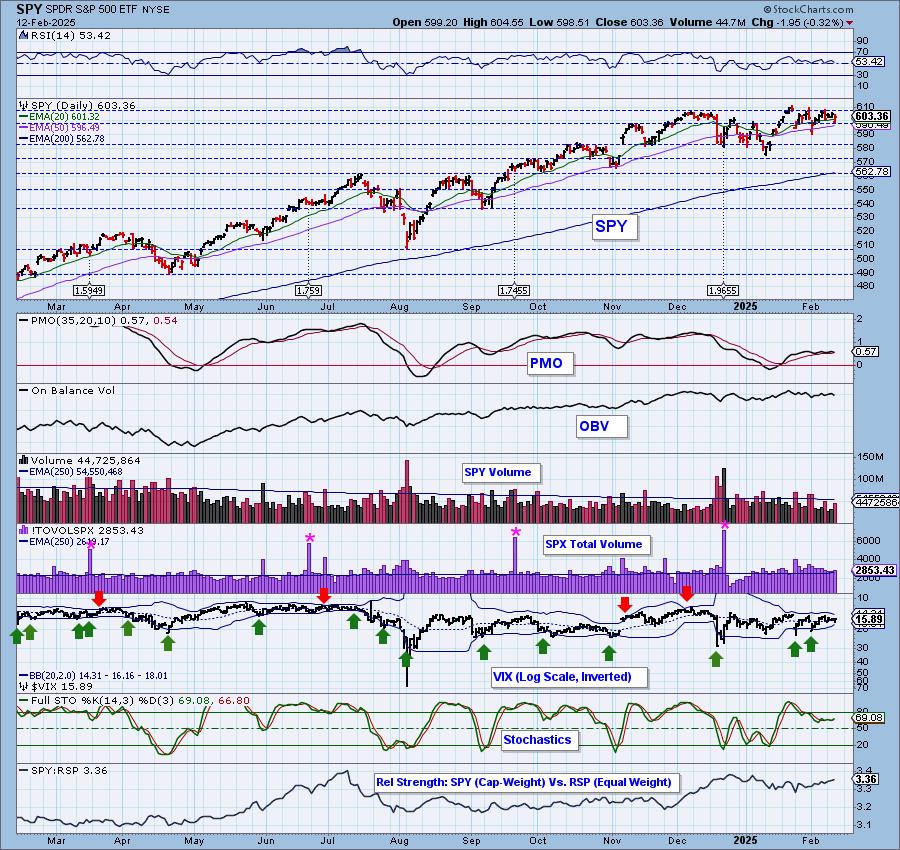
The VIX is technically above its moving average on the inverted scale which is positive, but with Bollinger Bands so close together, it isn't saying much. Stochastics did turn up on the decline which is positive. Mega-caps are leading the charge based on the rising relative strength line to RSP, but with their mixed results, we haven't seen much positive activity suggesting they are weakening not strengthening.

Here is the latest recording from 2/10. Click HERE to get to our video list.:
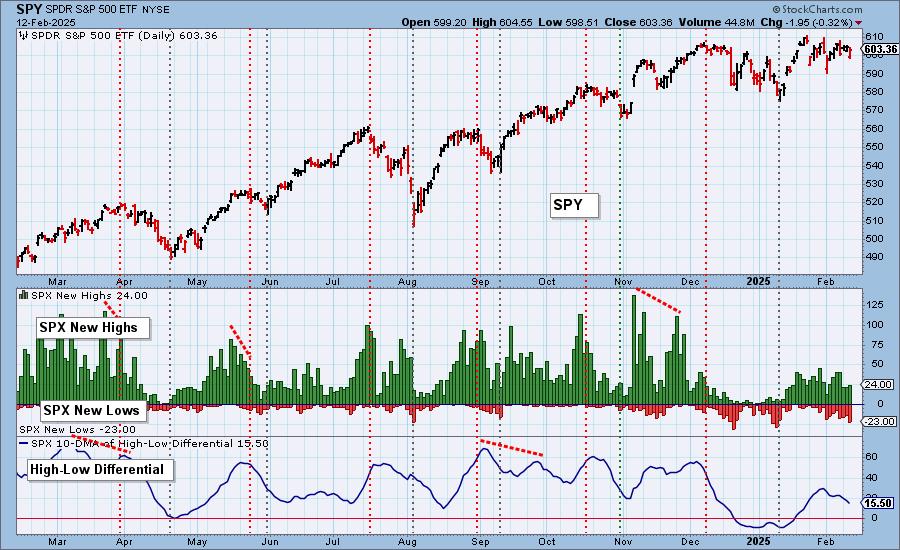
S&P 500 New 52-Week Highs/Lows: New Lows popped on today's decline essentially confirming it. We did see more New Highs though. The High-Low Differential has been in decline since the last time we made all-time highs. It suggests further weakness.
Climax* Analysis: There were no climax readings today.
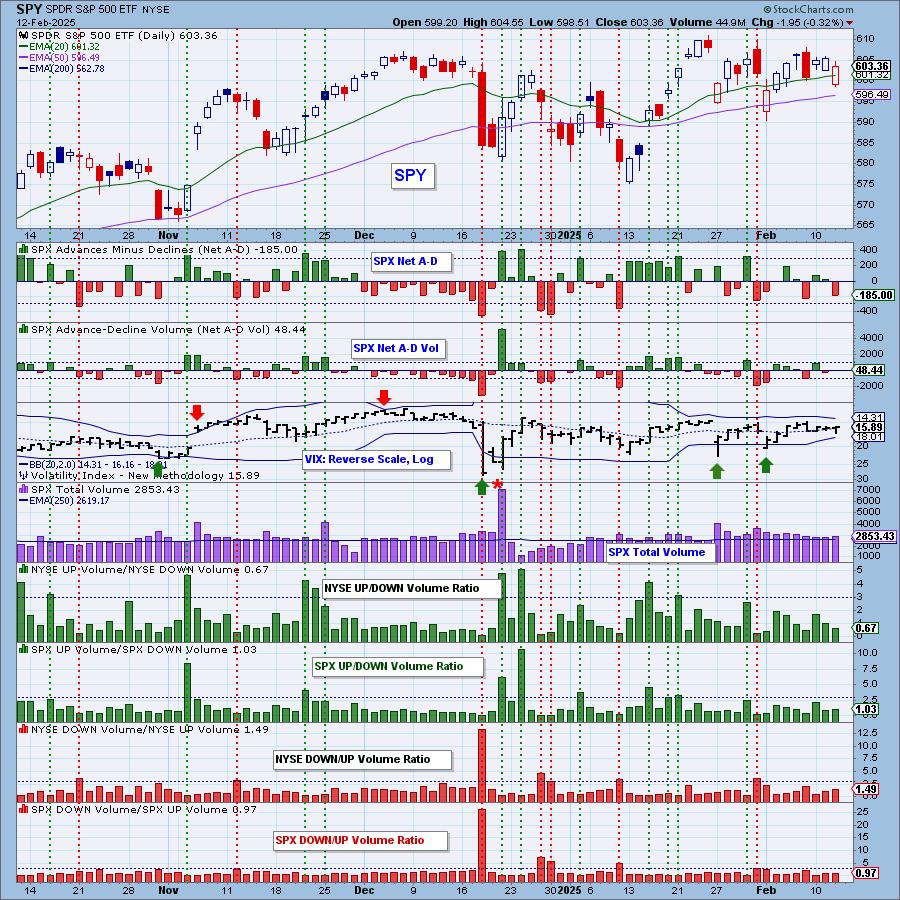
*A climax is a one-day event when market action generates very high readings in, primarily, breadth and volume indicators. We also include the VIX, watching for it to penetrate outside the Bollinger Band envelope. The vertical dotted lines mark climax days -- red for downside climaxes, and green for upside. Climaxes are at their core exhaustion events; however, at price pivots they may be initiating a change of trend.
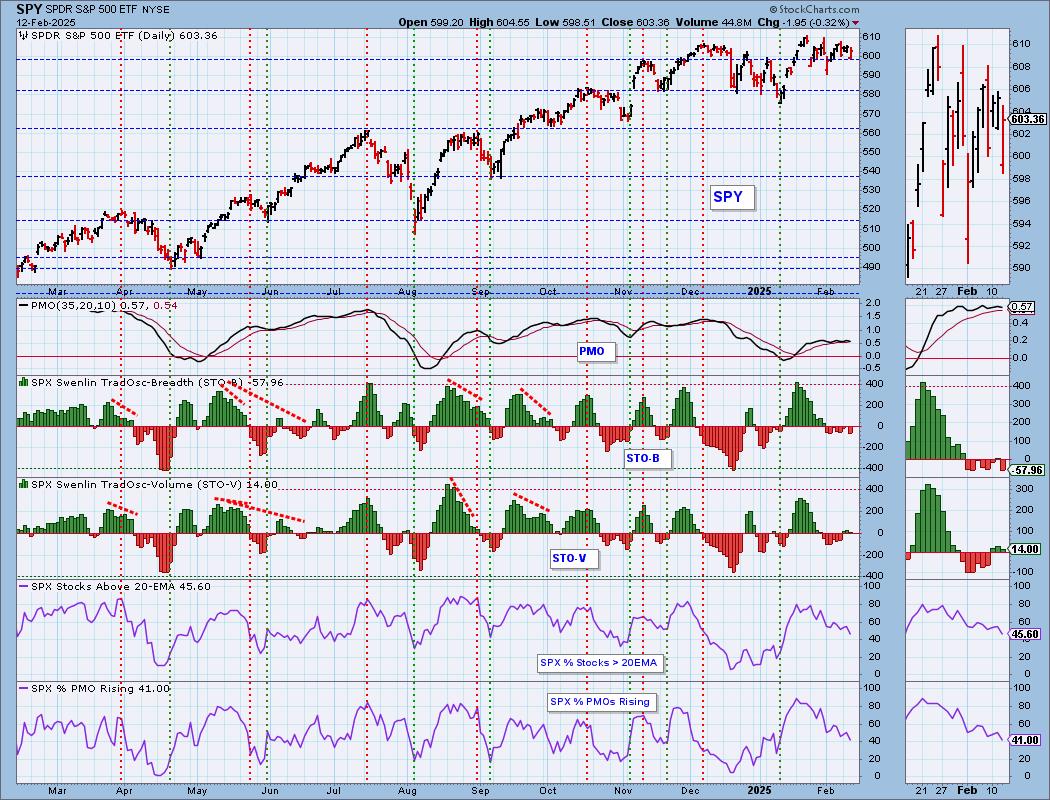
Short-Term Market Indicators: The short-term market trend is DOWN and the condition is NEUTRAL.
The Swenlin Trading Oscillators (STOs) have now topped. Add this to the declining participation reading and low reading on rising PMOs and it does suggest a top may be in.
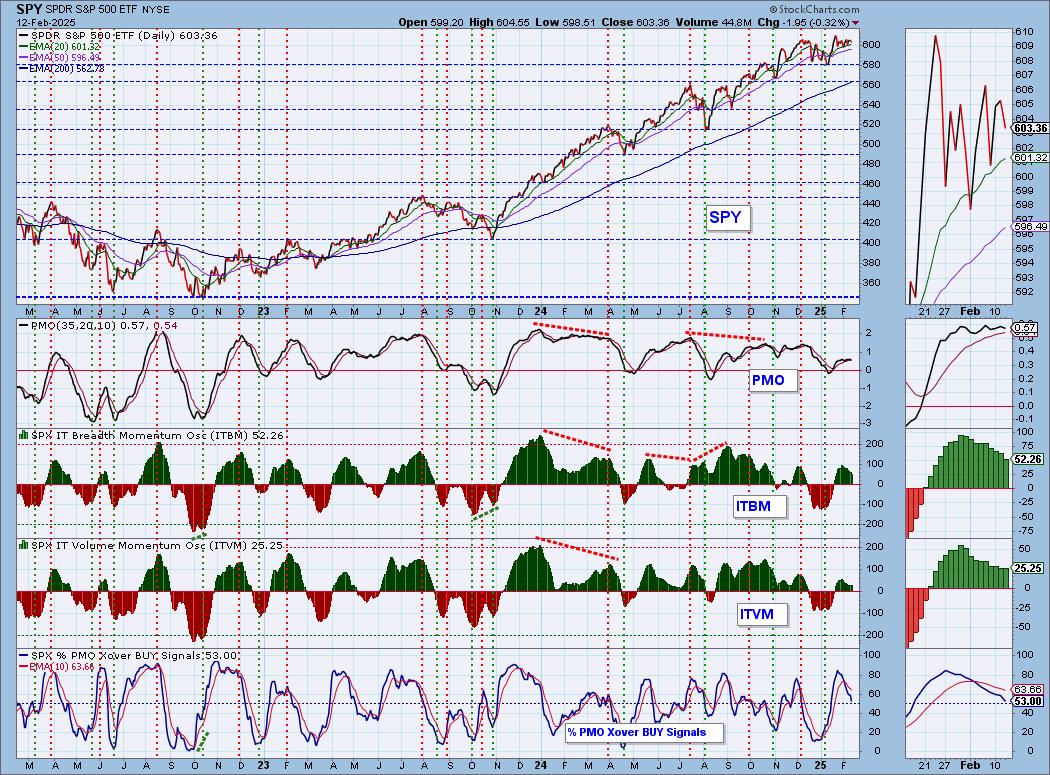
Intermediate-Term Market Indicators: The intermediate-term market trend is UP and the condition is NEUTRAL.
The ITBM and ITVM haven't wavered in their decline so they are definitely confirming the declining STOs. PMO BUY Signals continue to leave the market.
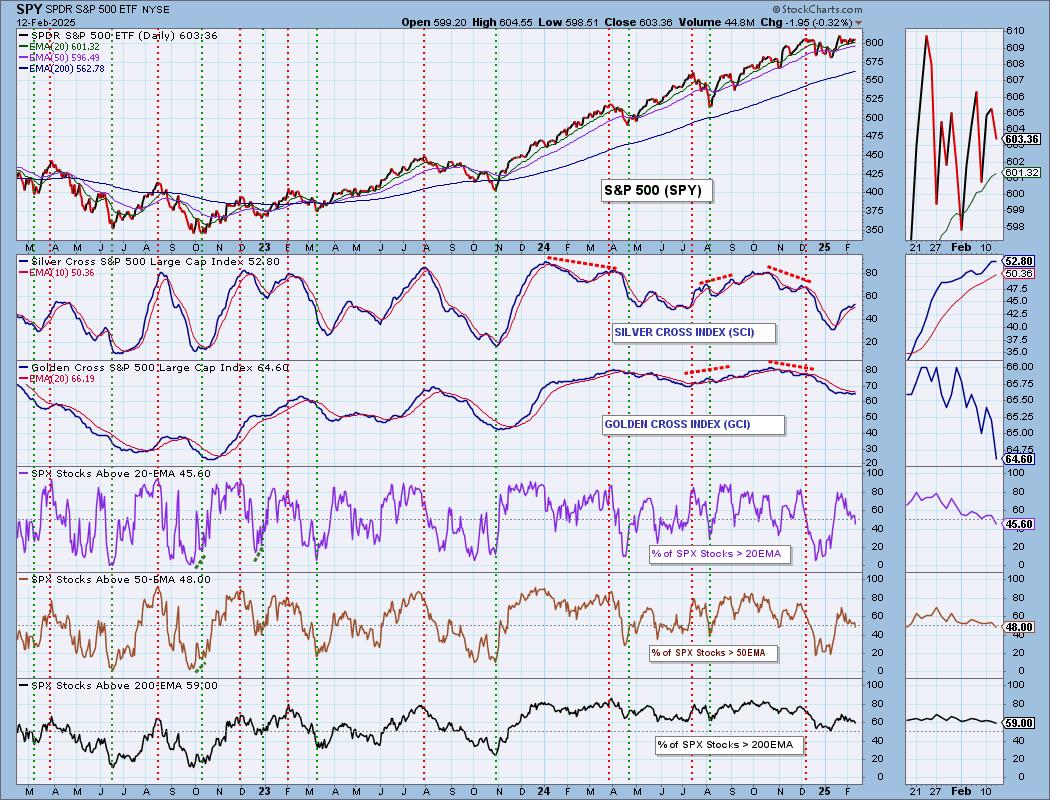
PARTICIPATION CHART (S&P 500): The following chart objectively shows the depth and trend of participation for the SPX in two time frames.
- Intermediate-Term - the Silver Cross Index (SCI) shows the percentage of SPX stocks on IT Trend Model BUY signals (20-EMA > 50-EMA). The opposite of the Silver Cross is a "Dark Cross" -- those stocks are, at the very least, in a correction.
- Long-Term - the Golden Cross Index (GCI) shows the percentage of SPX stocks on LT Trend Model BUY signals (50-EMA > 200-EMA). The opposite of a Golden Cross is the "Death Cross" -- those stocks are in a bear market.
The market bias is BULLISH in the intermediate term.
The market bias is BEARISH in the long term.
Declining trends remain on participation. We now have %Stocks > 20/50EMAs below our bullish 50% threshold. The Silver Cross Index stagnated today likely in preparation for a decline given we continue to lose participation of stocks above their 20/50-day EMAs. It is still above its signal line so the IT Bias must be read as BULLISH. The Golden Cross Index is falling rapidly now and should continue to fall given we have fewer stocks above their 200-day EMAs as compared to the percentage of stocks with Golden Crosses. The Golden Cross Index is below its signal line so the LT Bias is BEARISH.
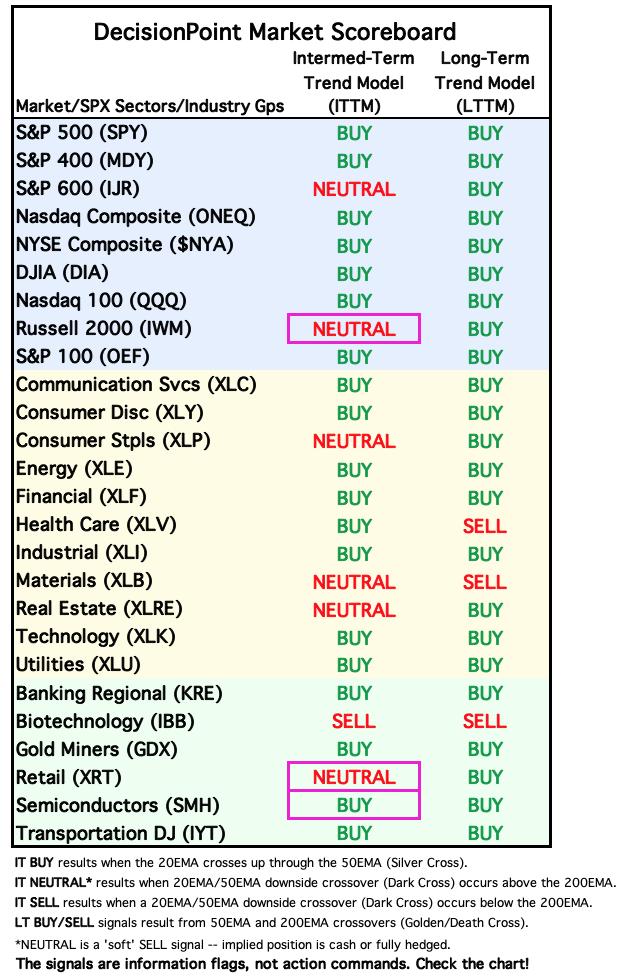
BIAS Assessment: The following table expresses the current BIAS of various price indexes based upon the relationship of the Silver Cross Index to its 10-day EMA (intermediate-term), and of the Golden Cross Index to its 20-day EMA (long-term). When the Index is above the EMA it is bullish, and it is bearish when the Index is below the EMA. The BIAS does not imply that any particular action should be taken. It is information to be used in the decision process.
The items with highlighted borders indicate that the BIAS changed today.

*****************************************************************************************************
CONCLUSION: We would suggest that we are near or at a market top. The PMO and STOs turned back down today. We've already been losing participation and now it is below our bullish 50% threshold on %Stocks > 20/50EMAs. The ITBM and ITVM are confirming declining STOs with their own decline. There are some bullish signs, but not enough to tell us to expect big gains. Stochastics are rising and the VIX is above its moving average on the inverted scale, but in totality these are slim bullish indications given the bearish construct of nearly all of our indicators. Jobless claims and the PPI report are due tomorrow. Inflation appears sticky so these reports could confirm this and take the market down further. Good reports could push us to higher prices, but we just don't see it lasting.
Erin is 15% long, 0% short. (This is intended as information, not a recommendation.)
*****************************************************************************************************
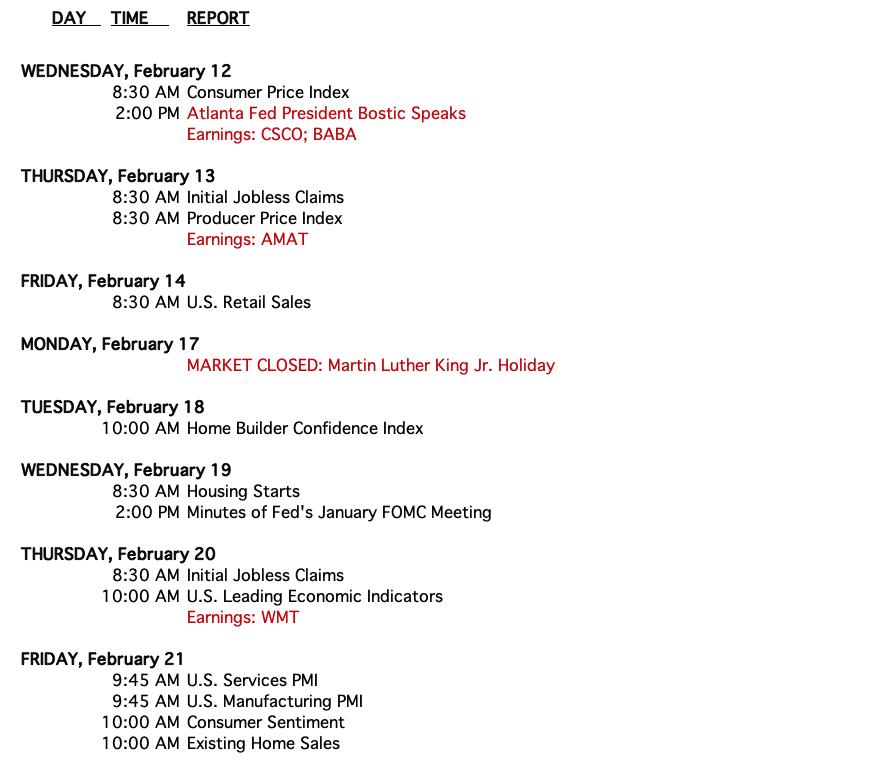
CALENDAR
Have you subscribed the DecisionPoint Diamonds yet? DP does the work for you by providing handpicked stocks/ETFs from exclusive DP scans! Add it with a discount! Contact support@decisionpoint.com for more information!
BITCOIN
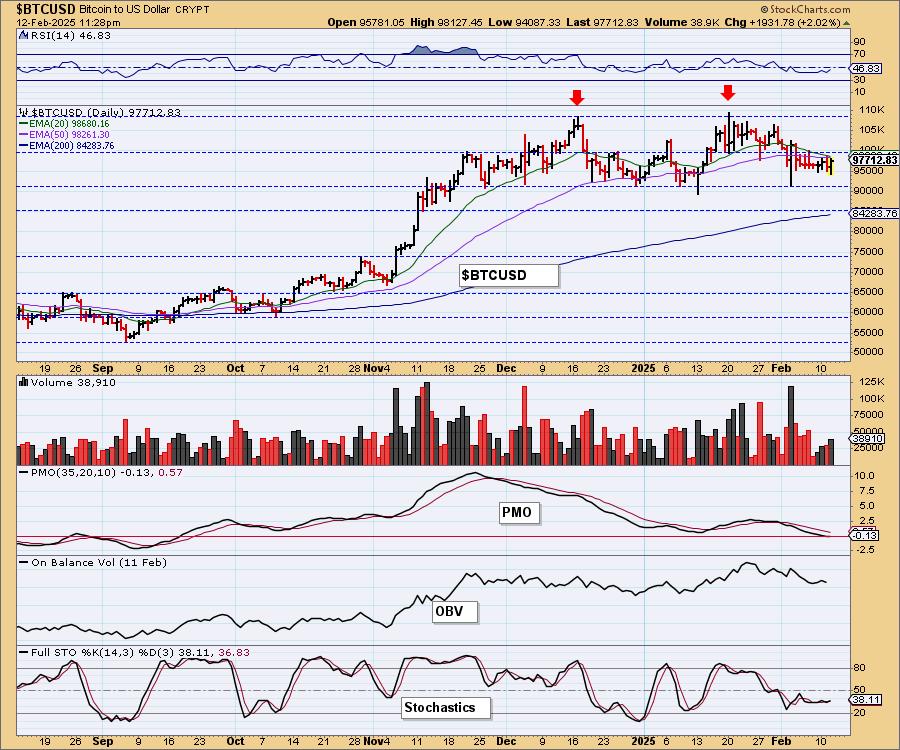
Yesterday's comments still apply:
"Bitcoin is consolidating sideways after its big run higher after the election. It is now in a declining trend headed to test support. The PMO is declining and Stochastics are in negative territory below net neutral (50). The RSI is also in negative territory. Our expectation is another test of support at 90,000." The PMO is now in negative territory.
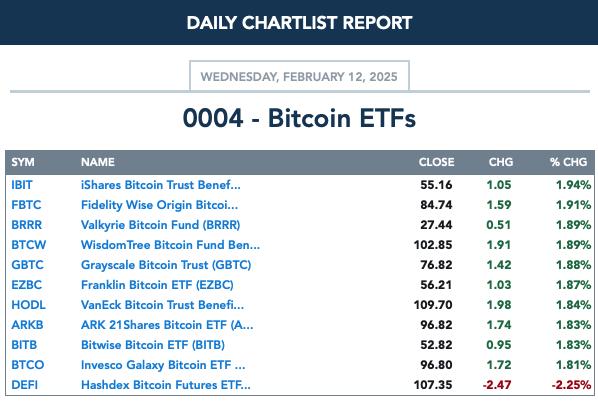
BITCOIN ETFs
INTEREST RATES
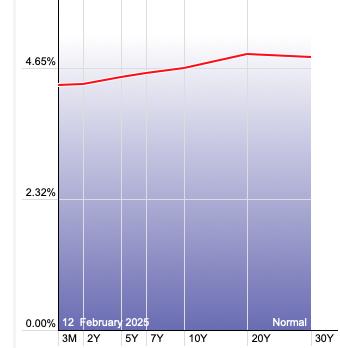
We believe yields are going to continue rising as declining trends are now being broken.
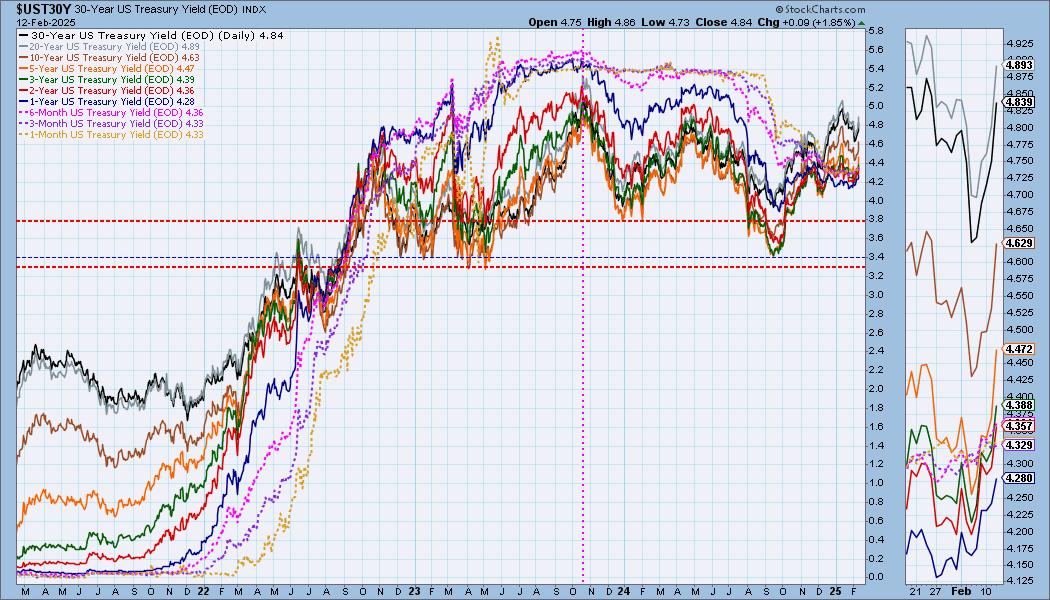
The Yield Curve Chart from StockCharts.com shows us the inversions taking place. The red line should move higher from left to right. Inversions are occurring where it moves downward.
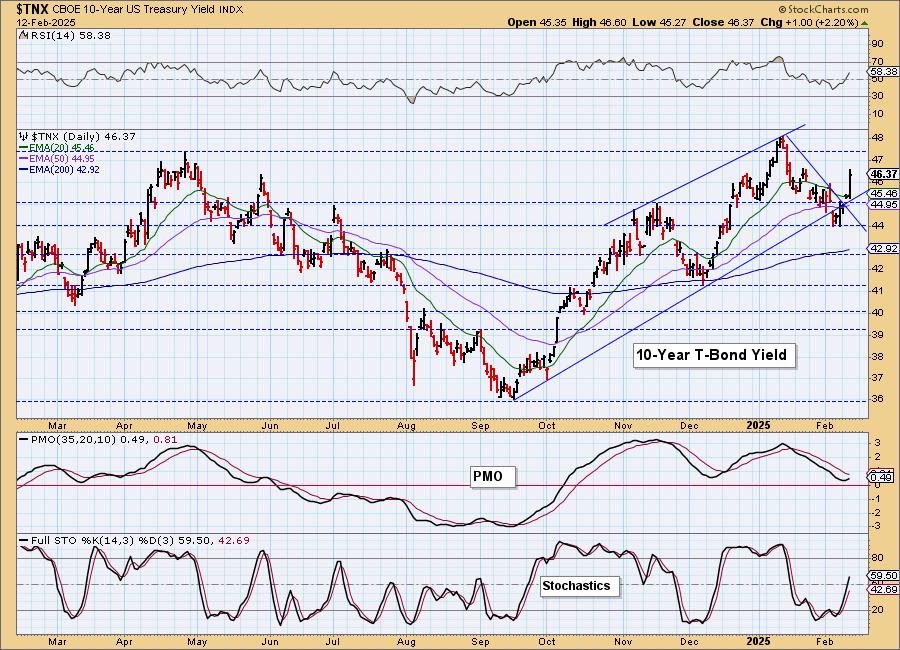
10-YEAR T-BOND YIELD
Yields are reversing and $TNX soared higher today suggesting it will continue rising from here. The indicators are now very bullish with the RSI now positive, the PMO bottoming and Stochastics rising vertically. We'll watch for a test at 4.8%.
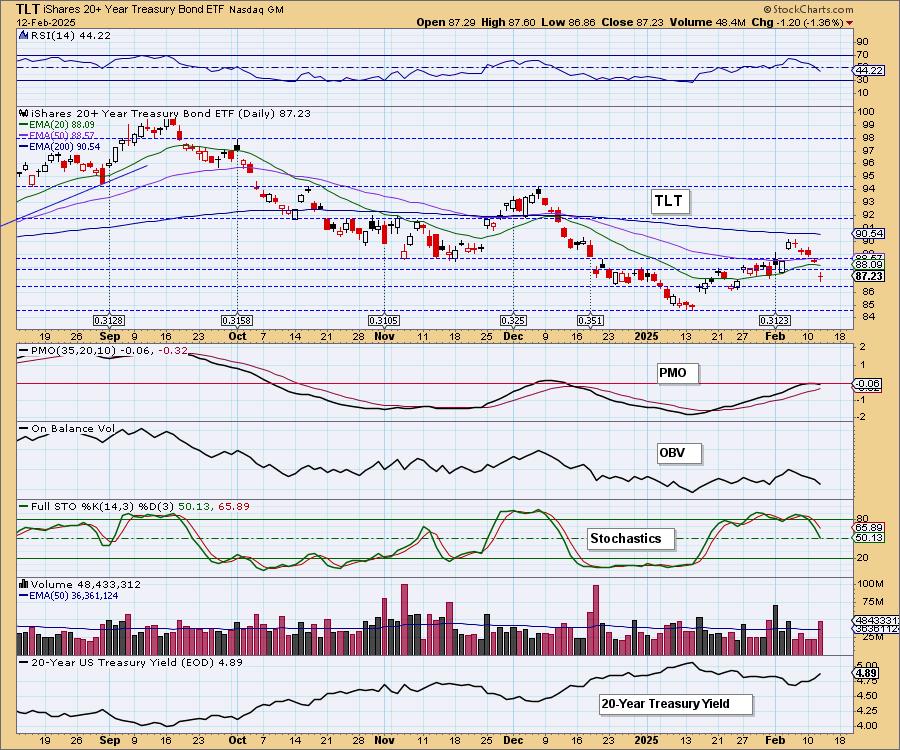
BONDS (TLT)
IT Trend Model: NEUTRAL as of 11/10/2024
LT Trend Model: SELL as of 12/13/2024
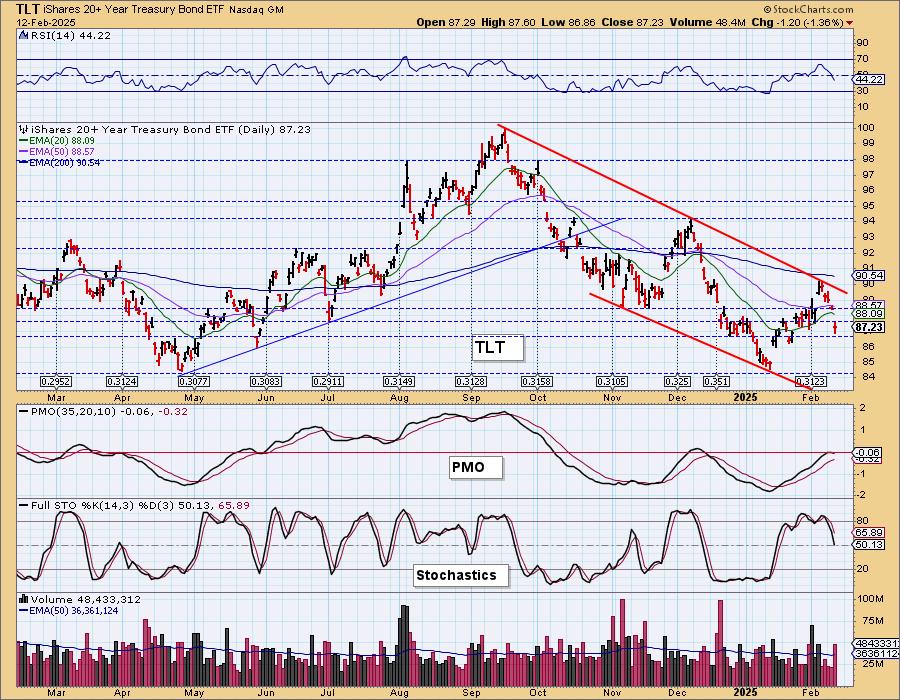
TLT Daily Chart: Yields have reversed and we can see that the 20-year yield has broken its declining trend while TLT has broken its rising trend. Indicators look terrible with the RSI moving into negative territory, the PMO topping near the zero line and Stochastics dropping quickly. Look for a test of this year's low.
It isn't a surprise to see TLT in decline given it had reached the top of its declining trend channel.
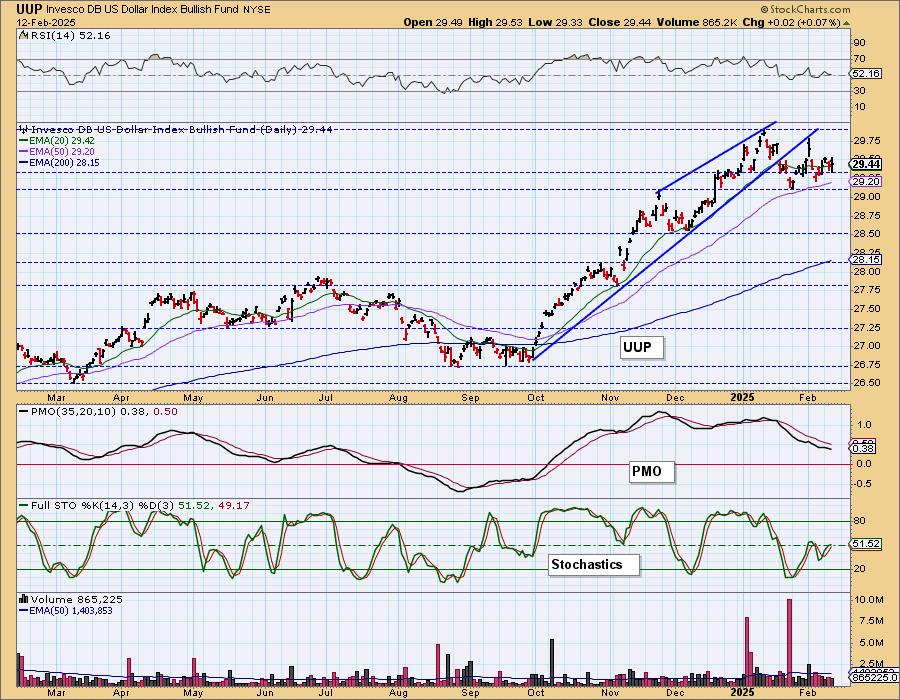
DOLLAR (UUP)
IT Trend Model: BUY as of 10/9/2024
LT Trend Model: BUY as of 5/25/2023
UUP Daily Chart: The Dollar wants to move higher, but ultimately we have a bearish double top on the chart that implies we will see a breakdown below the 2025 low. We checked and the PMO is still moving lower so we don't have any positive momentum to push price higher at this point. Stochastics are rising somewhat, but we are still bearish here.
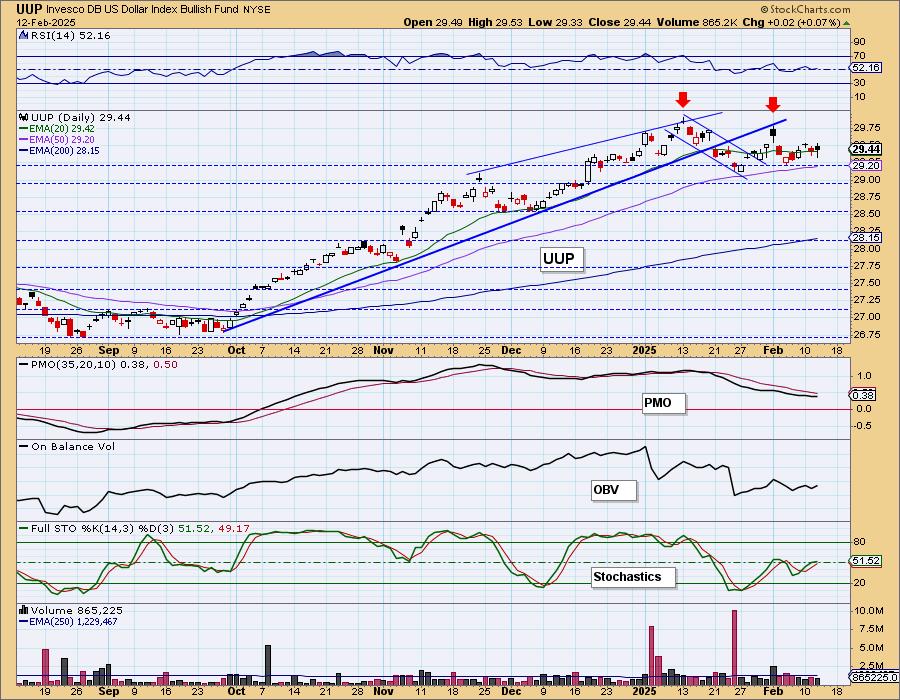
The double top pattern won't be busted unless we get a breakout above the tops.
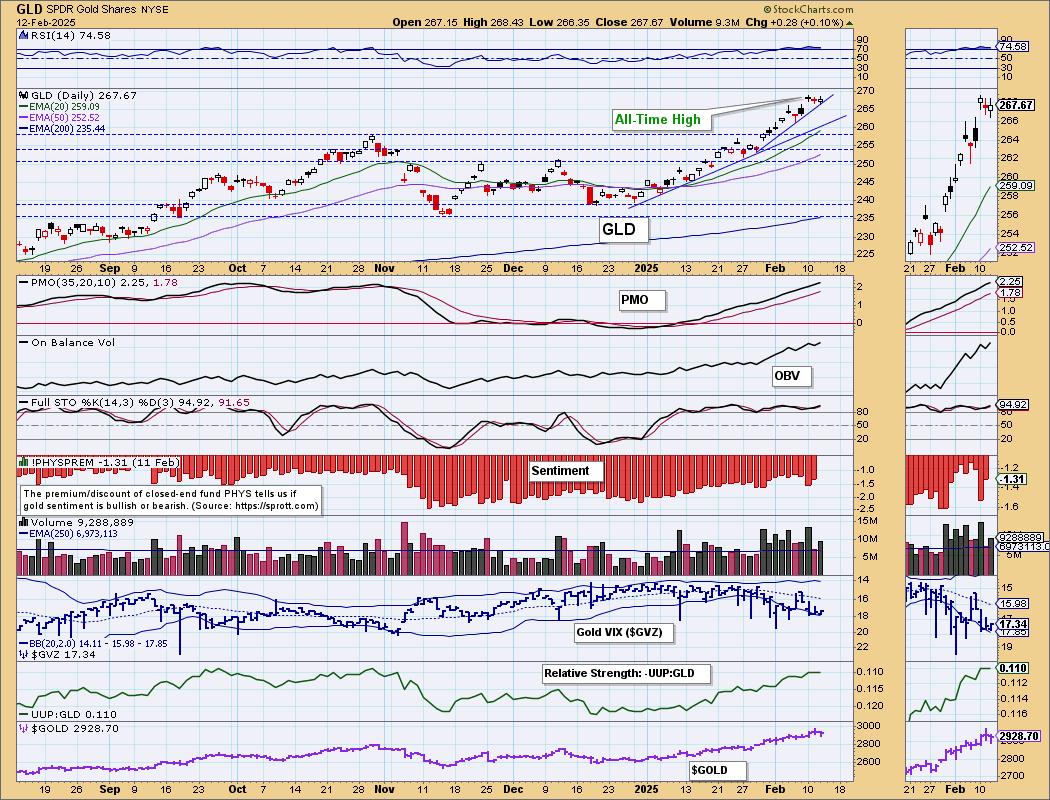
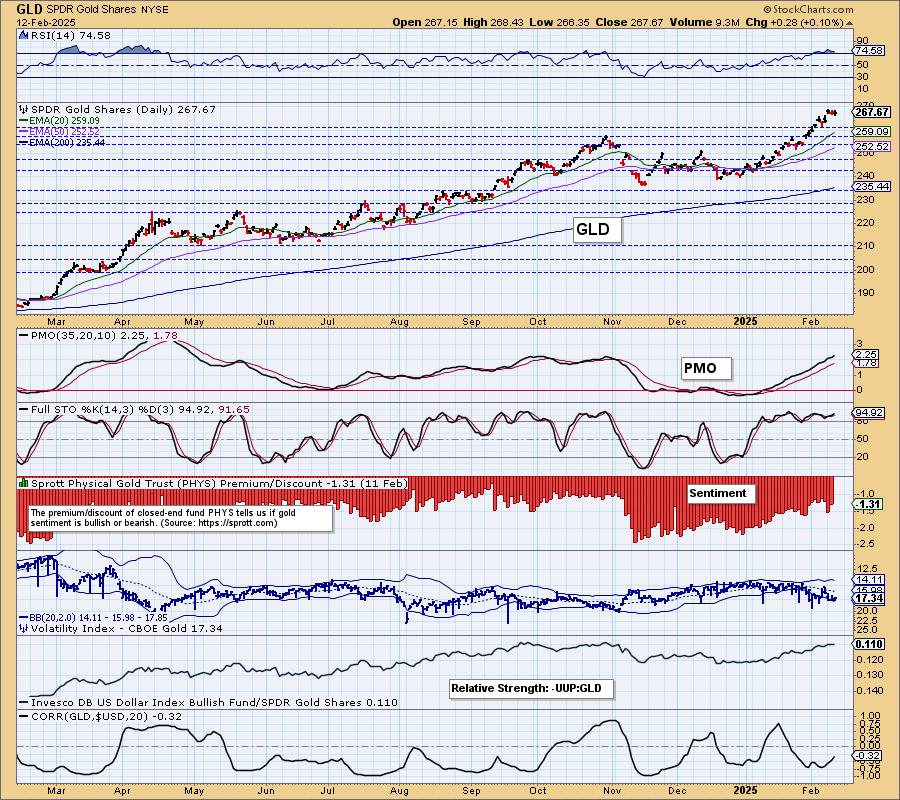
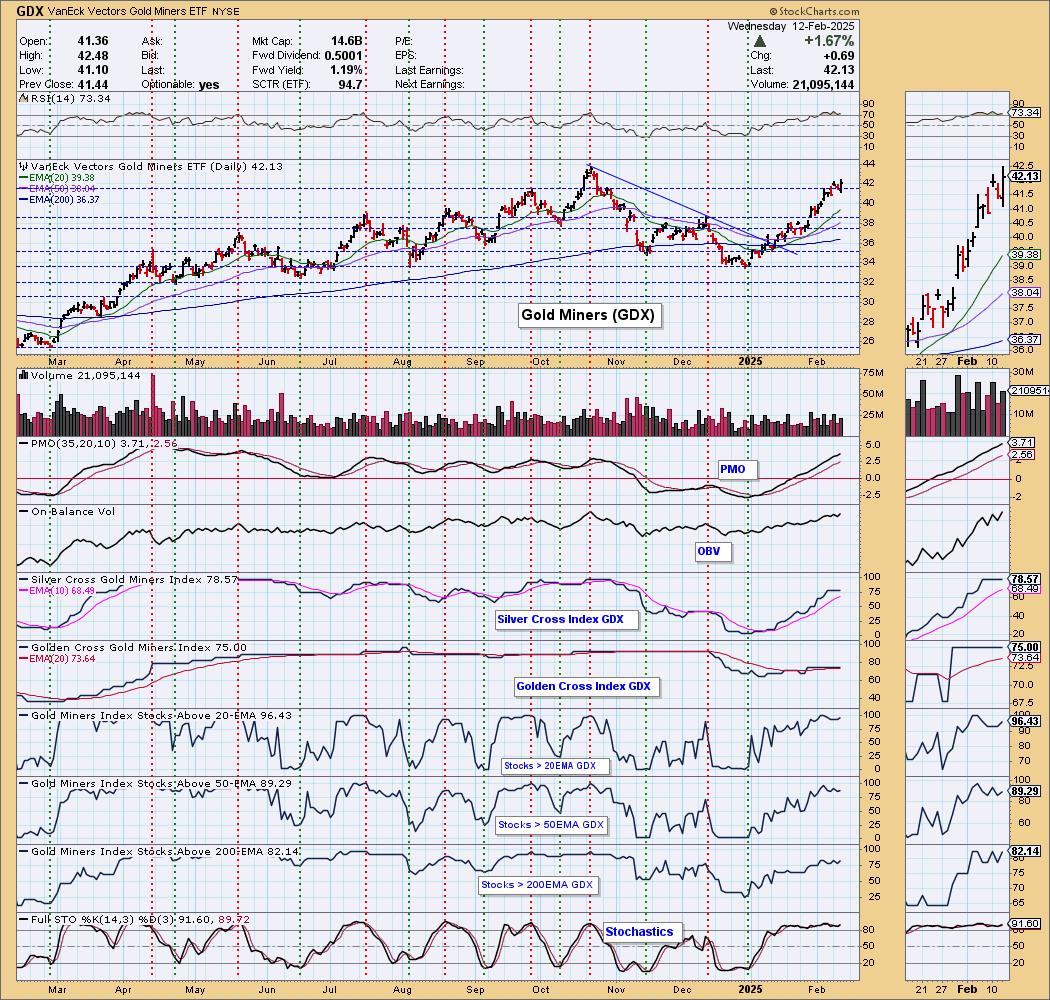
GOLD
IT Trend Model: BUY as of 1/10/2025
LT Trend Model: BUY as of 10/20/2023
GLD Daily Chart: Gold was up very slightly but that is positive given the Dollar also rose today. We have a steeper rising trend that will be a bit harder to maintain. The RSI is overbought so we continue to look for a pause in the rally. Other than the RSI, indicators look very bullish. We even have a rising relative strength line against the Dollar so we could see price inch even higher from here, but it is overdue for a pause or decline.
GOLD MINERS (GDX) Daily Chart: Gold Miners rallied strongly even though Gold was barely up today. The group is very bullish, but as with Gold, we expect to see a pause or pullback soon. Resistance will be strong at the October high. Maybe that's where we should look for a pullback. Participation remains strong with a BULLISH Bias on both the Silver and Golden Cross Indexes.
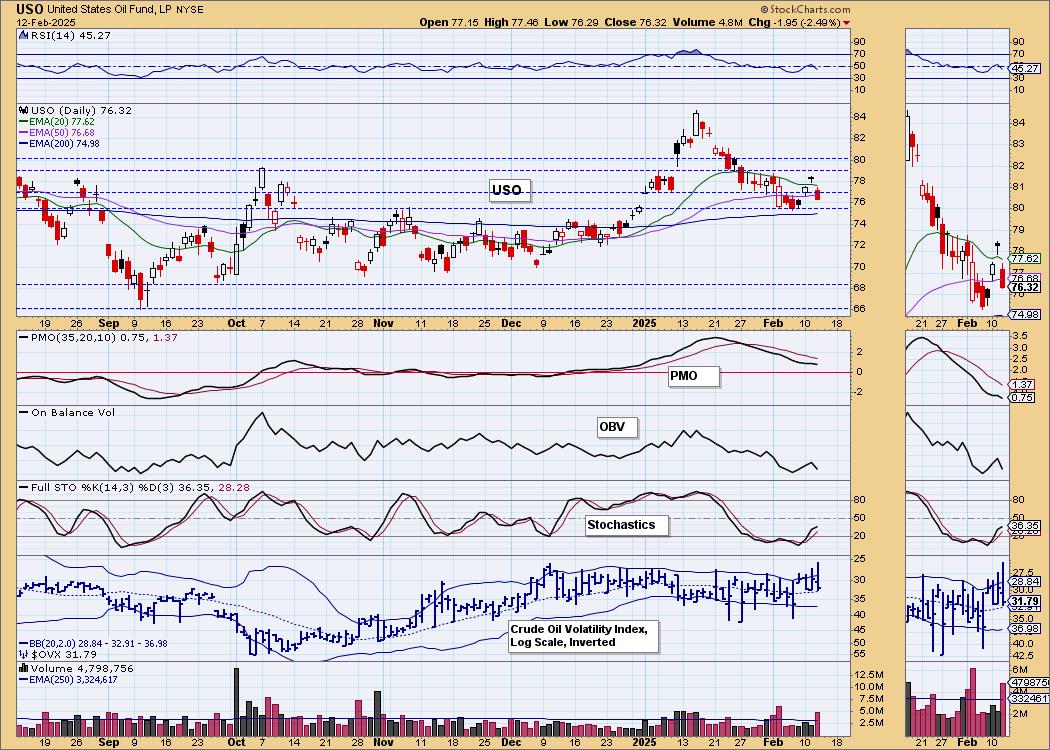
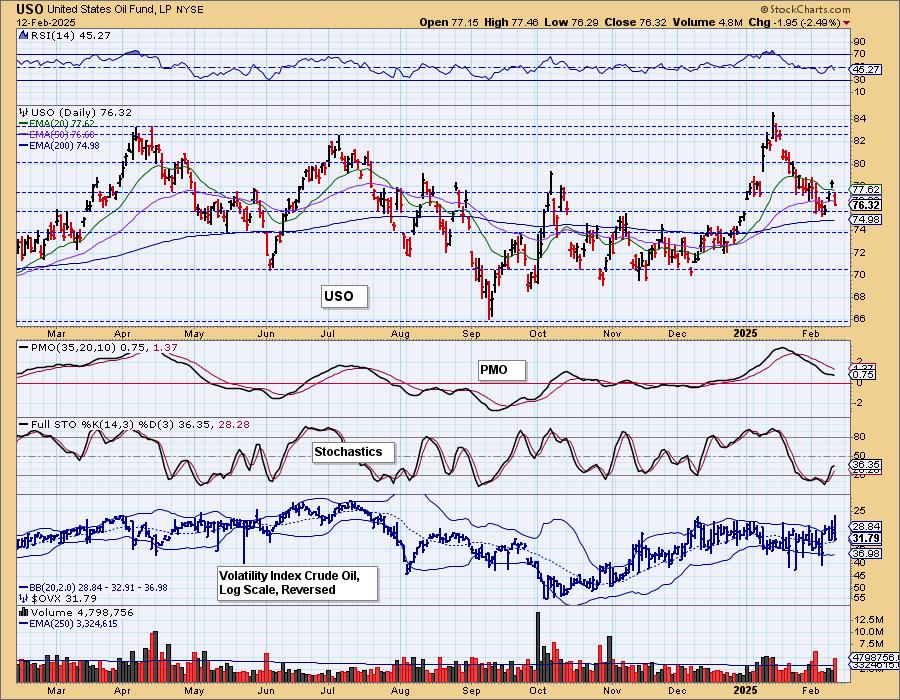
CRUDE OIL (USO)
IT Trend Model: BUY as of 12/24/2024
LT Trend Model: BUY as of 1/10/2025
USO Daily Chart: The resistance zone between 79 and 80 was too strong for price to push through so this current rally is in jeopardy already. The PMO which had previously decelerated is now accelerating downward. Stochastics give us some hope that the rally will resume. We could see sideways movement below the resistance zone along the 200-day EMA.
Good Luck & Good Trading!
Erin Swenlin and Carl Swenlin
Technical Analysis is a windsock, not a crystal ball. --Carl Swenlin
(c) Copyright 2025 DecisionPoint.com
Disclaimer: This blog is for educational purposes only and should not be construed as financial advice. The ideas and strategies should never be used without first assessing your own personal and financial situation, or without consulting a financial professional. Any opinions expressed herein are solely those of the author, and do not in any way represent the views or opinions of any other person or entity.
DecisionPoint is not a registered investment advisor. Investment and trading decisions are solely your responsibility. DecisionPoint newsletters, blogs or website materials should NOT be interpreted as a recommendation or solicitation to buy or sell any security or to take any specific action.
NOTE: The signal status reported herein is based upon mechanical trading model signals, specifically, the DecisionPoint Trend Model. They define the implied bias of the price index based upon moving average relationships, but they do not necessarily call for a specific action. They are information flags that should prompt chart review. Further, they do not call for continuous buying or selling during the life of the signal. For example, a BUY signal will probably (but not necessarily) return the best results if action is taken soon after the signal is generated. Additional opportunities for buying may be found as price zigzags higher, but the trader must look for optimum entry points. Conversely, exit points to preserve gains (or minimize losses) may be evident before the model mechanically closes the signal.
Helpful DecisionPoint Links:
DecisionPoint Alert Chart List
DecisionPoint Golden Cross/Silver Cross Index Chart List
DecisionPoint Sector Chart List
Price Momentum Oscillator (PMO)