
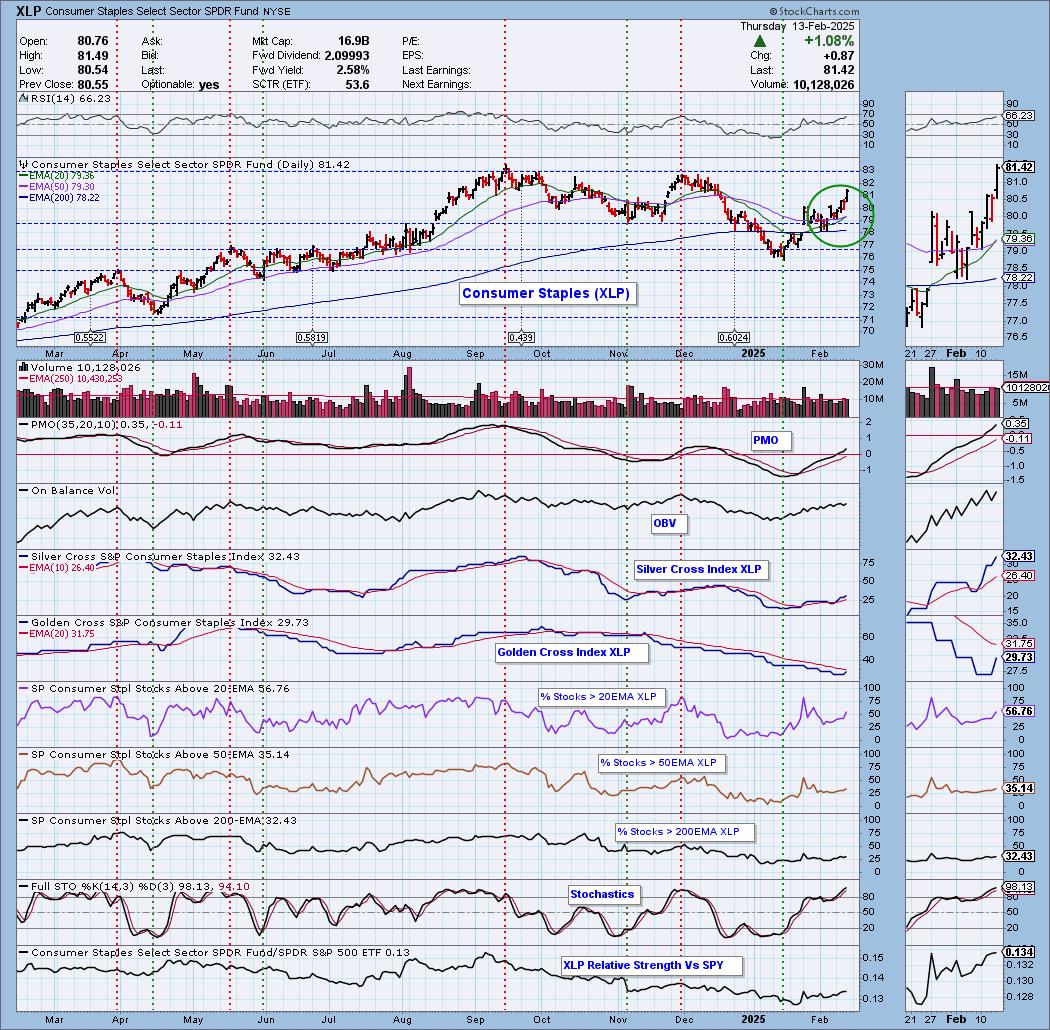
Today the Consumer Staples Sector (XLP) 20-day EMA crossed up through the 50-day EMA (Silver Cross), generating an IT Trend Model BUY Signal. This defensive sector has been on a solid rally. When defensive sectors lead, we are often near a market top. This looks like a good signal that implies a move to at least test overhead resistance at 83.00. Participation is improving, but has much more room for improvement. Stochastics look very bullish above 80.
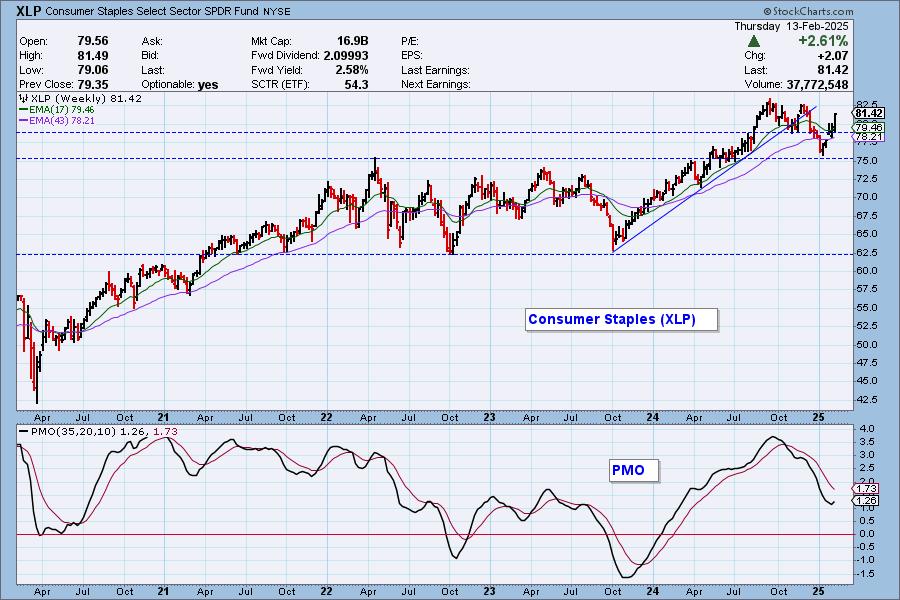
The XLP weekly chart shows a breakdown from a double top, a correction almost down to the minimum downside target, then a rebound back above the confirmation line. The declining trend hasn't been broken yet. The weekly PMO did turn up on this week's rally.
The DecisionPoint Alert Weekly Wrap presents an end-of-week assessment of the trend and condition of the Stock Market, the U.S. Dollar, Gold, Crude Oil, and Bonds. The DecisionPoint Alert daily report (Monday through Thursday) is abbreviated and gives updates on the Weekly Wrap assessments.
Watch the latest episode of DecisionPoint on our YouTube channel here!
MARKET/INDUSTRY GROUP/SECTOR INDEXES
CLICK HERE for Carl's annotated Market Index, Sector, and Industry Group charts.
THE MARKET (S&P 500)
IT Trend Model: BUY as of 8/14/2024
LT Trend Model: BUY as of 3/29/2023
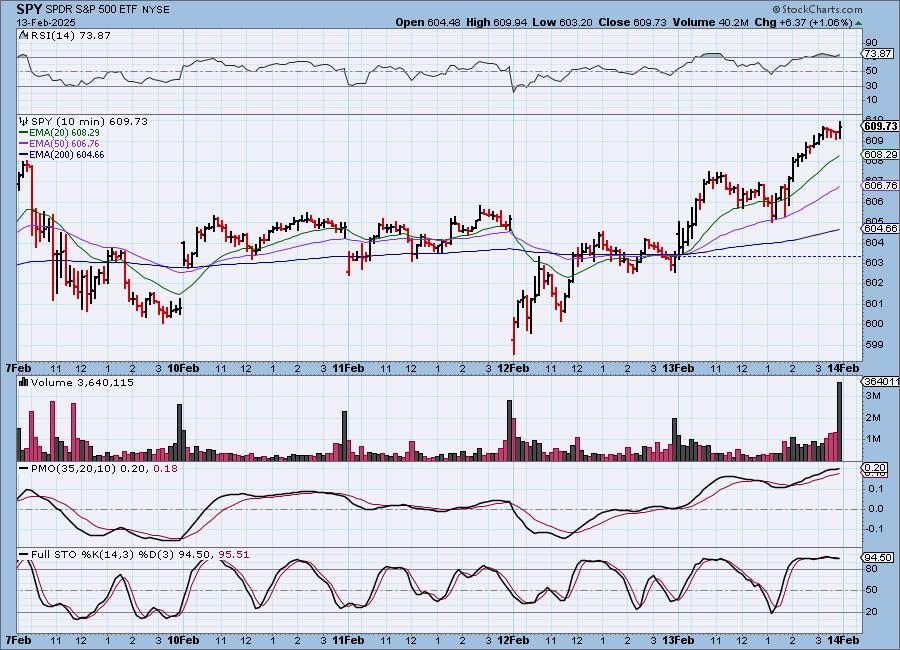
SPY 10-Minute Chart: In spite of yesterday's double top, the market made a strong move higher in the morning. It closed near the high of the day. The 10-minute PMO is rising, but did flatten out. Stochastics look very bullish.
SPY Daily Chart: The January 23 close was an all-time closing high. Today SPY came with 0.03 of setting a new, all-time high. Close but no cigar. The declining trend was broken and the PMO is rising again giving us a "Surge" above the signal line.
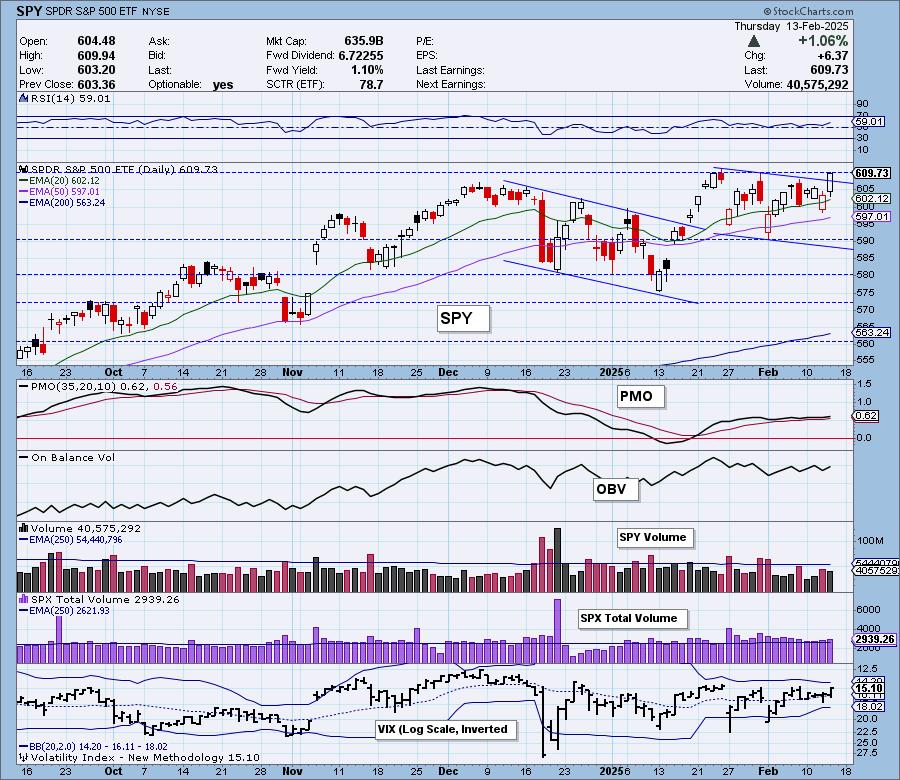
The mega-caps are showed strength today as the rising relative strength line to RSP suggests. If they can hold it together, we could see prices rise further while the internals of the index continue to weaken. The VIX is above its moving average on the inverted scale and Stochastics are rising.

Here is the latest recording from 2/10. Click HERE to get to our video list.:
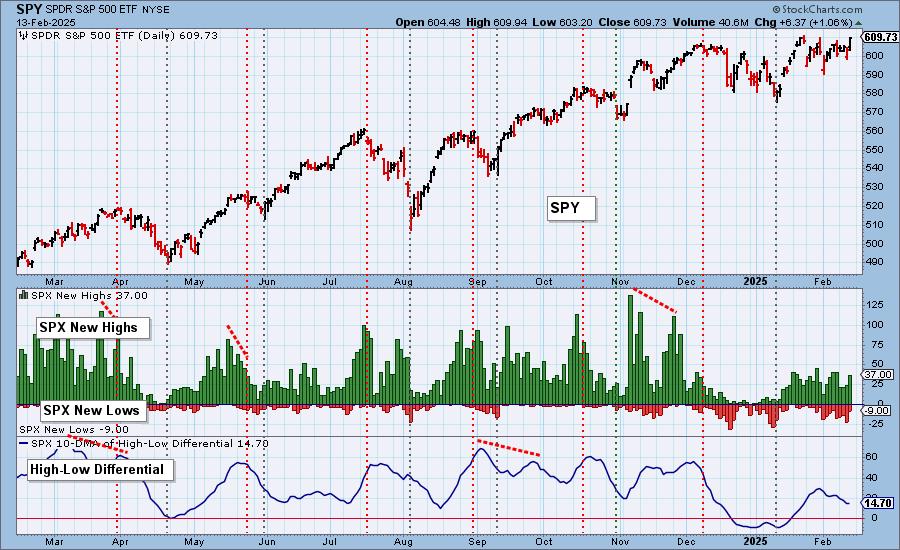
S&P 500 New 52-Week Highs/Lows: New Highs popped today and New Lows pared back. We still have a declining High-Low Differential.
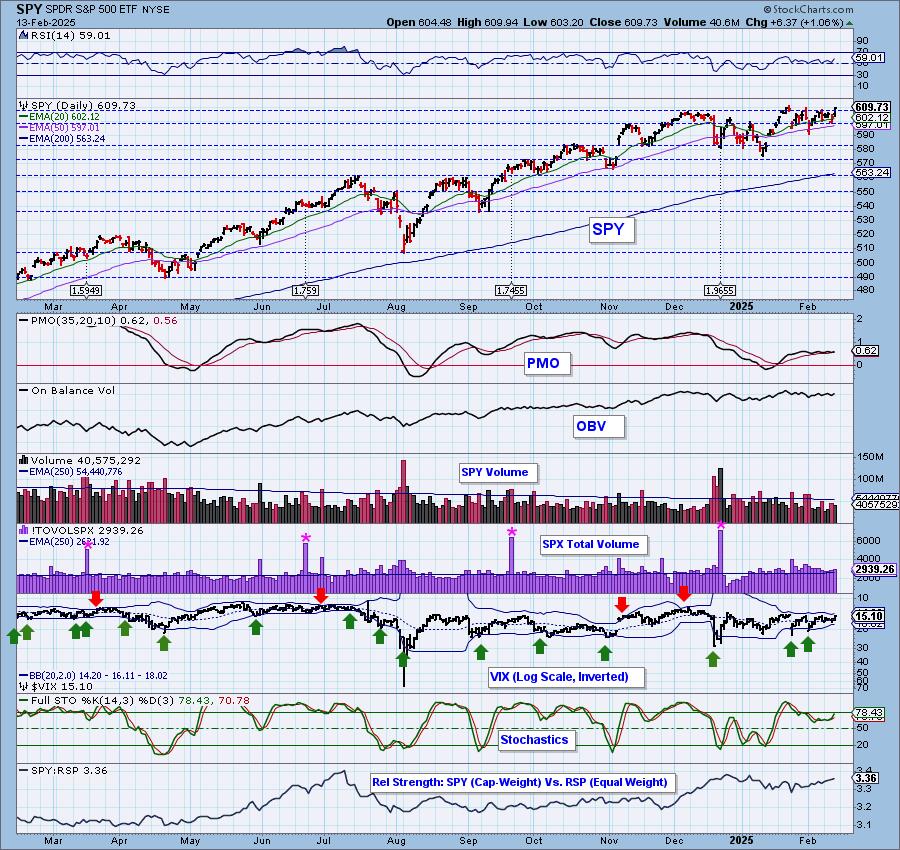
Climax* Analysis: Today there were two climax readings (and two "almosts"), which gives us a climax day; however, we're having a problem deciding whether it is an initiation climax or an exhaustion climax. On January 31 there was an upside exhaustion climax, which was followed by a sharp one-day decline. From that low the market rallied without an upside initiation climax. We think that today's climax is most likely to be an upside exhaustion climax. We will probably know for sure when we see tomorrow's open. It opens strongly to the upside, expect more upside to follow. In the meantime, be alert for a downside reversal.
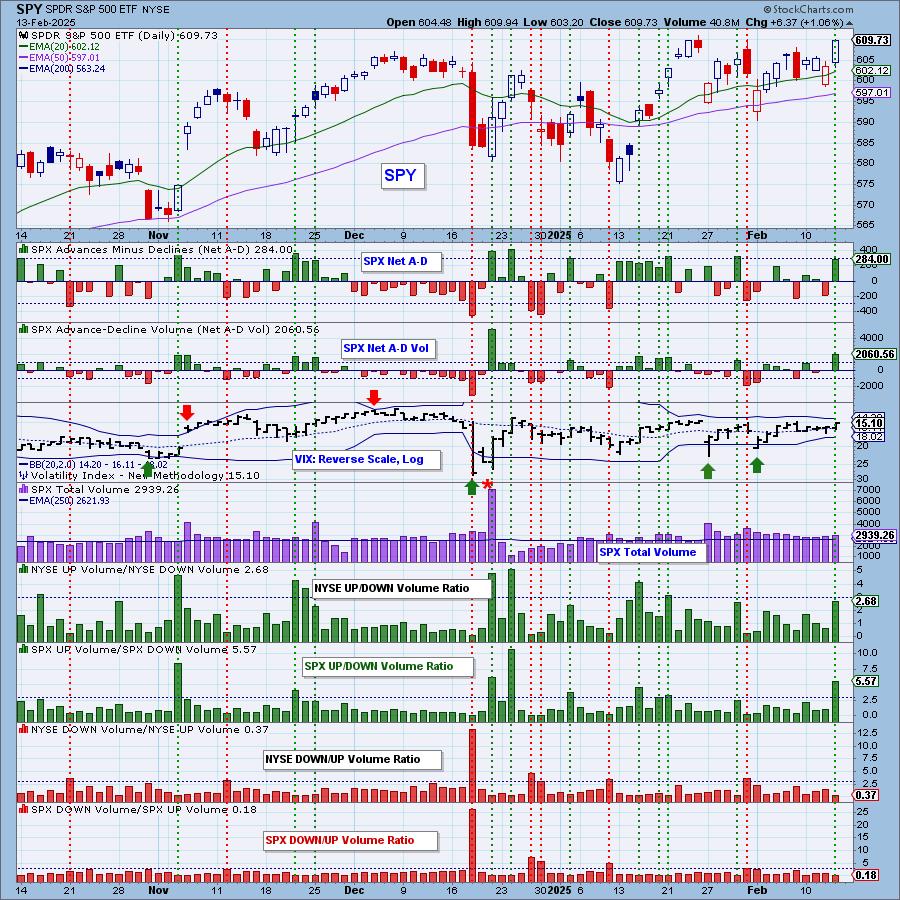
*A climax is a one-day event when market action generates very high readings in, primarily, breadth and volume indicators. We also include the VIX, watching for it to penetrate outside the Bollinger Band envelope. The vertical dotted lines mark climax days -- red for downside climaxes, and green for upside. Climaxes are at their core exhaustion events; however, at price pivots they may be initiating a change of trend.
Short-Term Market Indicators: The short-term market trend is DOWN and the condition is NEUTRAL.
The Swenlin Trading Oscillators (STOs) switched gears today and reversed higher. We don't like the jagged appearance of the STO-B in particular. It can't seem to make up its mind and remains in negative territory. As we would expect, we saw an increase in stocks above their 20-day EMA as well as seeing more rising PMOs. Both indicators still show declining trends.
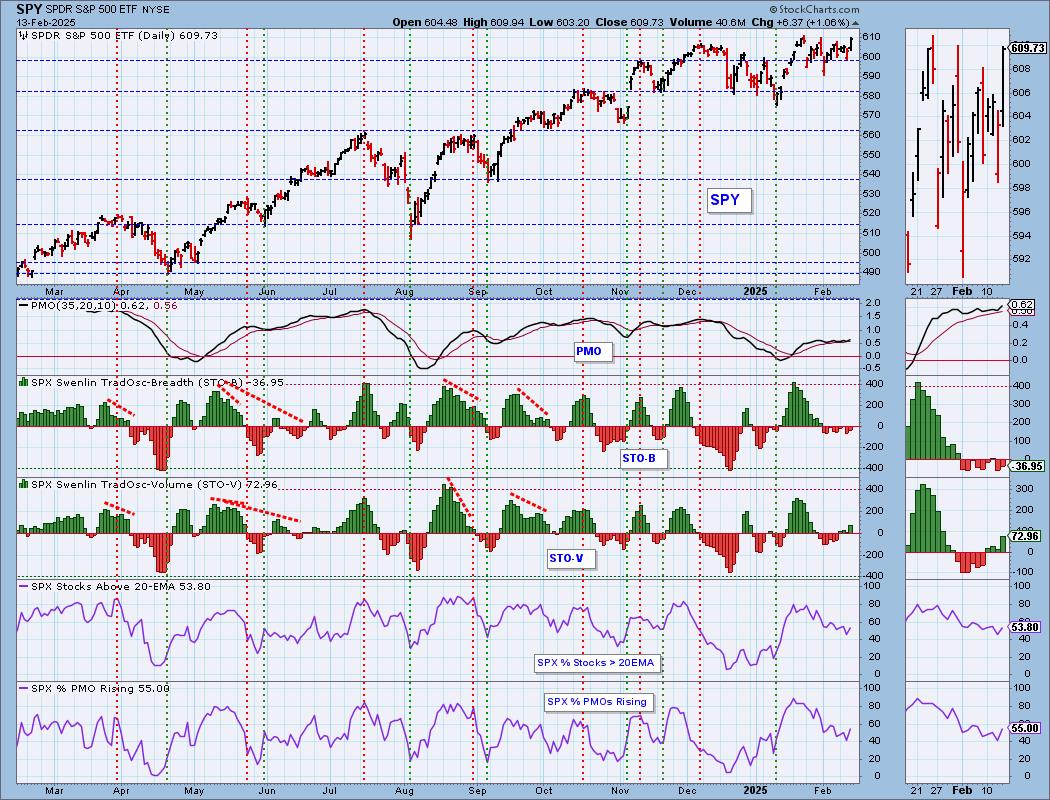
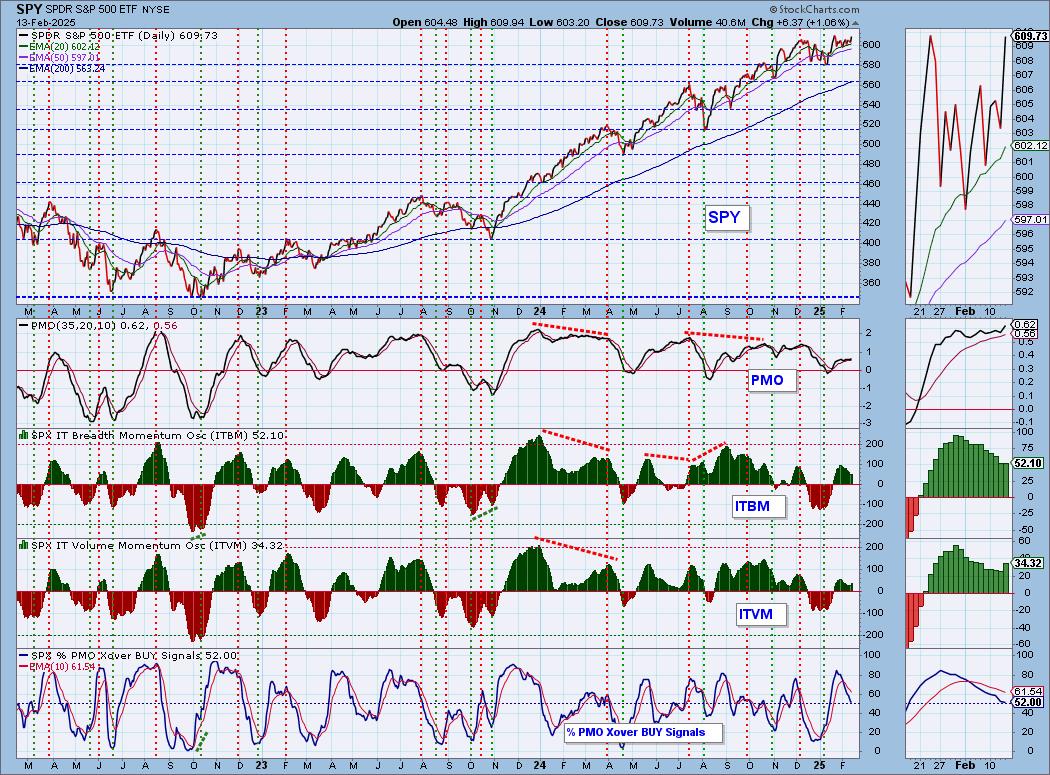
Intermediate-Term Market Indicators: The intermediate-term market trend is UP and the condition is NEUTRAL.
The STOs reversed higher and so did the ITBM and ITVM which does confirm the rising STOs. We did lose some PMO BUY Signals on the rally. We do now have more rising PMOs than PMO BUY Signals and that could get this indicator to reverse higher.
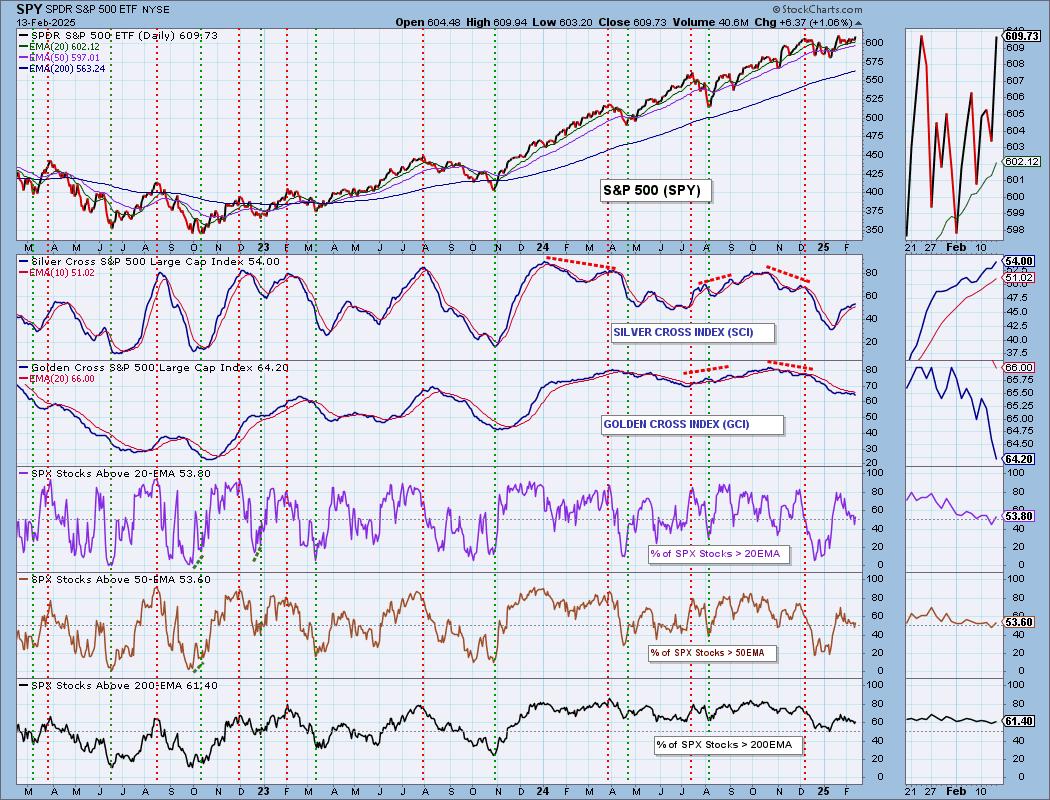
PARTICIPATION CHART (S&P 500): The following chart objectively shows the depth and trend of participation for the SPX in two time frames.
- Intermediate-Term - the Silver Cross Index (SCI) shows the percentage of SPX stocks on IT Trend Model BUY signals (20-EMA > 50-EMA). The opposite of the Silver Cross is a "Dark Cross" -- those stocks are, at the very least, in a correction.
- Long-Term - the Golden Cross Index (GCI) shows the percentage of SPX stocks on LT Trend Model BUY signals (50-EMA > 200-EMA). The opposite of a Golden Cross is the "Death Cross" -- those stocks are in a bear market.
The market bias is BULLISH in the intermediate term.
The market bias is BEARISH in the long term.
We continue to be disturbed by the declining trends in participation, but at this point mega-caps could be keeping price elevated. The Silver Cross Index continues to rise and it is above its signal line so the IT Bias is BULLISH. The Golden Cross Index is still in decline and should continue lower based on fewer stocks being above their 200-day EMA versus those with Golden Crosses. It is below its signal line so the LT Bias remains BEARISH.
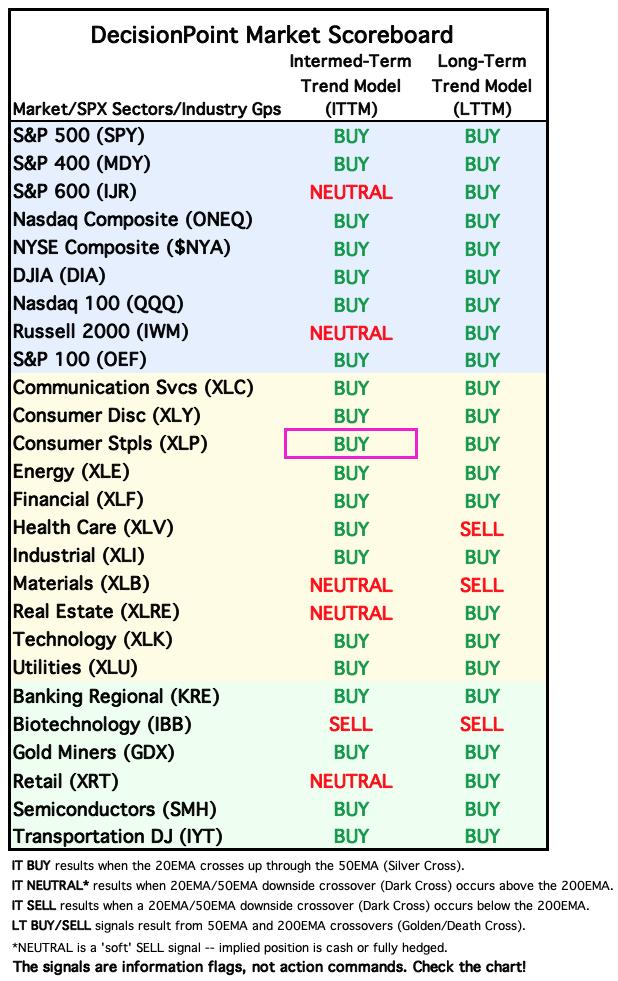
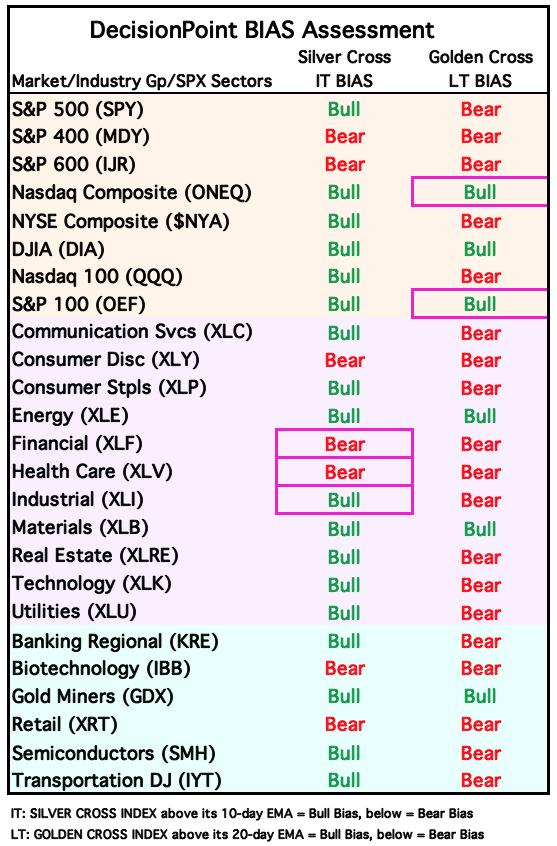
BIAS Assessment: The following table expresses the current BIAS of various price indexes based upon the relationship of the Silver Cross Index to its 10-day EMA (intermediate-term), and of the Golden Cross Index to its 20-day EMA (long-term). When the Index is above the EMA it is bullish, and it is bearish when the Index is below the EMA. The BIAS does not imply that any particular action should be taken. It is information to be used in the decision process.
The items with highlighted borders indicate that the BIAS changed today.
*****************************************************************************************************
CONCLUSION: The STOs and ITBM/ITVM closed higher on the rally which does tell us we could be ready to make new all-time highs. It was particularly bullish given we had a mostly unfavorable inflation report and the announcement of tariffs by President Trump. Still, we have low participation and it is in declining trends. The broad market is not participating as it should. Defensive Consumer Staples is on a strong rally and that many times occurs before a market top. We're not out of the woods, but a positive open on today's upside exhaustion climax would bode well. However, it is an "exhaustion" event so we should be cautious with this rally.
Erin is 15% long, 0% short. (This is intended as information, not a recommendation.)
*****************************************************************************************************
CALENDAR

Have you subscribed the DecisionPoint Diamonds yet? DP does the work for you by providing handpicked stocks/ETFs from exclusive DP scans! Add it with a discount! Contact support@decisionpoint.com for more information!
BITCOIN
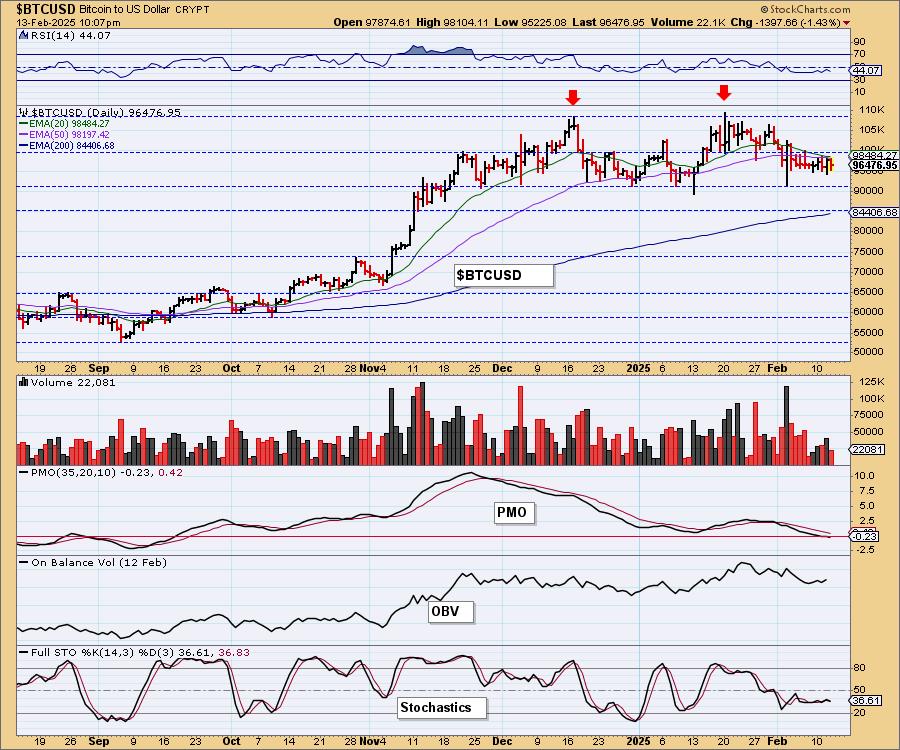
Yesterday's comments still apply:
"Bitcoin is consolidating sideways after its big run higher after the election. It is now in a declining trend headed to test support. The PMO is declining and Stochastics are in negative territory below net neutral (50). The RSI is also in negative territory. Our expectation is another test of support at 90,000. The PMO is now in negative territory."
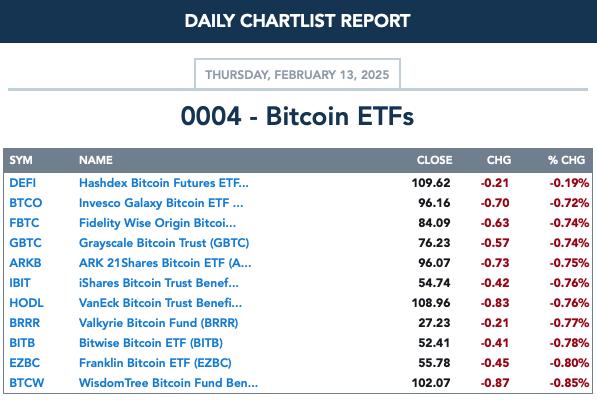
BITCOIN ETFs
INTEREST RATES
Yields pulled back in a big way today suggesting that maybe we aren't through with these declines. In most cases the broken declining trends are still broken so more upside isn't out of the question.

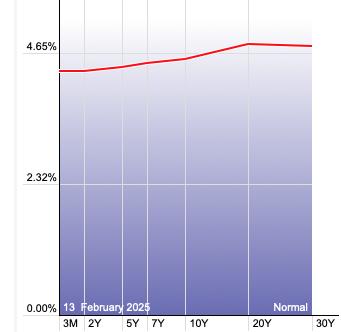
The Yield Curve Chart from StockCharts.com shows us the inversions taking place. The red line should move higher from left to right. Inversions are occurring where it moves downward.
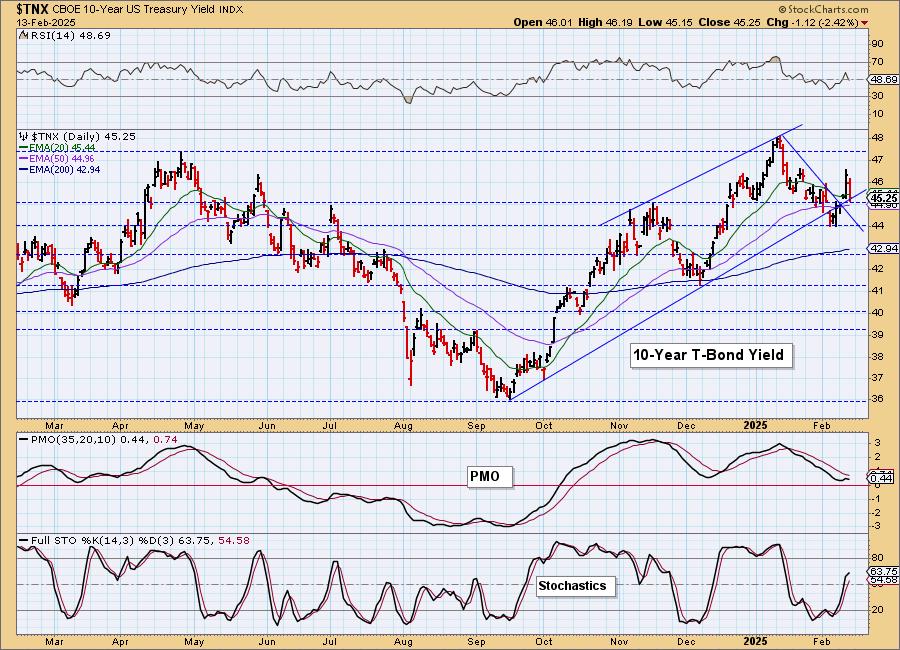
10-YEAR T-BOND YIELD
$TNX took back yesterday's gain in one fell swoop. The rising trend is still preserved and support is also being held so more decline is not a done deal. We did see the PMO top beneath its signal line and that is especially bearish, but Stochastics are still rising. We'll know much more tomorrow when we find out if this support level will hold.
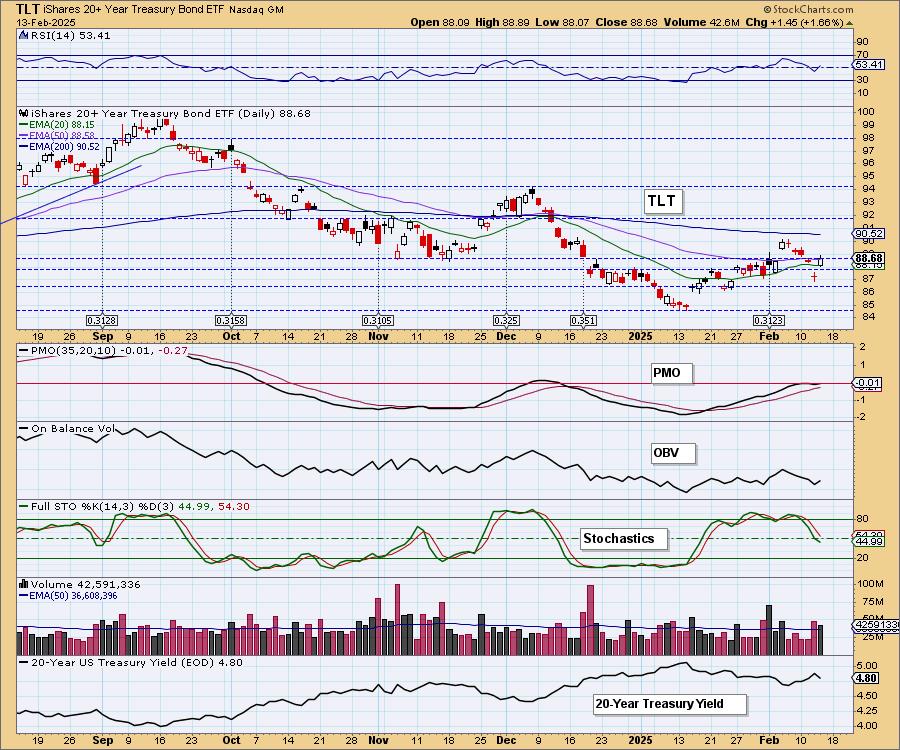
BONDS (TLT)
IT Trend Model: NEUTRAL as of 11/10/2024
LT Trend Model: SELL as of 12/13/2024
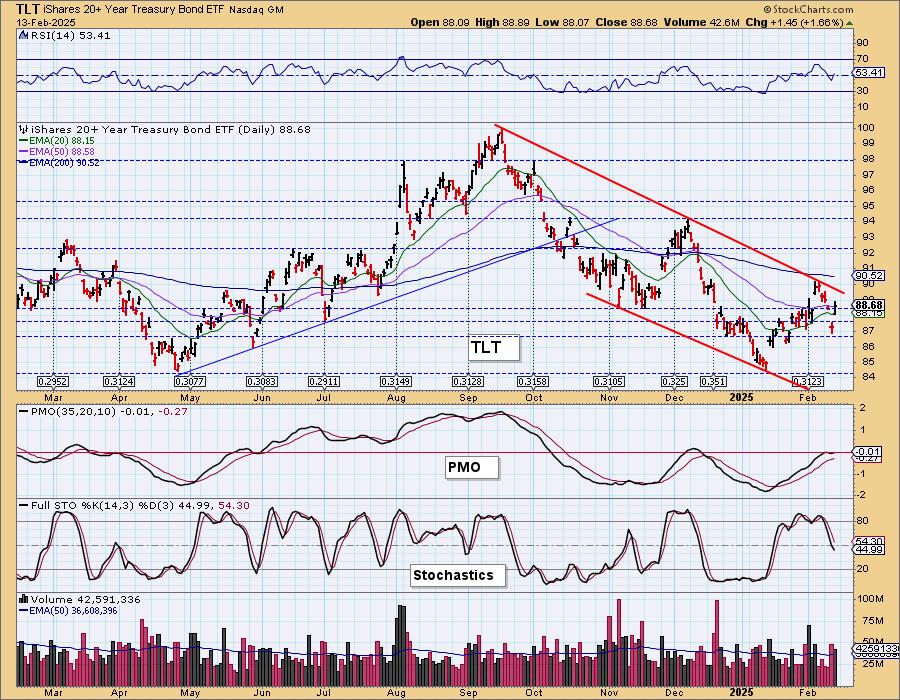
TLT Daily Chart: TLT got a boost today from the falling 20-year yield. The RSI moved back into positive territory and the PMO is already turning back up. Stochastics however are still declining so we don't want to get too bullish on Bonds here.
TLT may now be making an attempt to break from this intermediate-term declining trend channel, but there is still work to do.
DOLLAR (UUP)
IT Trend Model: BUY as of 10/9/2024
LT Trend Model: BUY as of 5/25/2023
UUP Daily Chart: The Dollar has now met support again near the confirmation line of the bearish double top. The PMO is picking up speed to the downside and the RSI moved into negative territory. Stochastics are falling in negative territory so we would expect more downside for the Dollar.
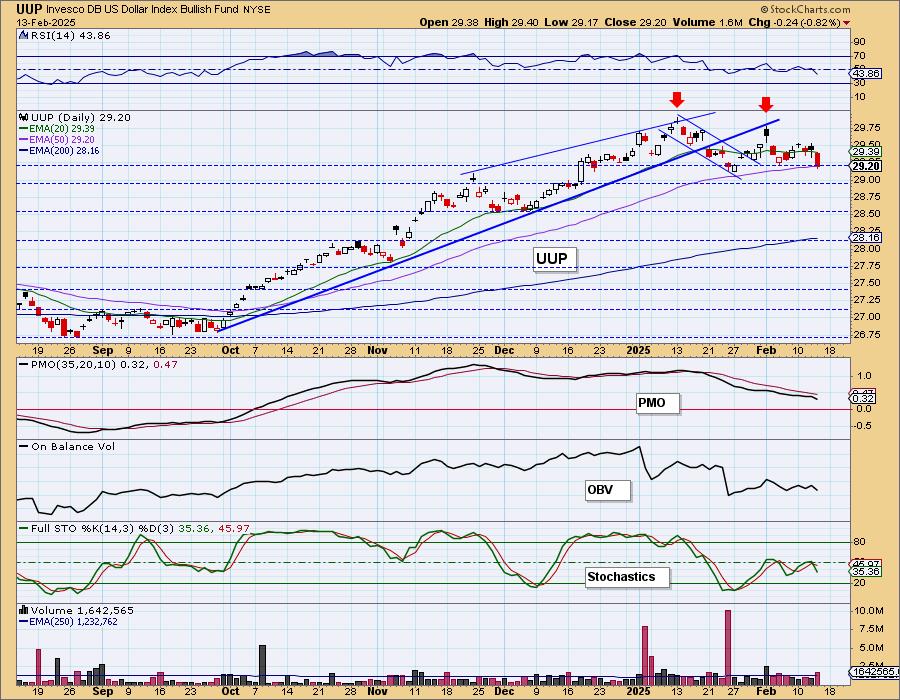
The double top pattern won't be busted unless we get a breakout above the tops. That doesn't look likely at this juncture.

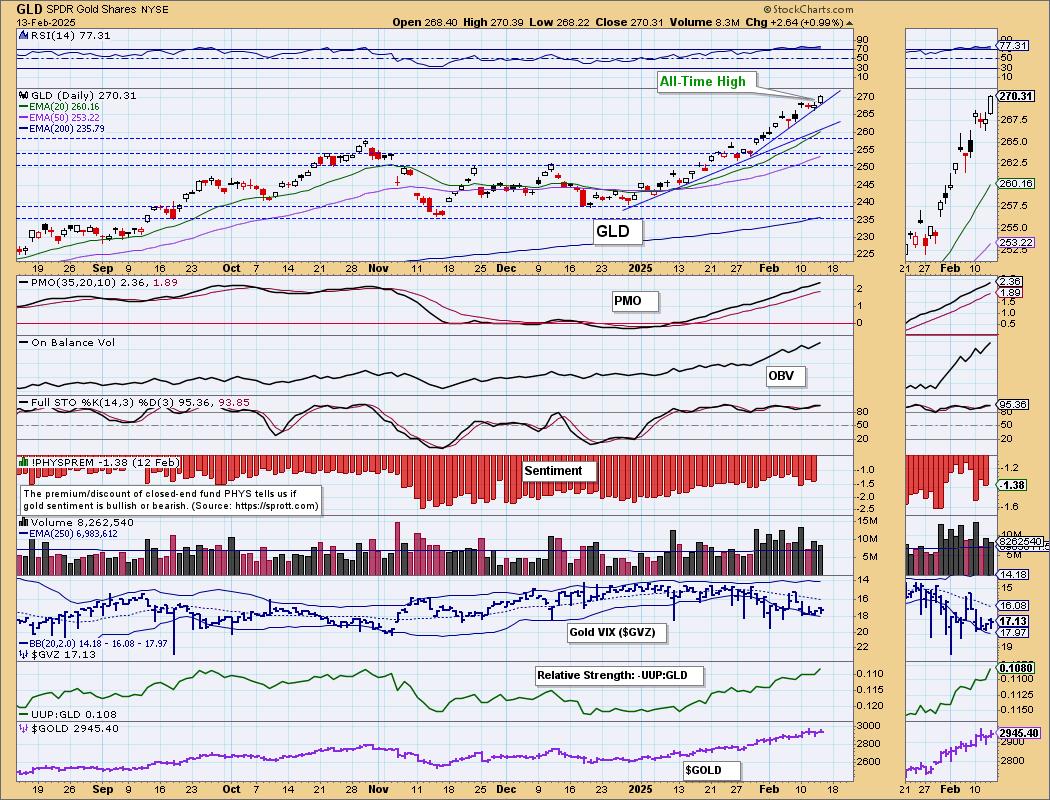
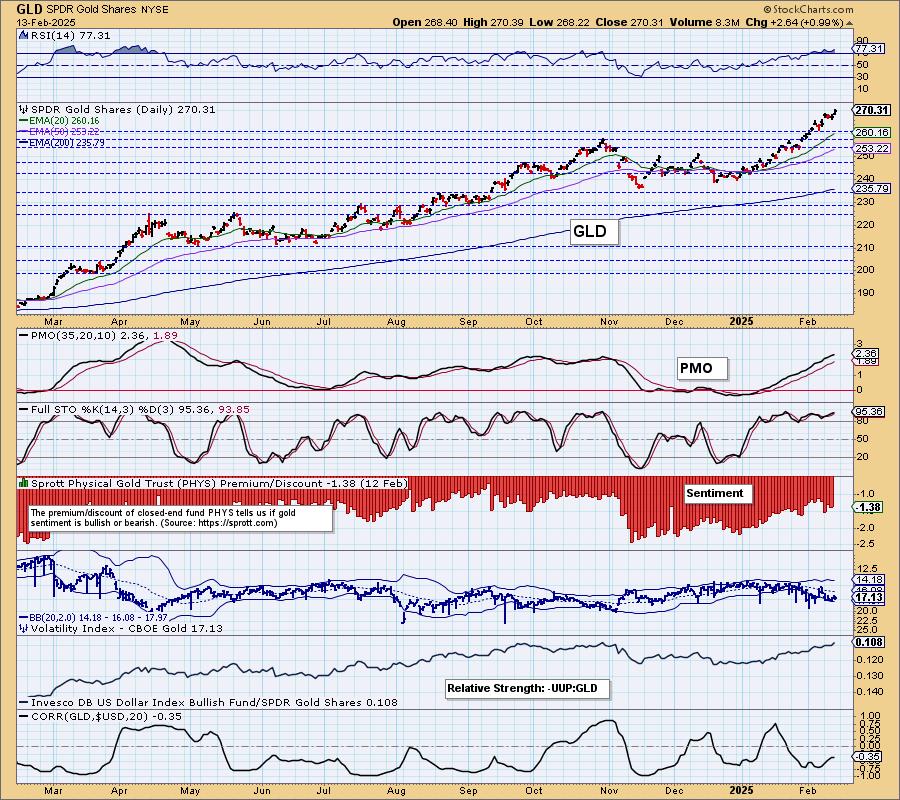
GOLD
IT Trend Model: BUY as of 1/10/2025
LT Trend Model: BUY as of 10/20/2023
GLD Daily Chart: Gold again set another all-time high. With the Dollar seeing a big decline, it was expected that we'd see Gold rise. With the Dollar looking quite bearish right now, we think Gold could continue to make its way higher despite the overbought RSI. We still think it needs a breather based on that RSI, but the PMO and Stochastics are behind further rally.
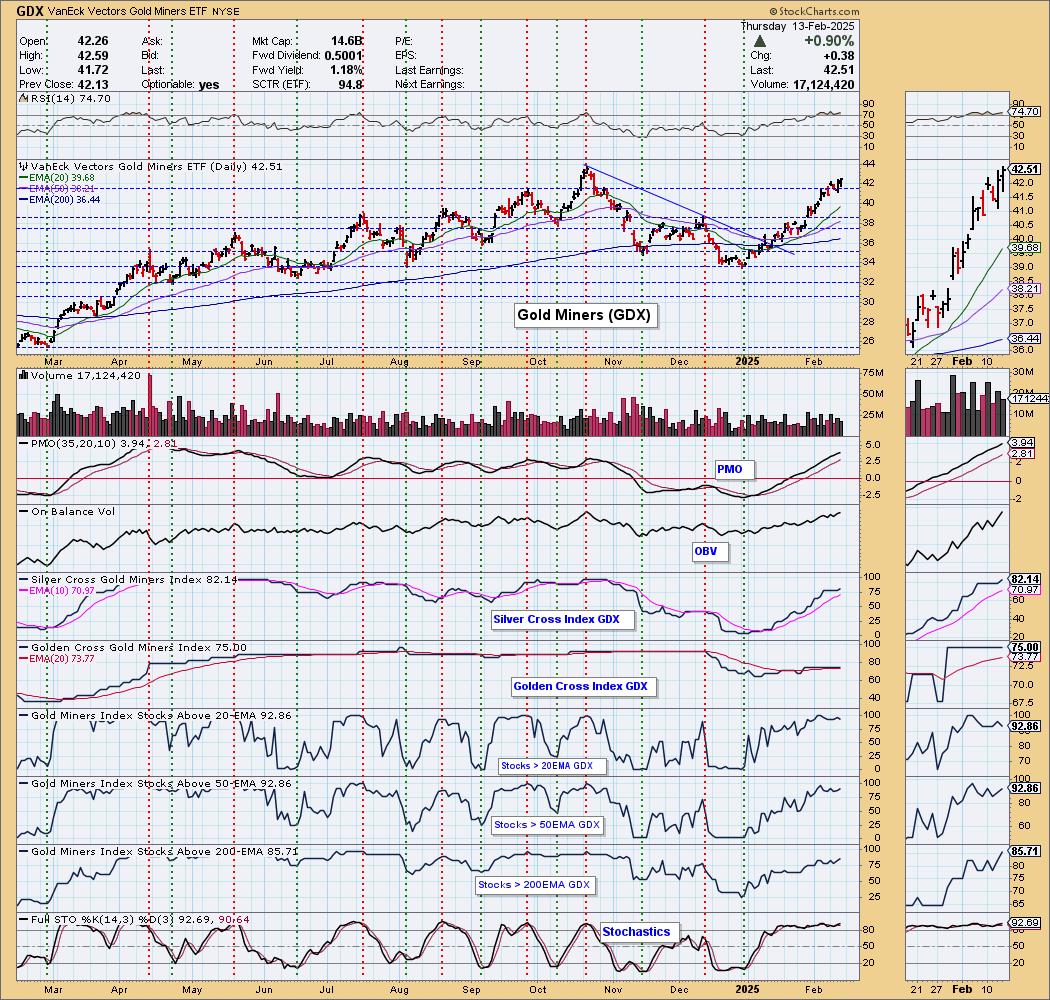
GOLD MINERS (GDX) Daily Chart: Gold isn't done rallying so consequently Gold Miners aren't through. We do have the problem of an overbought RSI on GDX as well as Gold which does imply we'll see at least a pause, but given the bearish outlook for the Dollar, we could see GDX move even higher from here. Next up is resistance at the October high. It looks like it'll get there.
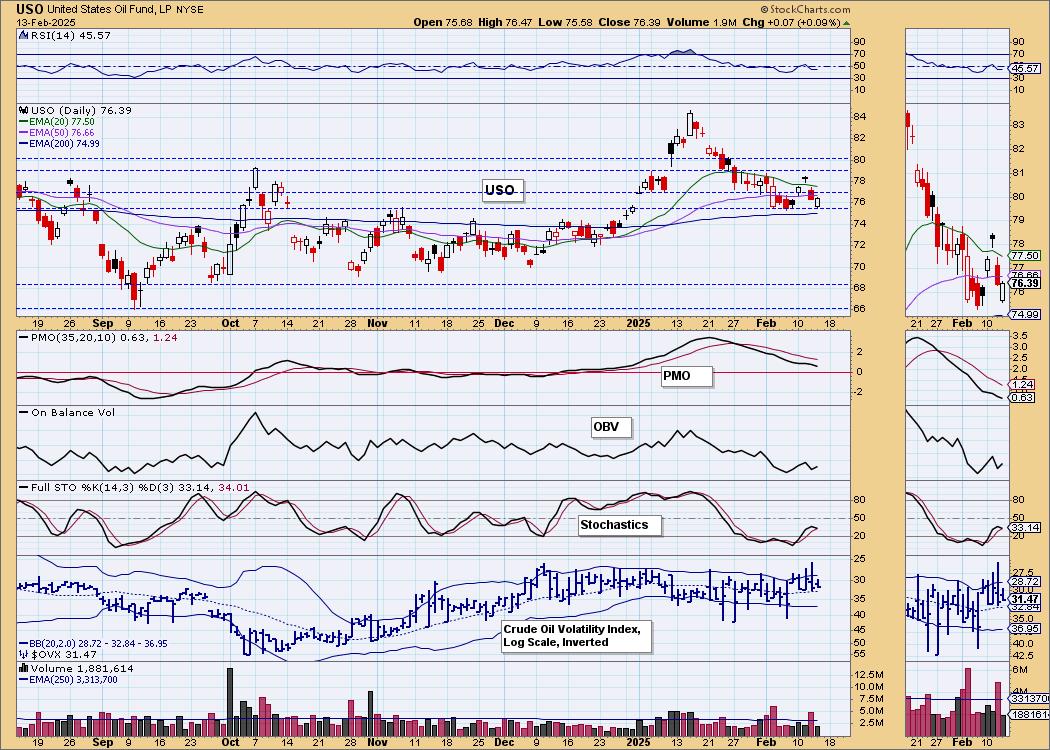
CRUDE OIL (USO)
IT Trend Model: BUY as of 12/24/2024
LT Trend Model: BUY as of 1/10/2025
USO Daily Chart: Crude may've seen a rally today but it didn't brighten the picture. It set a lower low and a much lower high. Support is currently holding, but given the topping Stochastics on the rally, we expect support at the November high and 200-day EMA to be broken.

Good Luck & Good Trading!
Erin Swenlin and Carl Swenlin
Technical Analysis is a windsock, not a crystal ball. --Carl Swenlin
(c) Copyright 2025 DecisionPoint.com
Disclaimer: This blog is for educational purposes only and should not be construed as financial advice. The ideas and strategies should never be used without first assessing your own personal and financial situation, or without consulting a financial professional. Any opinions expressed herein are solely those of the author, and do not in any way represent the views or opinions of any other person or entity.
DecisionPoint is not a registered investment advisor. Investment and trading decisions are solely your responsibility. DecisionPoint newsletters, blogs or website materials should NOT be interpreted as a recommendation or solicitation to buy or sell any security or to take any specific action.
NOTE: The signal status reported herein is based upon mechanical trading model signals, specifically, the DecisionPoint Trend Model. They define the implied bias of the price index based upon moving average relationships, but they do not necessarily call for a specific action. They are information flags that should prompt chart review. Further, they do not call for continuous buying or selling during the life of the signal. For example, a BUY signal will probably (but not necessarily) return the best results if action is taken soon after the signal is generated. Additional opportunities for buying may be found as price zigzags higher, but the trader must look for optimum entry points. Conversely, exit points to preserve gains (or minimize losses) may be evident before the model mechanically closes the signal.
Helpful DecisionPoint Links:
DecisionPoint Alert Chart List
DecisionPoint Golden Cross/Silver Cross Index Chart List
DecisionPoint Sector Chart List
Price Momentum Oscillator (PMO)