
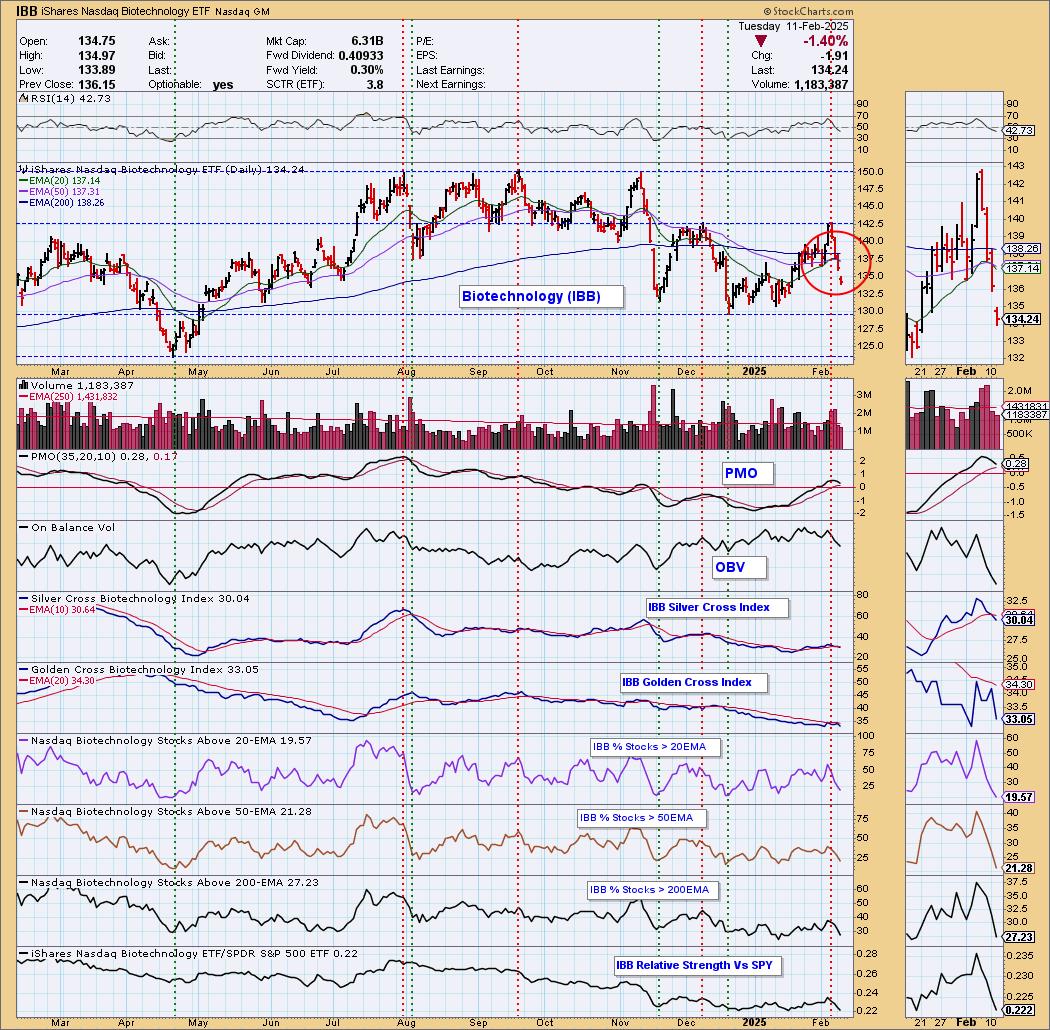
Today the Biotechnology ETF (IBB) 20-day EMA crossed down through the 50-day EMA (Dark Cross), below the 200-day EMA, generating an IT Trend Model SELL Signal. This is a whipsaw from the BUY Signal it generated a few days ago, but considering that the signal comes below the 200-day EMA, continued downside seems likely.
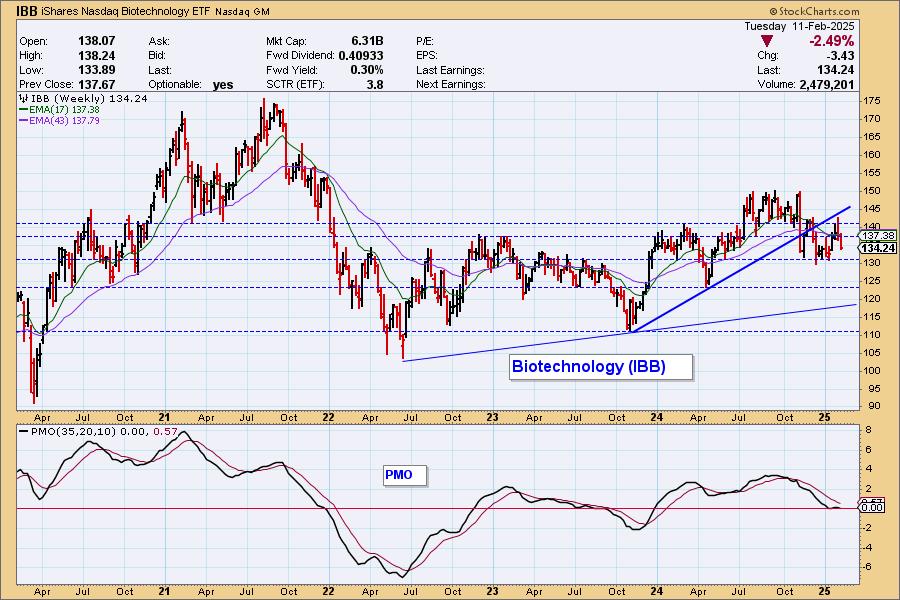
The IBB weekly chart has the weekly PMO has turned down on the zero line, and a 10-month rising trend line has been broken.
The DecisionPoint Alert Weekly Wrap presents an end-of-week assessment of the trend and condition of the Stock Market, the U.S. Dollar, Gold, Crude Oil, and Bonds. The DecisionPoint Alert daily report (Monday through Thursday) is abbreviated and gives updates on the Weekly Wrap assessments.
Watch the latest episode of DecisionPoint on our YouTube channel here!
MARKET/INDUSTRY GROUP/SECTOR INDEXES
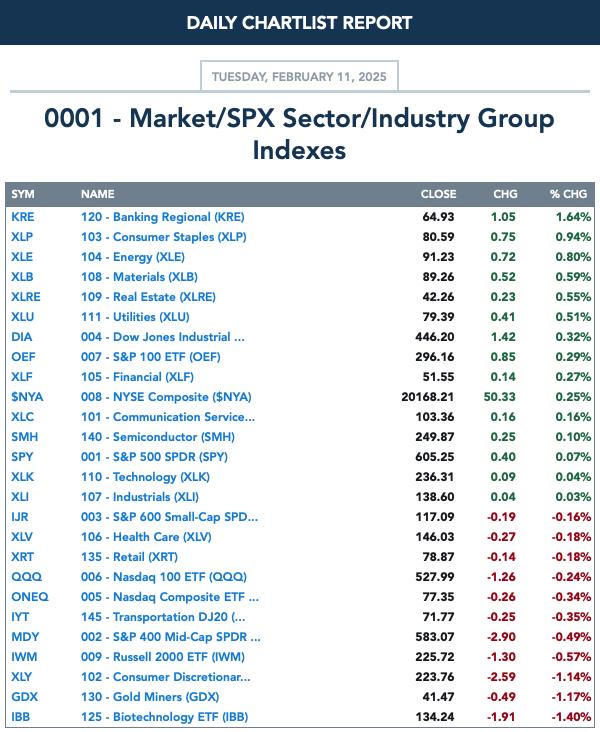
CLICK HERE for Carl's annotated Market Index, Sector, and Industry Group charts.
THE MARKET (S&P 500)
IT Trend Model: BUY as of 8/14/2024
LT Trend Model: BUY as of 3/29/2023
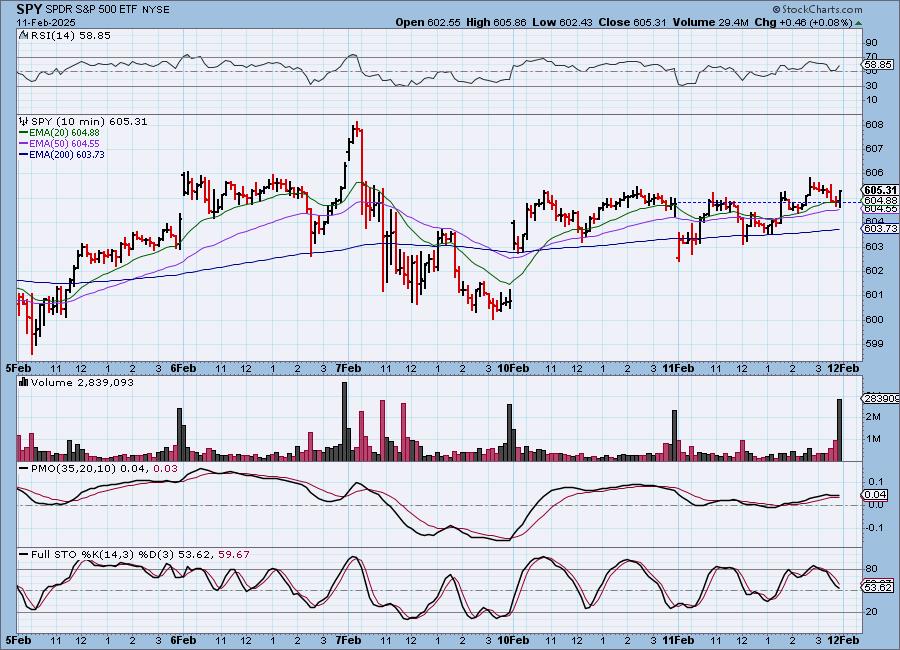
SPY 10-Minute Chart: Price gapped down on the open but made its way slowly higher to finish positive. Note that not much ground has been made the past two days of trading.
SPY Daily Chart: We did see a bullish engulfing candlestick today, but the declining trend is still intact suggesting we could see a downturn as the declining tops trendline is reached.
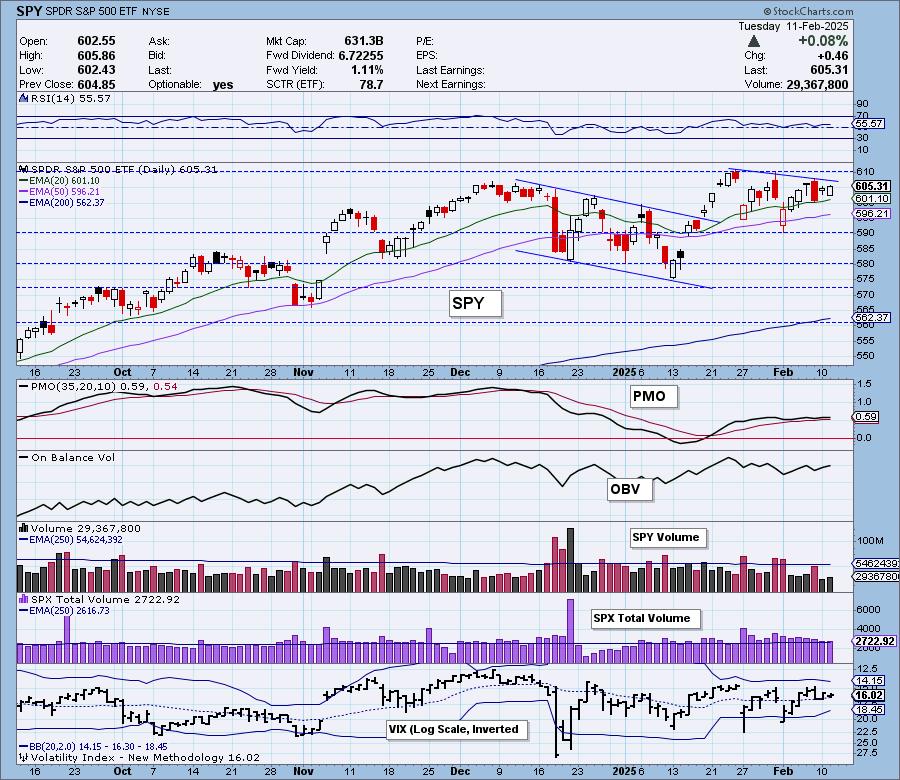
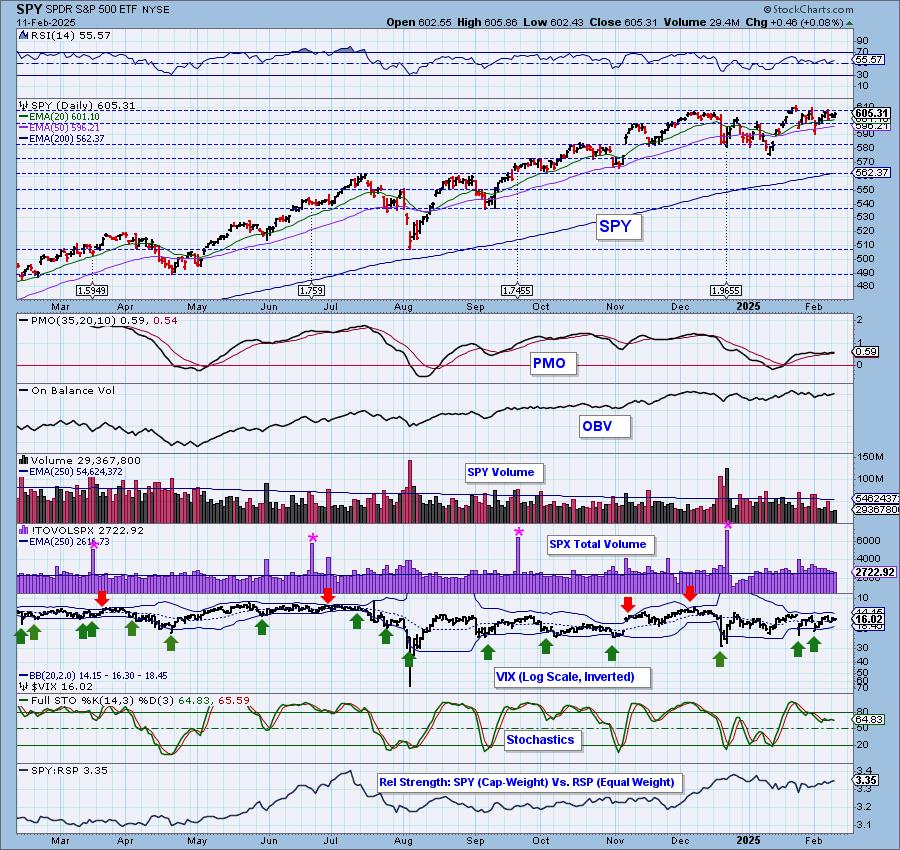
We have very little volatility in the market right now as the VIX Bollinger Bands continue to shrink. We should beware as typically we come out of low volatility into extremes on price drops. Stochastics are stagnant, but at least reside in positive territory above net neutral (50). Despite a rising relative strength line to RSP, price hasn't really seen a strong rally so mega-caps, while leading the market, are not leading it higher.

Here is the latest recording from 2/10. Click HERE to get to our video list.:
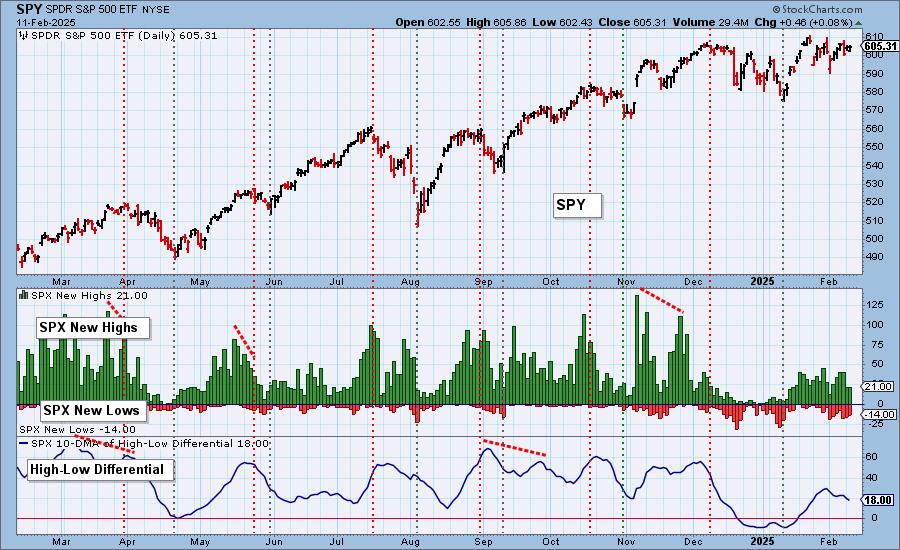
S&P 500 New 52-Week Highs/Lows: No changes on New Highs/New Lows today. The High-Low Differential remains a problem as it declines. It never reached prior highs which is also an issue.
Climax* Analysis: There were no climax readings today.
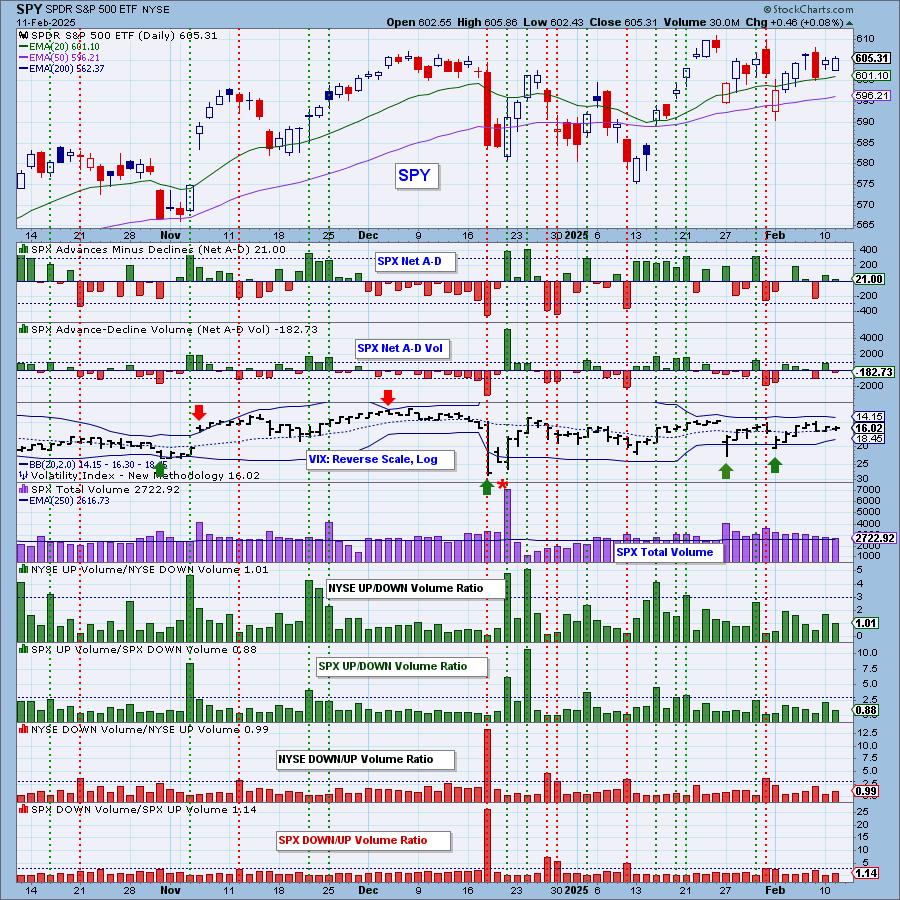
*A climax is a one-day event when market action generates very high readings in, primarily, breadth and volume indicators. We also include the VIX, watching for it to penetrate outside the Bollinger Band envelope. The vertical dotted lines mark climax days -- red for downside climaxes, and green for upside. Climaxes are at their core exhaustion events; however, at price pivots they may be initiating a change of trend.
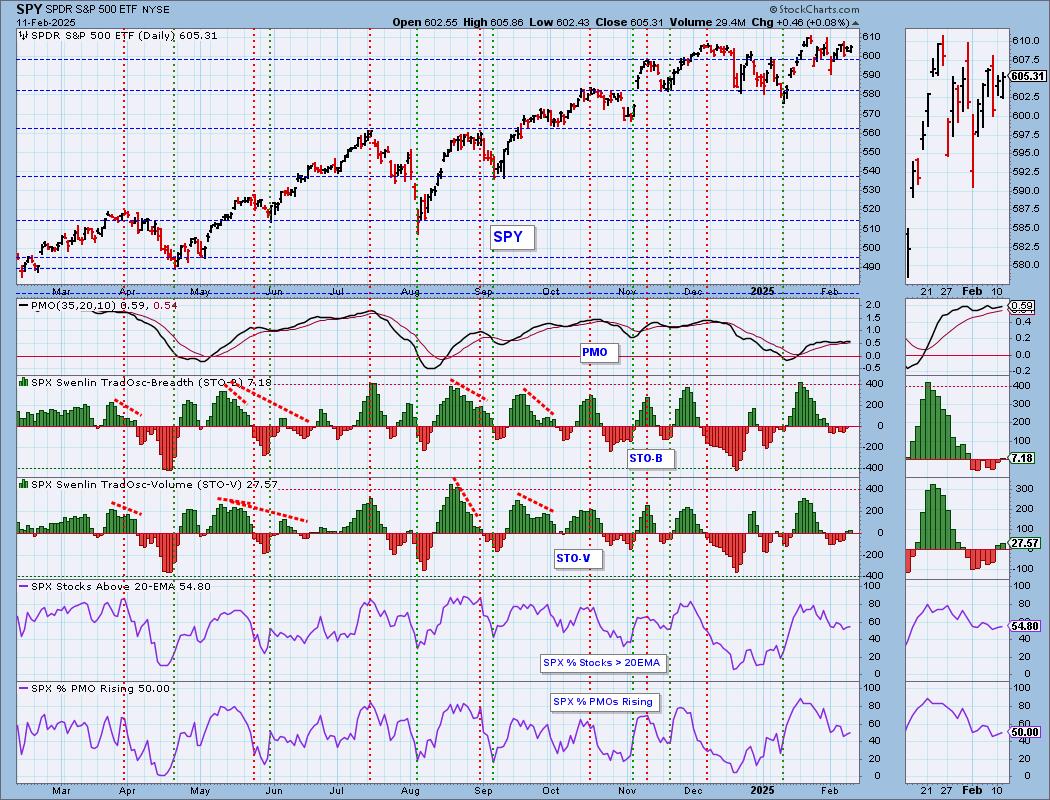
Short-Term Market Indicators: The short-term market trend is DOWN and the condition is NEUTRAL.
The Swenlin Trading Oscillators (STOs) both rose today and both are now in positive territory. Our issue with the STOs is that they have been really ragged and not really picking a clear direction. The other problem with this chart is the declining trends in %Stocks > 20EMA and %PMOs Rising.
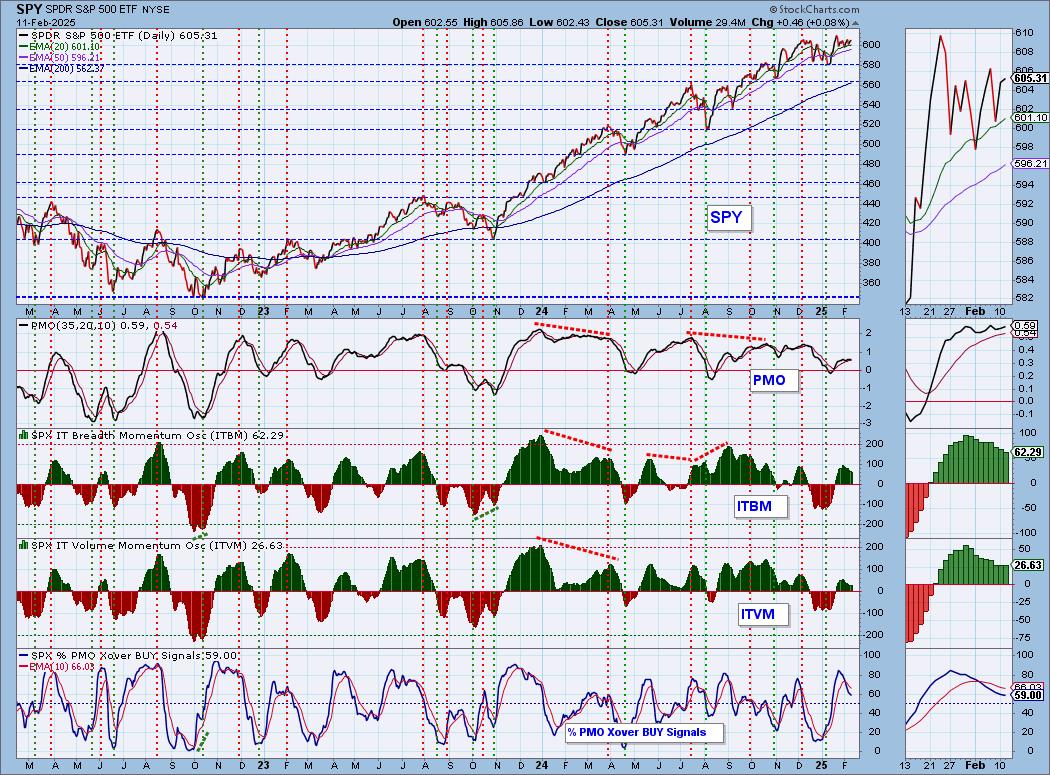
Intermediate-Term Market Indicators: The intermediate-term market trend is UP and the condition is NEUTRAL.
The ITBM and ITVM were lower on the day so they are not yet confirming the rising STOs. We continue to see fewer and fewer PMO BUY Signals.
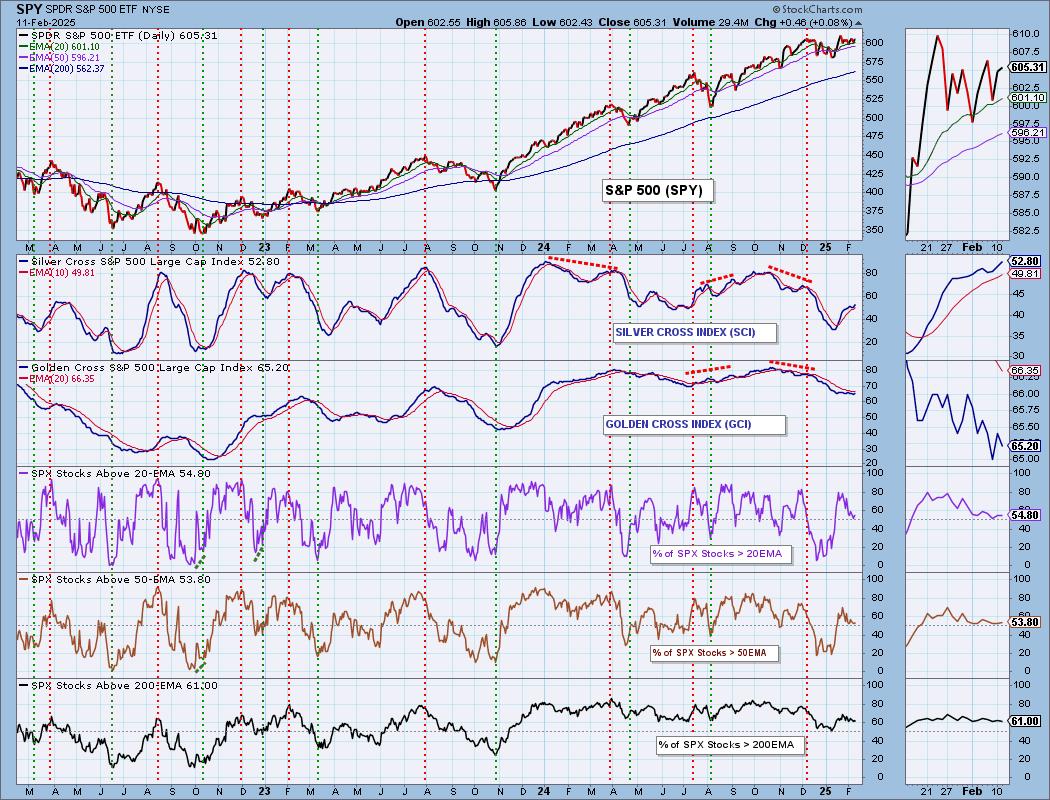
PARTICIPATION CHART (S&P 500): The following chart objectively shows the depth and trend of participation for the SPX in two time frames.
- Intermediate-Term - the Silver Cross Index (SCI) shows the percentage of SPX stocks on IT Trend Model BUY signals (20-EMA > 50-EMA). The opposite of the Silver Cross is a "Dark Cross" -- those stocks are, at the very least, in a correction.
- Long-Term - the Golden Cross Index (GCI) shows the percentage of SPX stocks on LT Trend Model BUY signals (50-EMA > 200-EMA). The opposite of a Golden Cross is the "Death Cross" -- those stocks are in a bear market.
The market bias is BULLISH in the intermediate term.
The market bias is BEARISH in the long term.
Participation readings remain in declining trends and readings are only mildly bullish above 50% for stocks above their 20/50-day EMAs. The Silver Cross Index is rising, but also has only a mildly bullish reading. It is above its signal line so the IT Bias is BULLISH. The Golden Cross Index continues to move lower and given we have fewer stocks above their 200-day EMAs, we will continue to see it fall. It is below its signal line so the LT Bias is BEARISH.
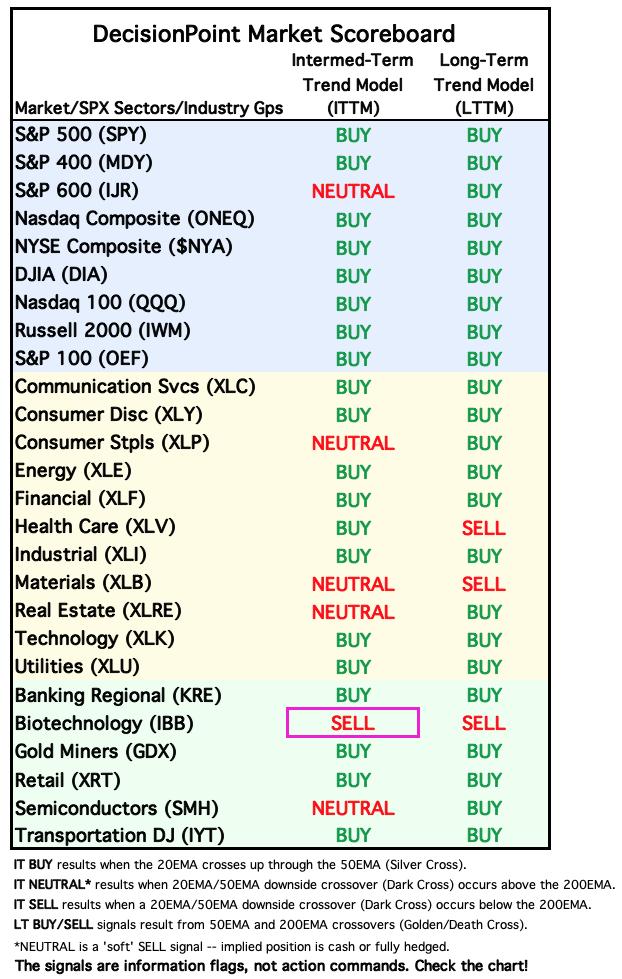
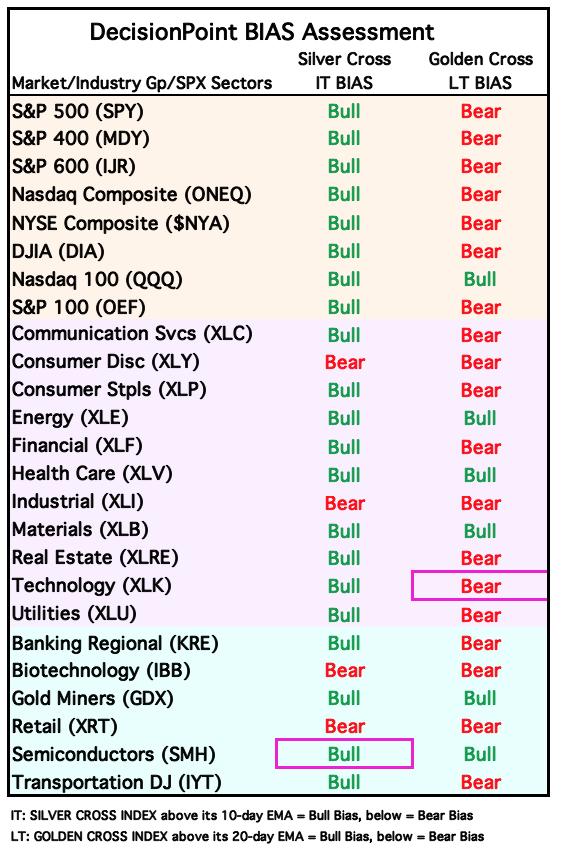
BIAS Assessment: The following table expresses the current BIAS of various price indexes based upon the relationship of the Silver Cross Index to its 10-day EMA (intermediate-term), and of the Golden Cross Index to its 20-day EMA (long-term). When the Index is above the EMA it is bullish, and it is bearish when the Index is below the EMA. The BIAS does not imply that any particular action should be taken. It is information to be used in the decision process.
The items with highlighted borders indicate that the BIAS changed today.
*****************************************************************************************************
CONCLUSION: The STOs and PMO are rising so there is a possibility that we'll continue to see price move higher from here. However, we are still concerned by the loss of PMOs Rising and PMO BUY Signals. It doesn't help that participation continues to trend lower. The market is overdue for a good sized decline so we should be on the lookout particularly given only mildly bullish readings on the Silver Cross Index and %Stocks > 20/50EMAs. The declining trend on the SPY tells us we should be careful with adding exposure. The CPI report will be released tomorrow. That could goose the market in either direction.
Erin is 15% long, 0% short. (This is intended as information, not a recommendation.)
*****************************************************************************************************
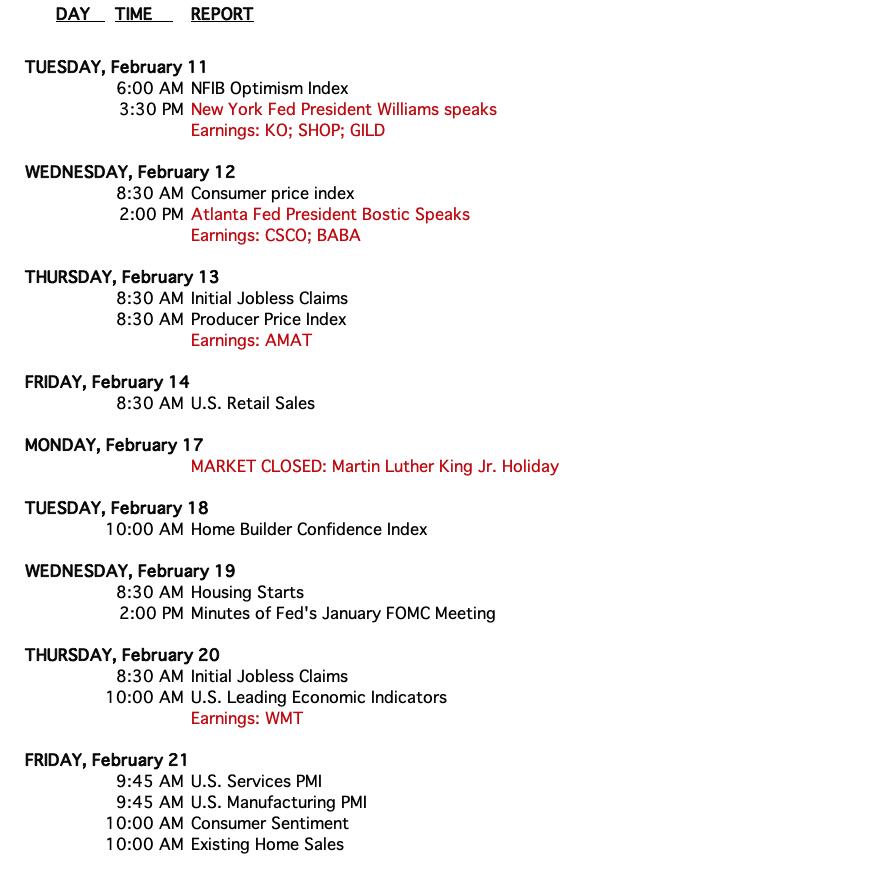
CALENDAR
Have you subscribed the DecisionPoint Diamonds yet? DP does the work for you by providing handpicked stocks/ETFs from exclusive DP scans! Add it with a discount! Contact support@decisionpoint.com for more information!
BITCOIN
Yesterday's comments still apply:
"Bitcoin is consolidating sideways after its big run higher after the election. It is now in a declining trend headed to test support. The PMO is declining and Stochastics are in negative territory below net neutral (50). The RSI is also in negative territory. Our expectation is another test of support at 90,000."

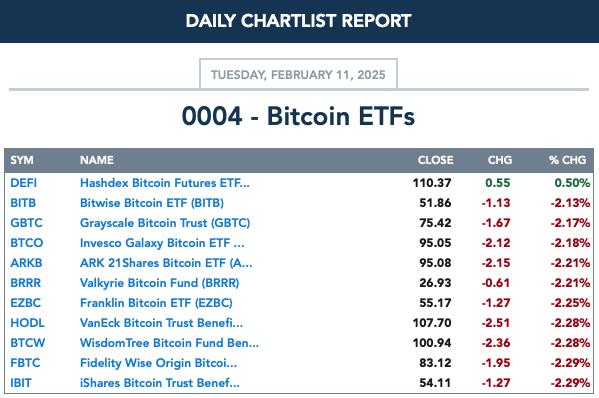
BITCOIN ETFs
INTEREST RATES
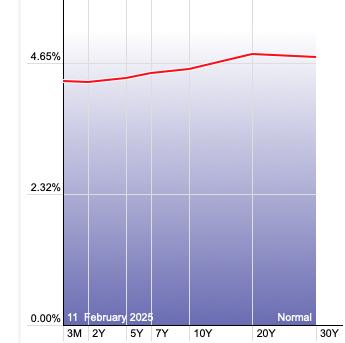
We may be at an inflection point for yields as they are beginning to rise in earnest.
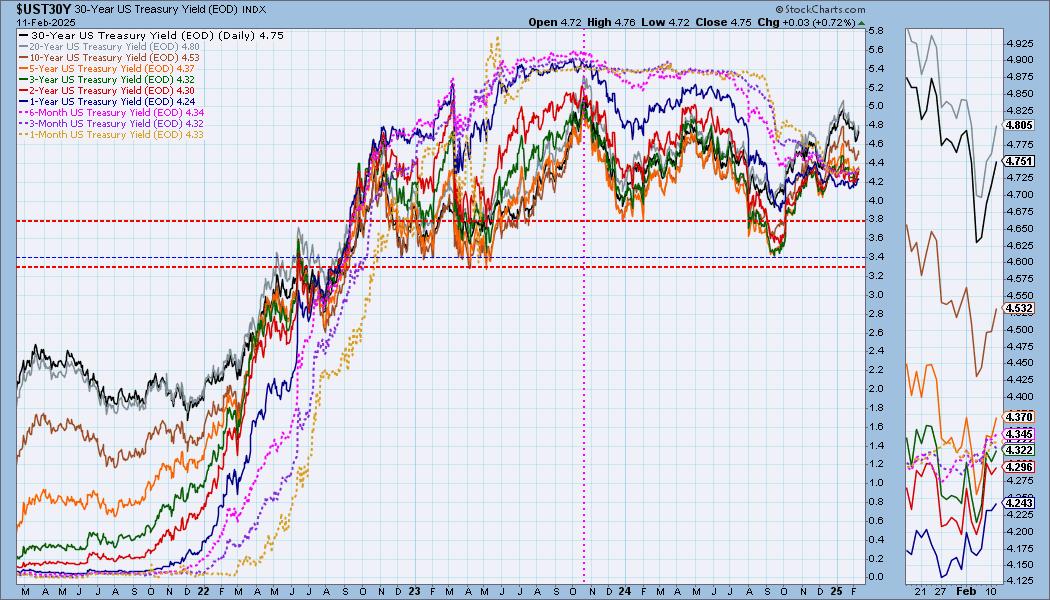
The Yield Curve Chart from StockCharts.com shows us the inversions taking place. The red line should move higher from left to right. Inversions are occurring where it moves downward.
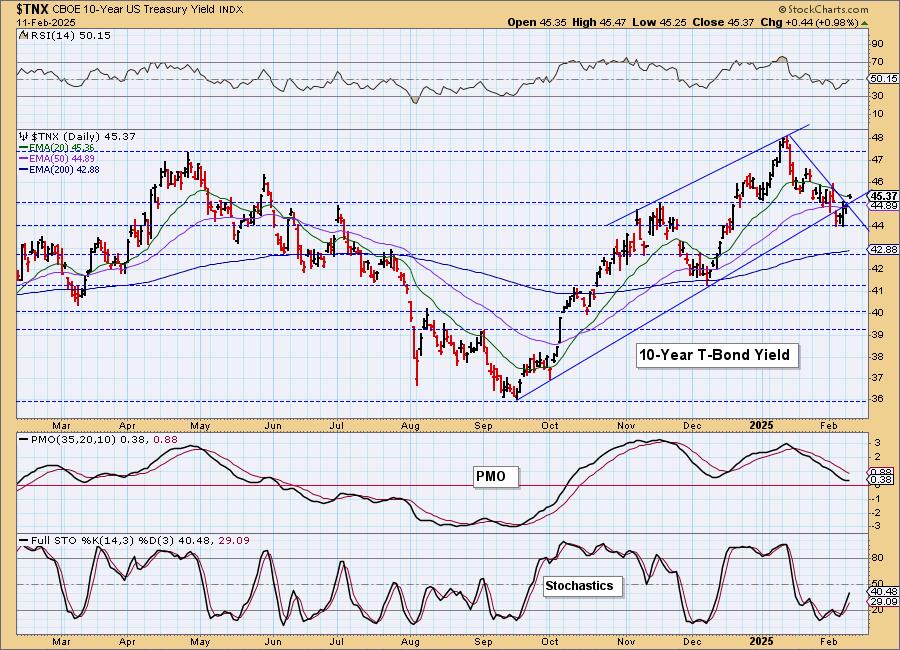
10-YEAR T-BOND YIELD
The declining trend was broken with today's rise suggesting we may see $TNX move higher from here. The PMO is starting to bottom above the zero line. Stochastics are rising strongly.
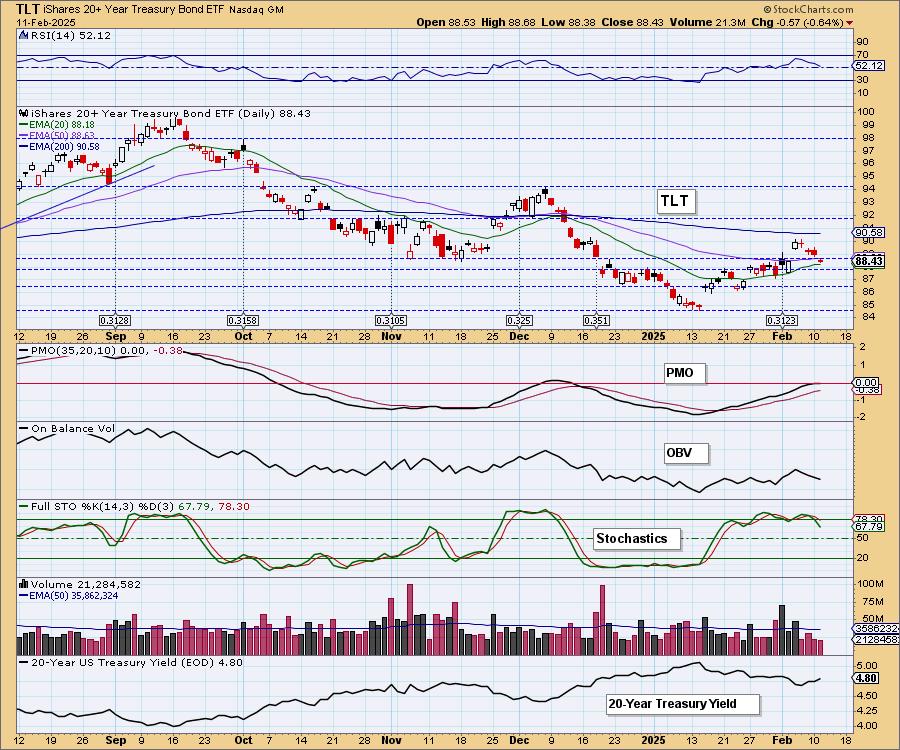
BONDS (TLT)
IT Trend Model: NEUTRAL as of 11/10/2024
LT Trend Model: SELL as of 12/13/2024
TLT Daily Chart: Yields may be reversing higher so this will put downside pressure on Bond funds. The rising trend is still intact but it is very vulnerable given the drop in Stochastics.
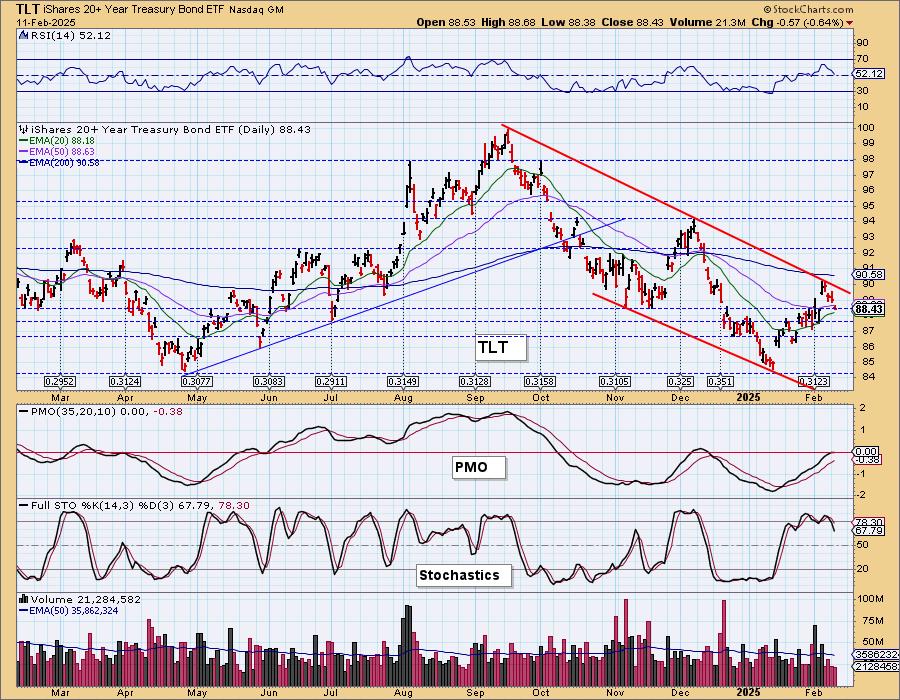
Yields are shifting higher. This will push TLT lower and it is not a surprise that this is occurring right now given price has reached the top of a declining trend channel.
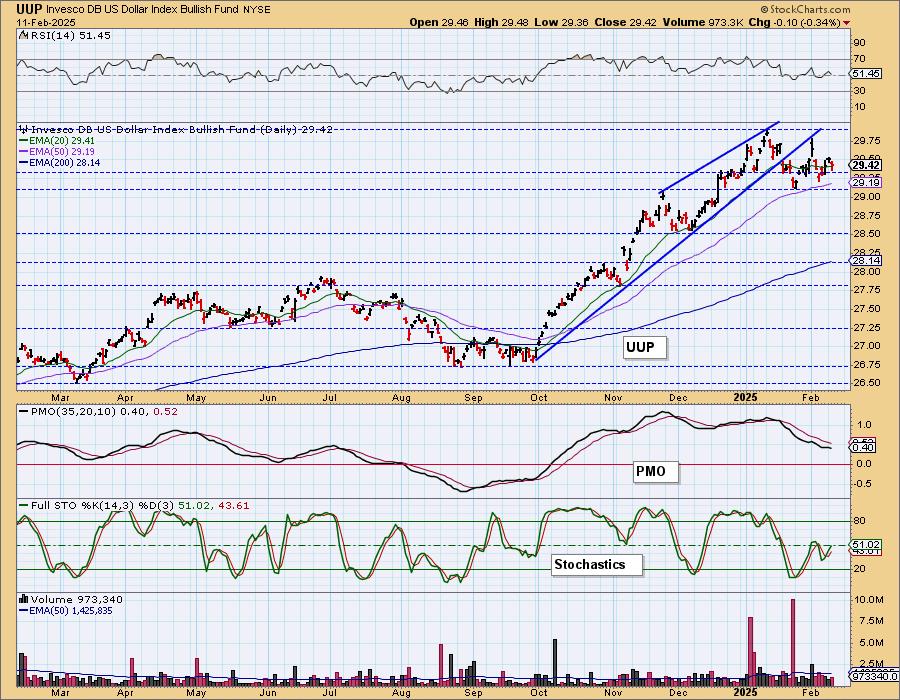
DOLLAR (UUP)
IT Trend Model: BUY as of 10/9/2024
LT Trend Model: BUY as of 5/25/2023
UUP Daily Chart: The Dollar still shows a topping formation, a double top. We've seen some rally, but it isn't enough to look for a sustained rally in our opinion. The PMO is still declining.

Stochastics are rising, but the double top looks as though it will stick around. The pattern won't be busted unless we get a breakout above the tops.
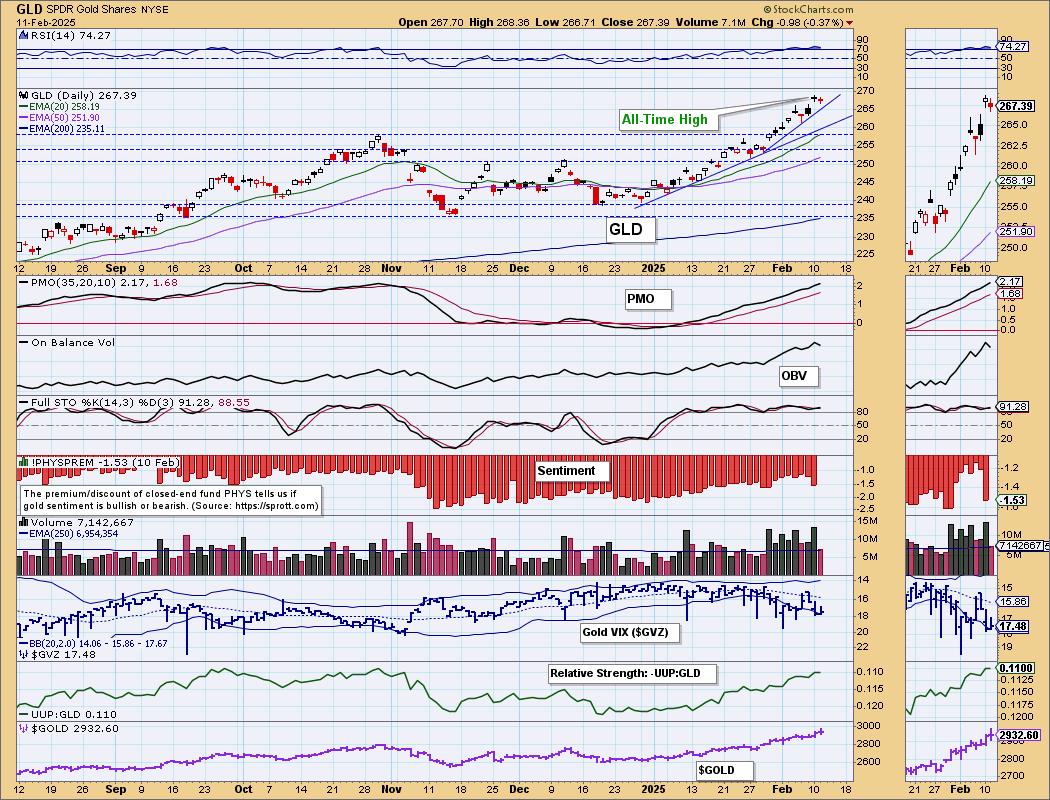
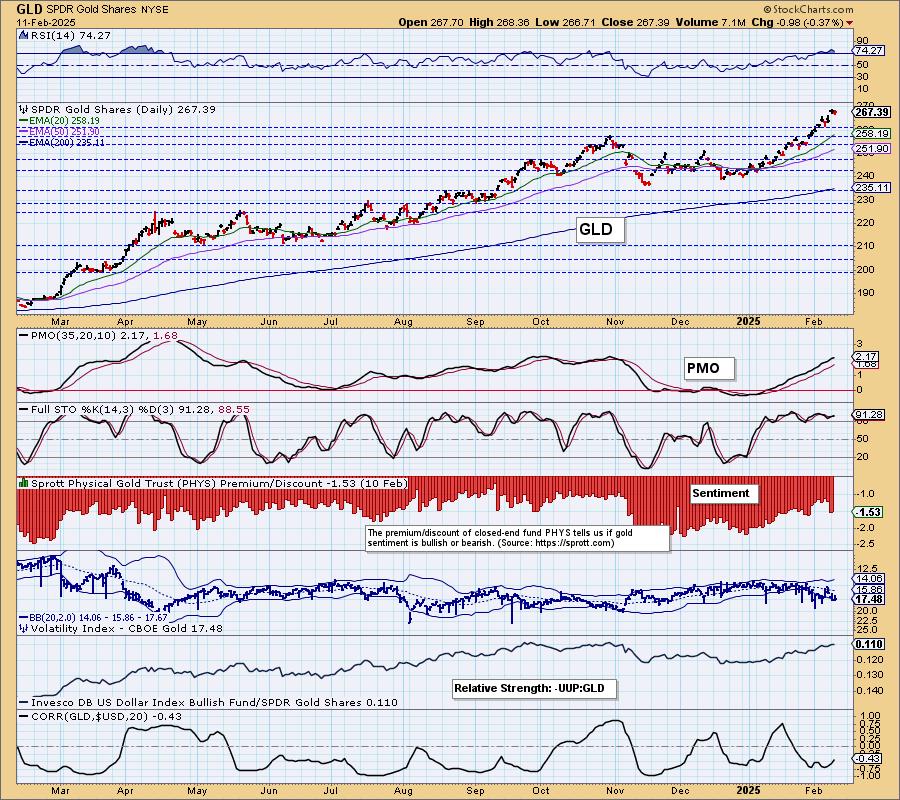
GOLD
IT Trend Model: BUY as of 1/10/2025
LT Trend Model: BUY as of 10/20/2023
GLD Daily Chart: Gold took a breather today, but remains in a strong rising trend. It is time for it to cool as the RSI has gotten overbought. We noticed a pop in discounts and that means that investors just got a bit more bearish. Other than the RSI, the PMO and Stochastics look healthy so we aren't expecting a deep decline, just a pause.
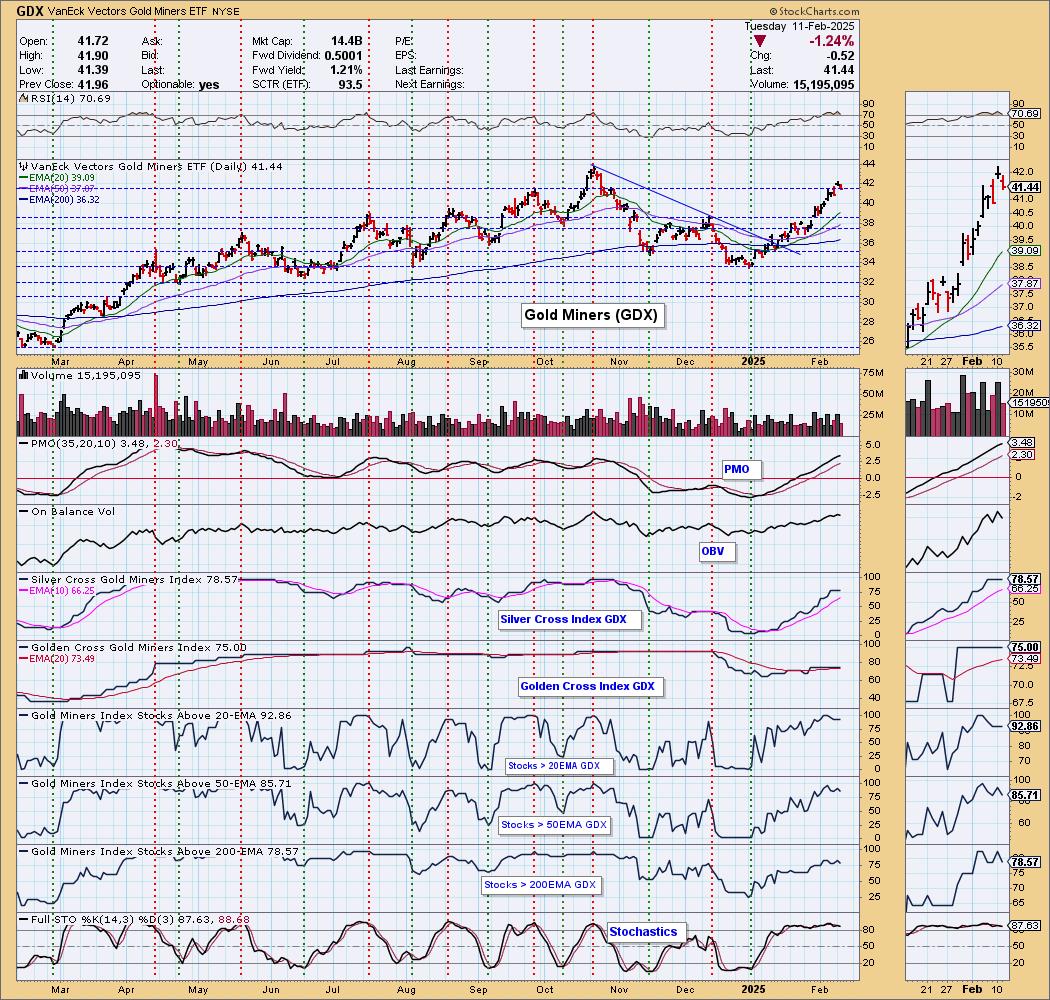
GOLD MINERS (GDX) Daily Chart: Gold Miners pulled back with Gold. We are looking for a pause or small pullback on Gold so we should expect the same from GDX. It is at overhead resistance so this would be a natural place for a downturn or pause. Indicators and participation are still very bullish so as with Gold we aren't expecting a deep decline.
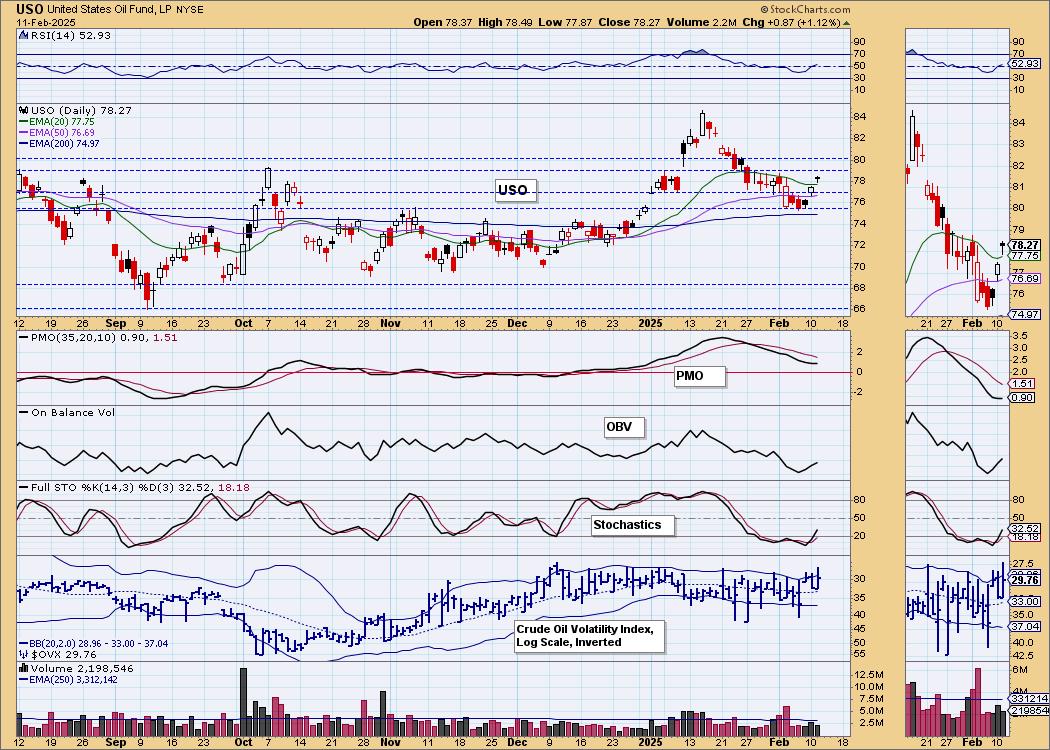
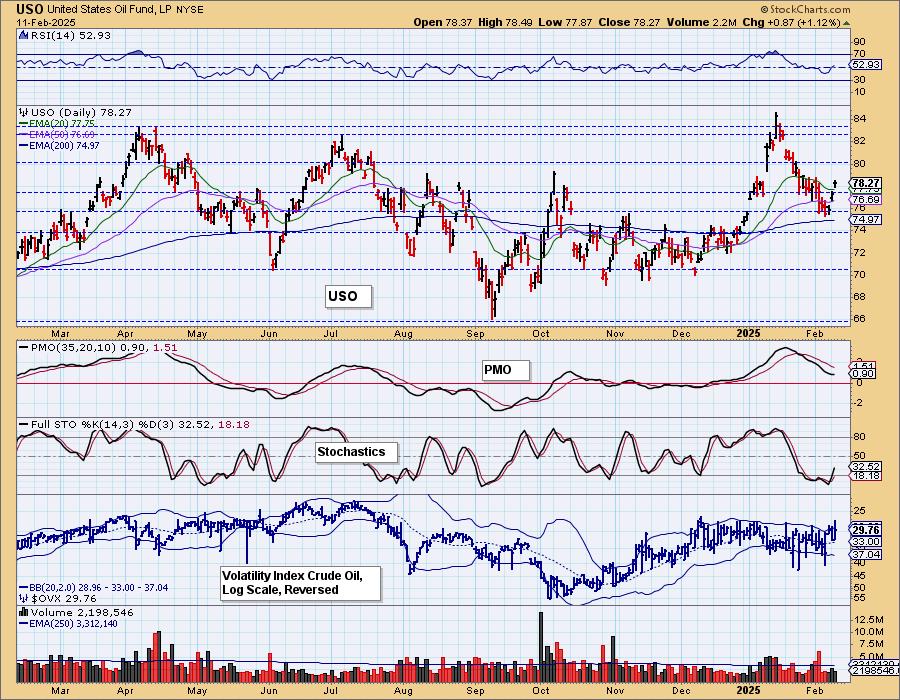
CRUDE OIL (USO)
IT Trend Model: BUY as of 12/24/2024
LT Trend Model: BUY as of 1/10/2025
USO Daily Chart: We're getting a nice rally off support at the November top and 200-day EMA. The PMO hasn't turned up yet, but we do have the RSI back in positive territory and Stochastics rising. The declining trend has also been broken so maybe we will see a good rally in spite of the administration's effort to keep Oil prices low. Overhead resistance isn't far away so we'll know very soon how genuine this rally is or whether it will fail miserably.
Good Luck & Good Trading!
Erin Swenlin and Carl Swenlin
Technical Analysis is a windsock, not a crystal ball. --Carl Swenlin
(c) Copyright 2025 DecisionPoint.com
Disclaimer: This blog is for educational purposes only and should not be construed as financial advice. The ideas and strategies should never be used without first assessing your own personal and financial situation, or without consulting a financial professional. Any opinions expressed herein are solely those of the author, and do not in any way represent the views or opinions of any other person or entity.
DecisionPoint is not a registered investment advisor. Investment and trading decisions are solely your responsibility. DecisionPoint newsletters, blogs or website materials should NOT be interpreted as a recommendation or solicitation to buy or sell any security or to take any specific action.
NOTE: The signal status reported herein is based upon mechanical trading model signals, specifically, the DecisionPoint Trend Model. They define the implied bias of the price index based upon moving average relationships, but they do not necessarily call for a specific action. They are information flags that should prompt chart review. Further, they do not call for continuous buying or selling during the life of the signal. For example, a BUY signal will probably (but not necessarily) return the best results if action is taken soon after the signal is generated. Additional opportunities for buying may be found as price zigzags higher, but the trader must look for optimum entry points. Conversely, exit points to preserve gains (or minimize losses) may be evident before the model mechanically closes the signal.
Helpful DecisionPoint Links:
DecisionPoint Alert Chart List
DecisionPoint Golden Cross/Silver Cross Index Chart List
DecisionPoint Sector Chart List
Price Momentum Oscillator (PMO)