
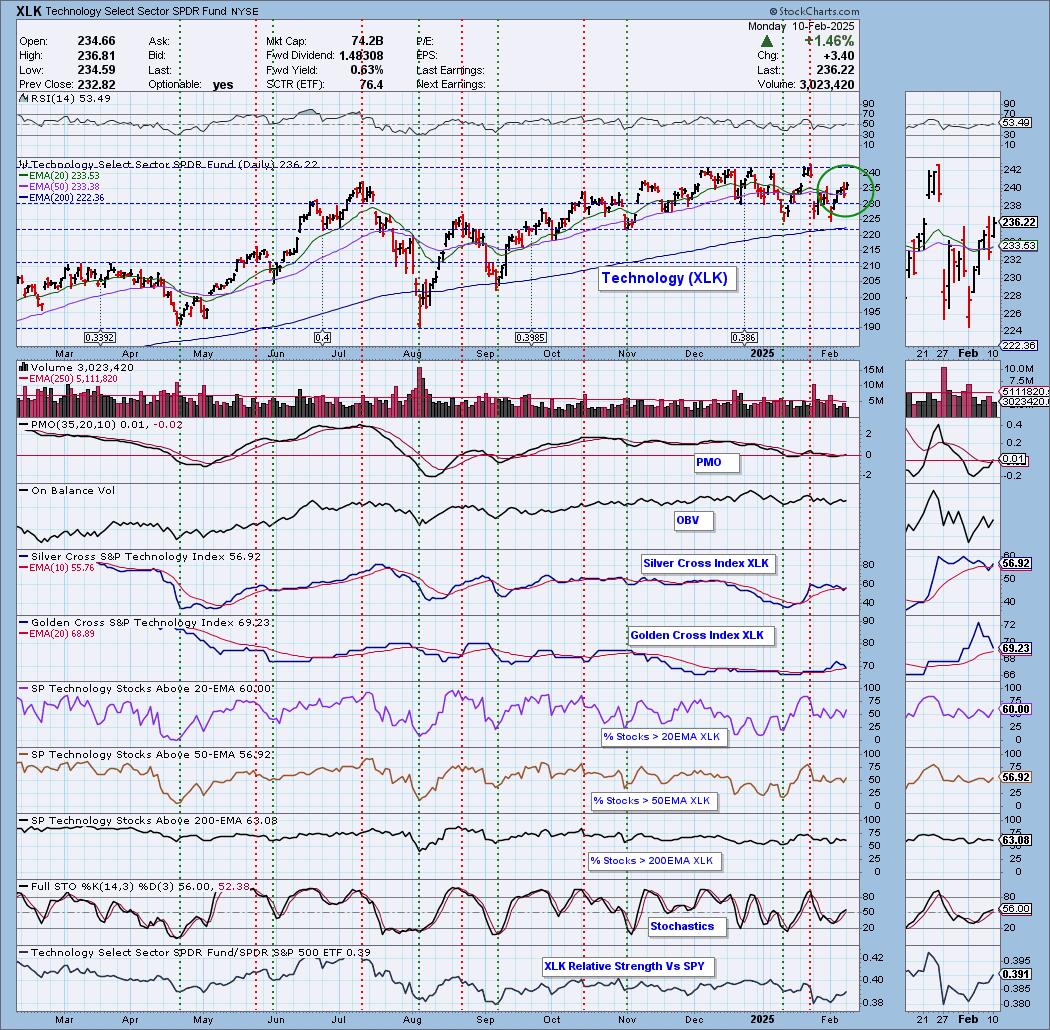
Today the Technology Sector ETF (XLK) 20-day EMA crossed up through the 50-day EMA (Silver Cross), generating an IT Trend Model BUY Signal. The moving averages are on top of each other, and the signal could be reversed tomorrow. Price does look as if it wants to test overhead resistance and the PMO is on a new Crossover BUY Signal. Still, we don't expect much upside from there.
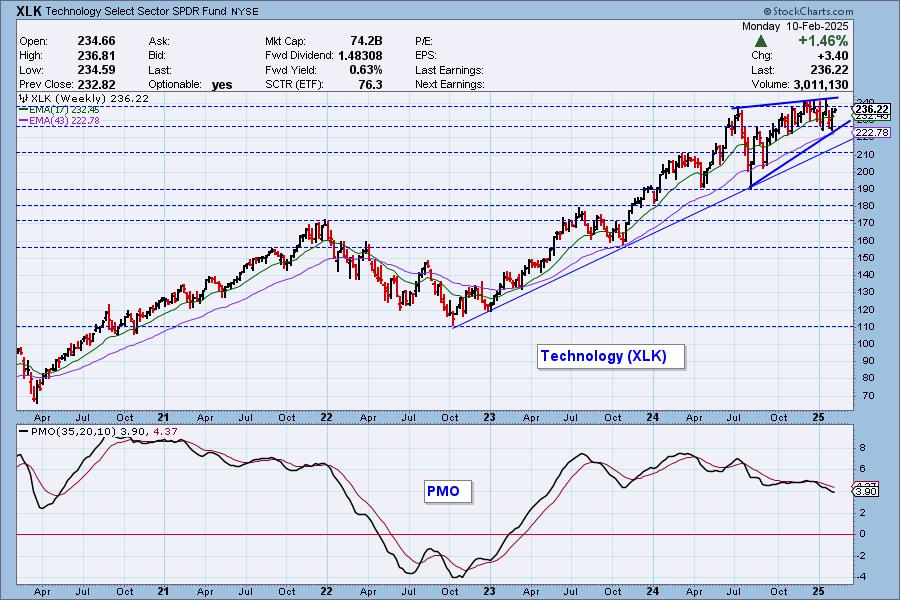
The XLK weekly chart shows a bearish rising wedge. The weekly PMO is in decline so the expectation would be a breakdown.
The DecisionPoint Alert Weekly Wrap presents an end-of-week assessment of the trend and condition of the Stock Market, the U.S. Dollar, Gold, Crude Oil, and Bonds. The DecisionPoint Alert daily report (Monday through Thursday) is abbreviated and gives updates on the Weekly Wrap assessments.
Watch the latest episode of DecisionPoint on our YouTube channel here!
MARKET/INDUSTRY GROUP/SECTOR INDEXES
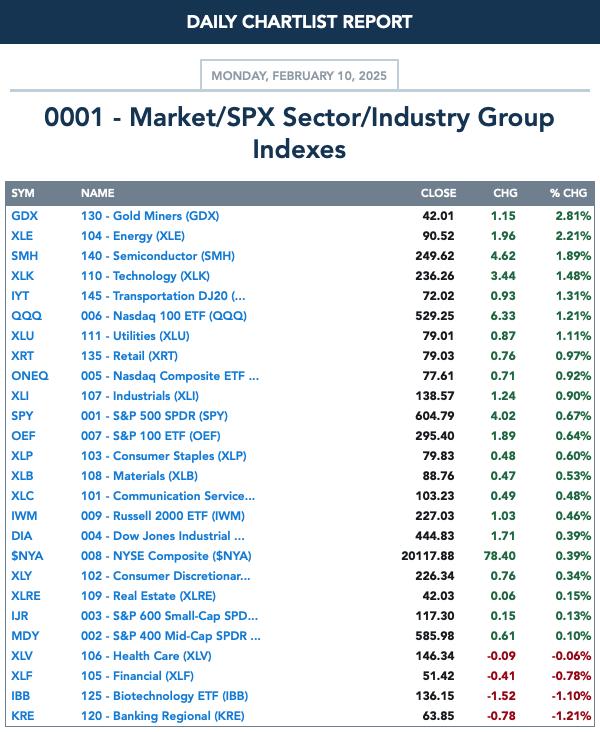
CLICK HERE for Carl's annotated Market Index, Sector, and Industry Group charts.
THE MARKET (S&P 500)
IT Trend Model: BUY as of 8/14/2024
LT Trend Model: BUY as of 3/29/2023
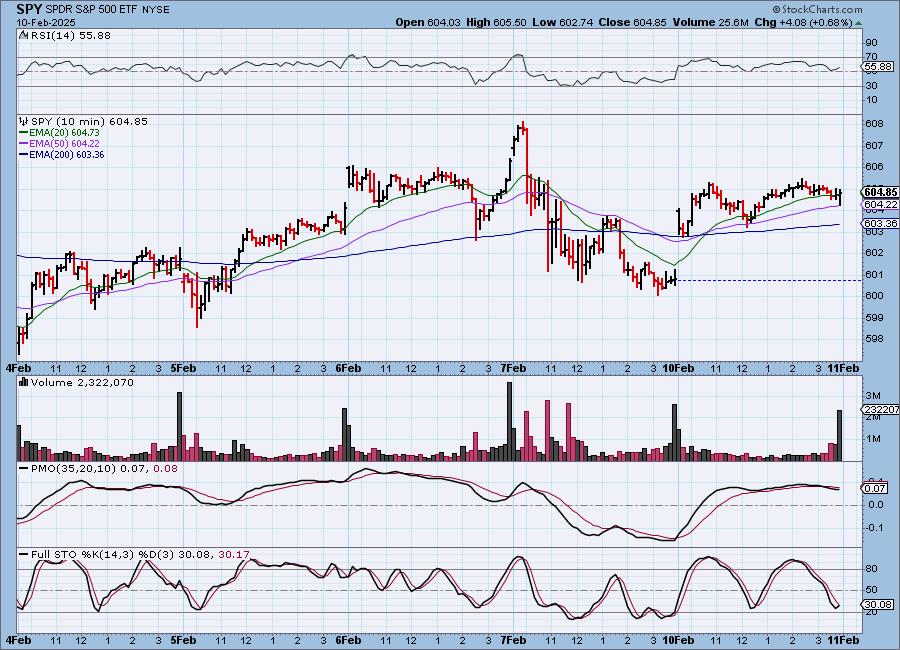
SPY 10-Minute Chart: Price gapped up on the open and did manage to make its way higher after trading mostly sideways during the day. The 10-minute PMO is in decline.
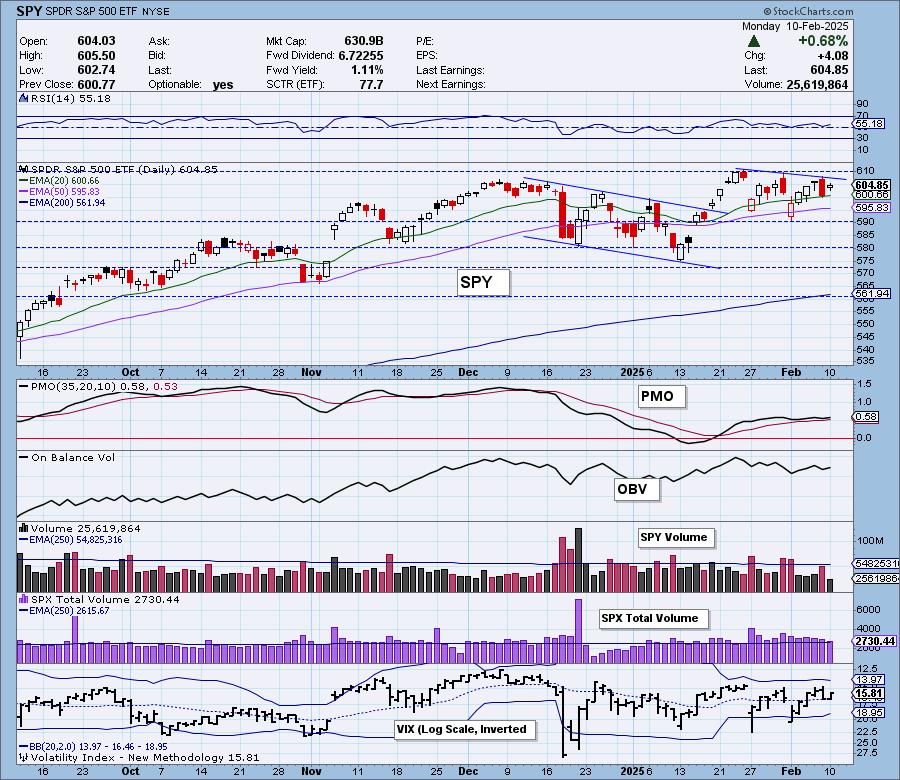
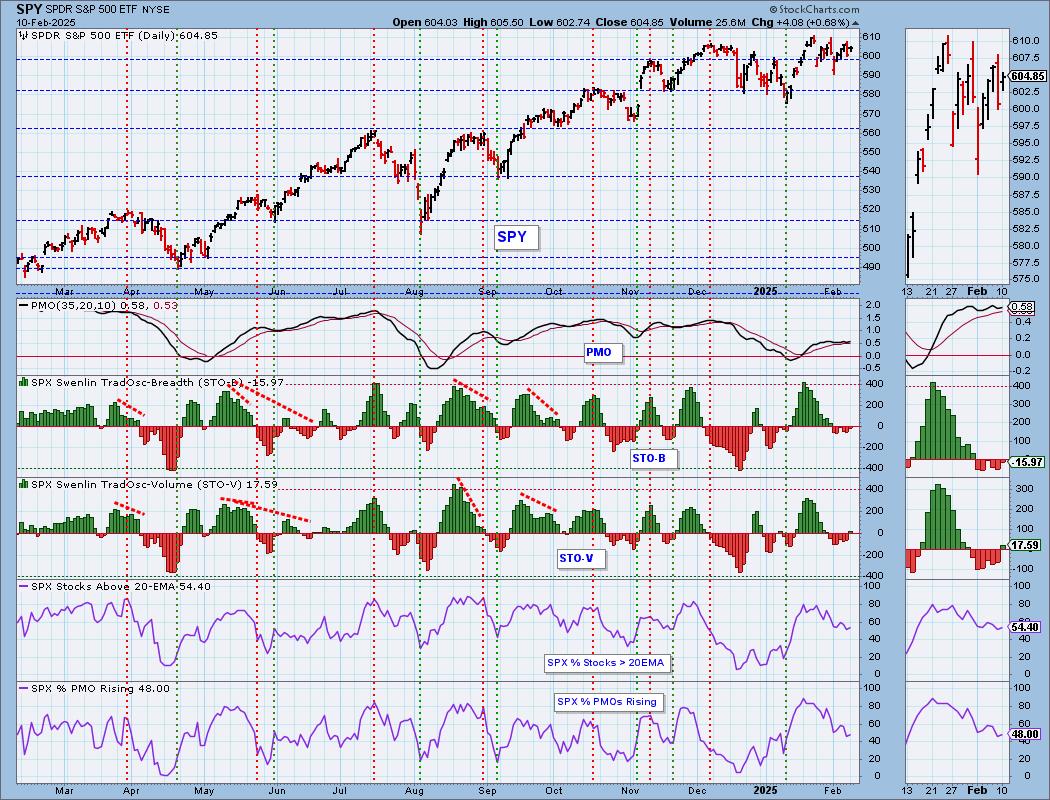
SPY Daily Chart: The short-term declining trend is still intact as we saw a lower high today. The PMO is still rising for now and the RSI is not overbought.
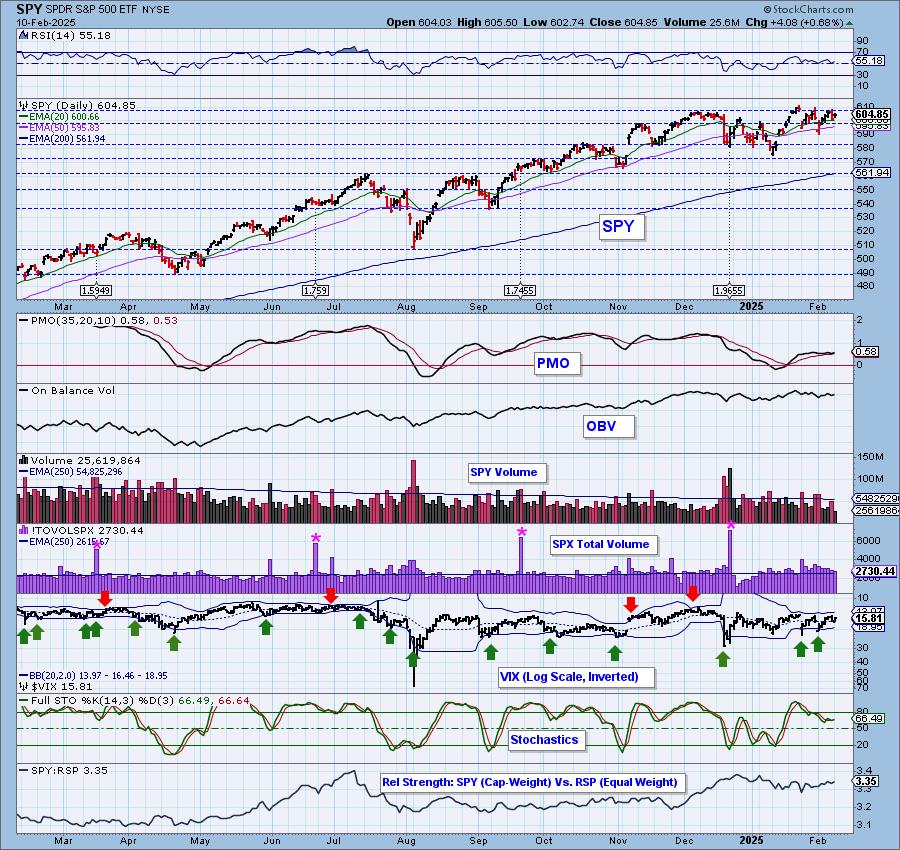
Stochastics have flattened out not flashing strength or weakness at this point. The VIX is very crowded within the Bollinger Bands so punctures in either direction should be taken with a grain of salt. We look for upside punctures to determine a possible top and downside punctures looking for a possible bottom. At this time it is above its moving average on the inverted scale so it can be read as somewhat positive.

Here is the latest recording from 2/10. Click HERE to get to our video list.:
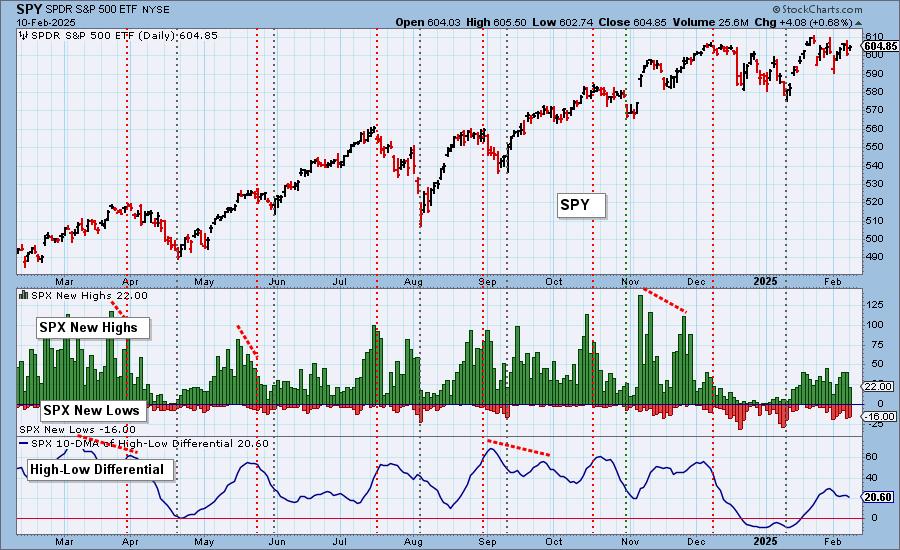
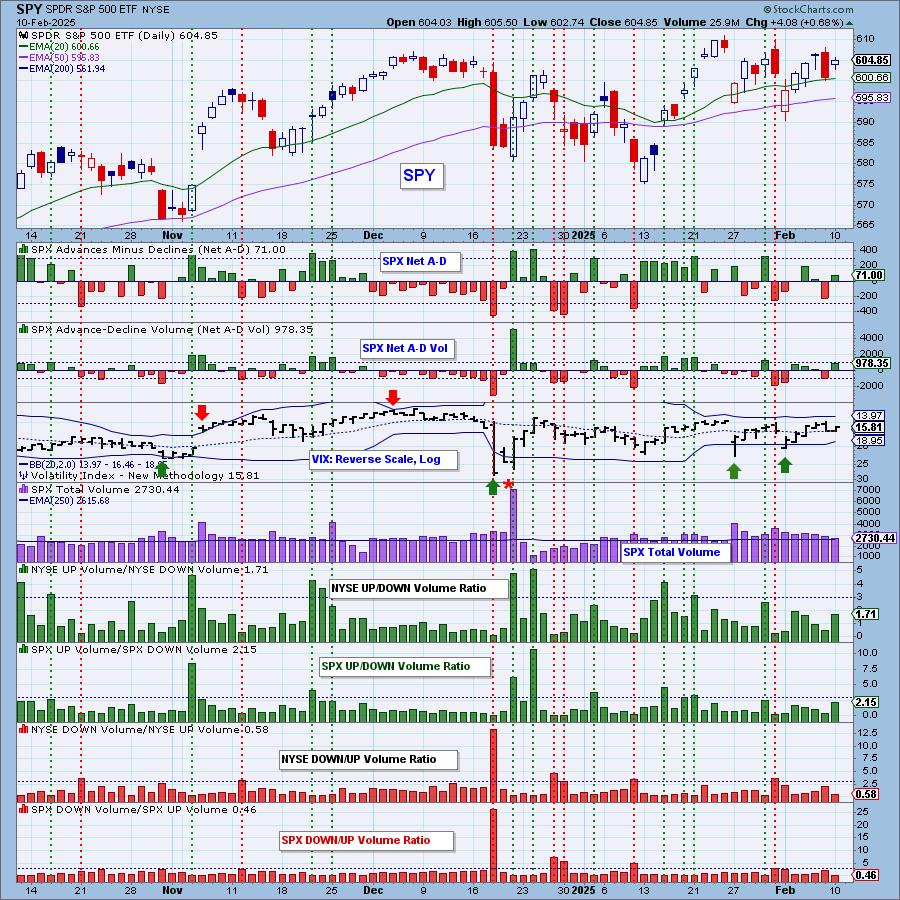
S&P 500 New 52-Week Highs/Lows: New Highs did pare back on the rally and we saw a number of New Lows. The High-Low Differential is in a declining trend which doesn't bode well.
Climax* Analysis: There were no climax readings today.
*A climax is a one-day event when market action generates very high readings in, primarily, breadth and volume indicators. We also include the VIX, watching for it to penetrate outside the Bollinger Band envelope. The vertical dotted lines mark climax days -- red for downside climaxes, and green for upside. Climaxes are at their core exhaustion events; however, at price pivots they may be initiating a change of trend.
Short-Term Market Indicators: The short-term market trend is DOWN and the condition is NEUTRAL.
Both Swenlin Trading Oscillators (STOs) turned up today with the STO-V hitting positive territory so maybe there is a bit more upside to be had. Participation is in a declining trend and reading at only 54% of stocks holding above their 20-day EMAs. We also have a low reading on %PMOs Rising and it is also in a declining trend.
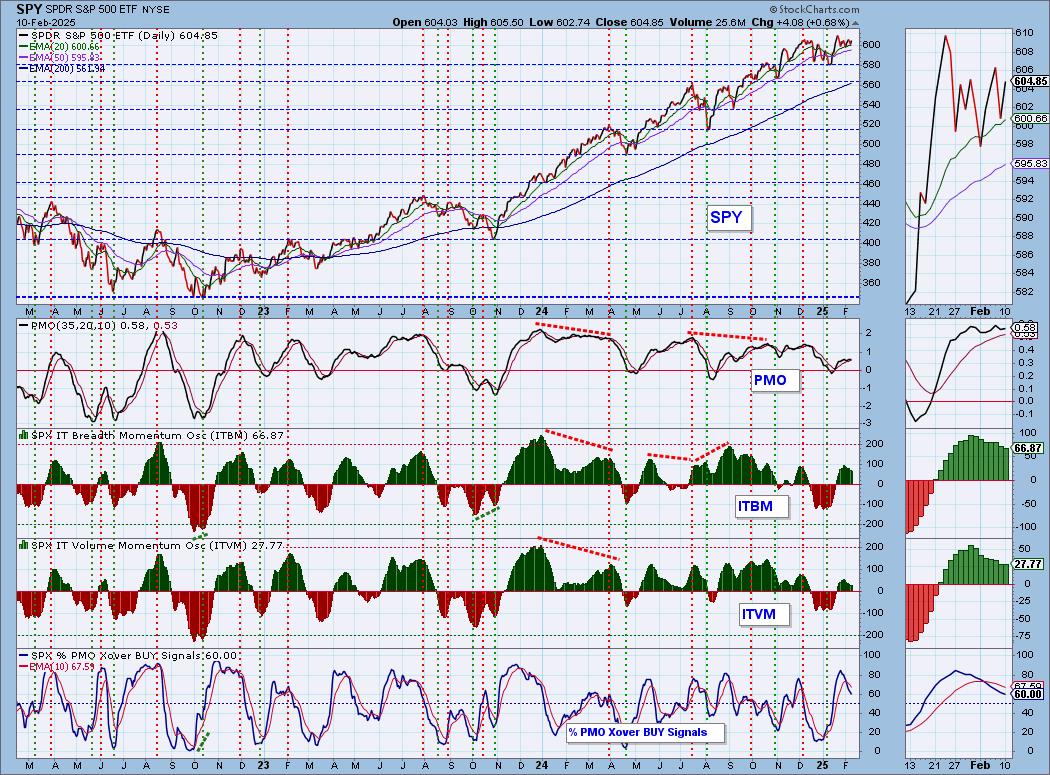
Intermediate-Term Market Indicators: The intermediate-term market trend is UP and the condition is NEUTRAL.
The ITBM continued to make its way lower while the ITVM held the same reading. They may be interested in reversing higher, but we do not like the loss of PMO BUY Signals within the index.
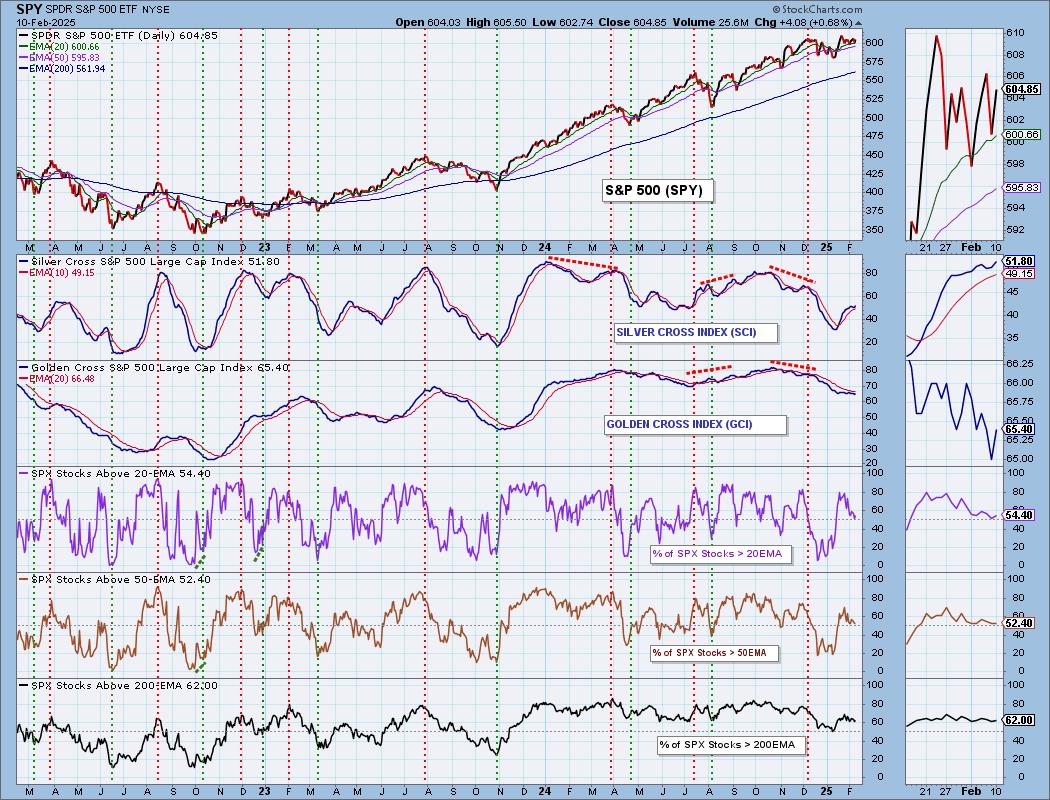
PARTICIPATION CHART (S&P 500): The following chart objectively shows the depth and trend of participation for the SPX in two time frames.
- Intermediate-Term - the Silver Cross Index (SCI) shows the percentage of SPX stocks on IT Trend Model BUY signals (20-EMA > 50-EMA). The opposite of the Silver Cross is a "Dark Cross" -- those stocks are, at the very least, in a correction.
- Long-Term - the Golden Cross Index (GCI) shows the percentage of SPX stocks on LT Trend Model BUY signals (50-EMA > 200-EMA). The opposite of a Golden Cross is the "Death Cross" -- those stocks are in a bear market.
The market bias is BULLISH in the intermediate term.
The market bias is BEARISH in the long term.
Participation is in declining trends across the board. On the bright side, the Silver Cross Index has turned back up above its signal line. Because it is above its signal line the IT Bias is BULLISH. The Golden Cross Index reversed higher but that condition isn't likely to last given we have fewer stocks above their 200-day EMAs. We need price above the 200-day EMA in order to preserve a Golden Cross. The Golden Cross Index is below its signal line so the LT Bias is still BEARISH despite a mildly bullish reading of 65%.
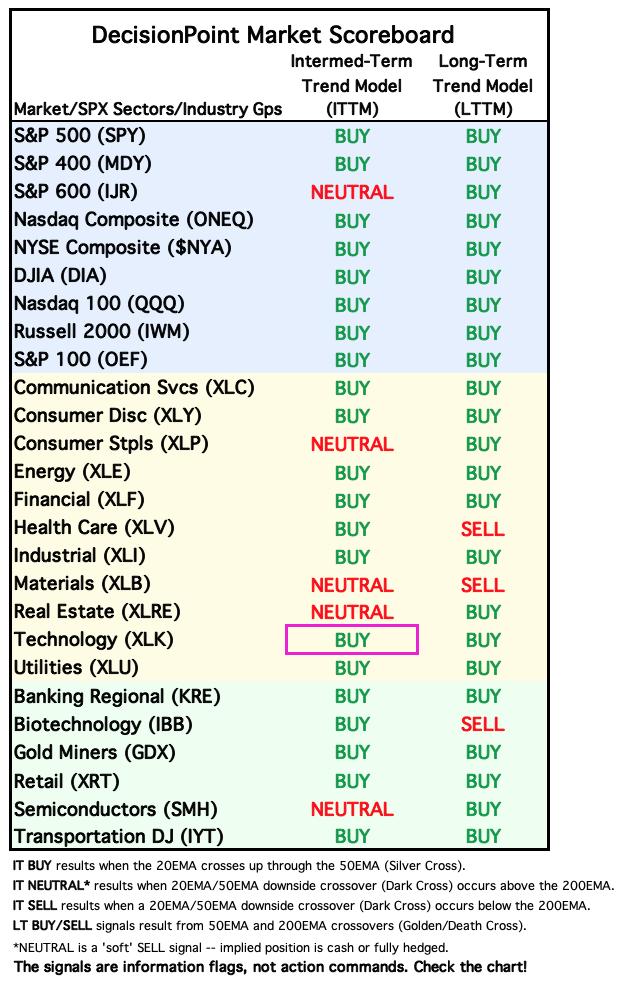
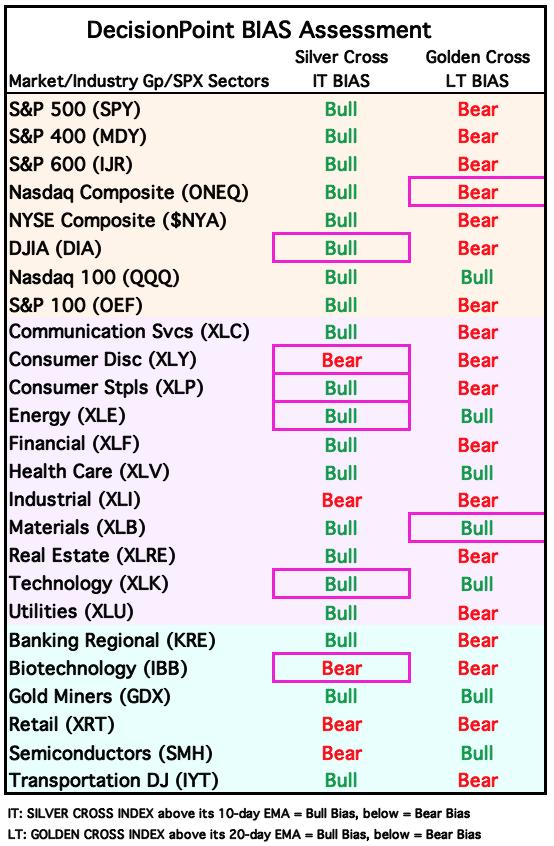
BIAS Assessment: The following table expresses the current BIAS of various price indexes based upon the relationship of the Silver Cross Index to its 10-day EMA (intermediate-term), and of the Golden Cross Index to its 20-day EMA (long-term). When the Index is above the EMA it is bullish, and it is bearish when the Index is below the EMA. The BIAS does not imply that any particular action should be taken. It is information to be used in the decision process.
The items with highlighted borders indicate that the BIAS changed today.
*****************************************************************************************************
CONCLUSION: We still don't like what is going on beneath the surface on the SPY. Participation is leaking as we see declining trends for stocks above key moving averages and PMO analysis also shows declining trends. Very short-term, we do see a rising PMO and STOs turned back up today. The ITVM nearly turned up. This suggests to us there may be a little more upside available here, but given weakening participation we think any upside will be limited. While we could see some more upside, it doesn't seem wise to be adding exposure given the weakness under the hood. In any case, we would use stops for protection in case a decline gets going.
Erin is 15% long, 0% short. (This is intended as information, not a recommendation.)
*****************************************************************************************************
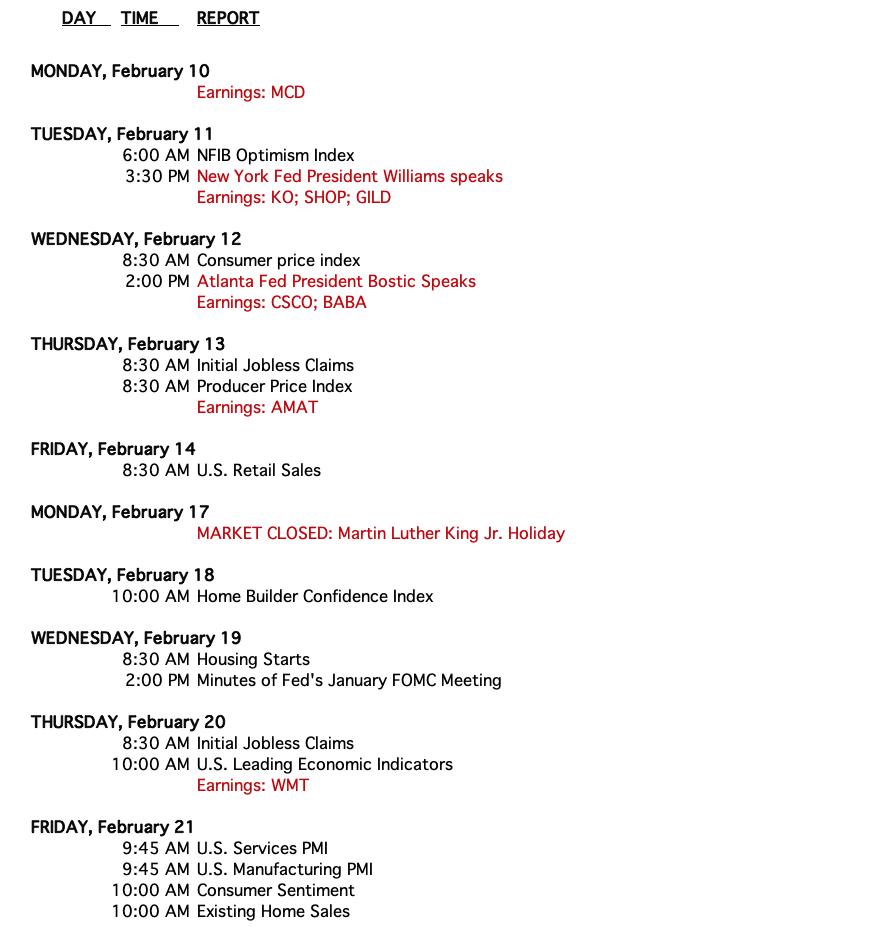
CALENDAR
Have you subscribed the DecisionPoint Diamonds yet? DP does the work for you by providing handpicked stocks/ETFs from exclusive DP scans! Add it with a discount! Contact support@decisionpoint.com for more information!
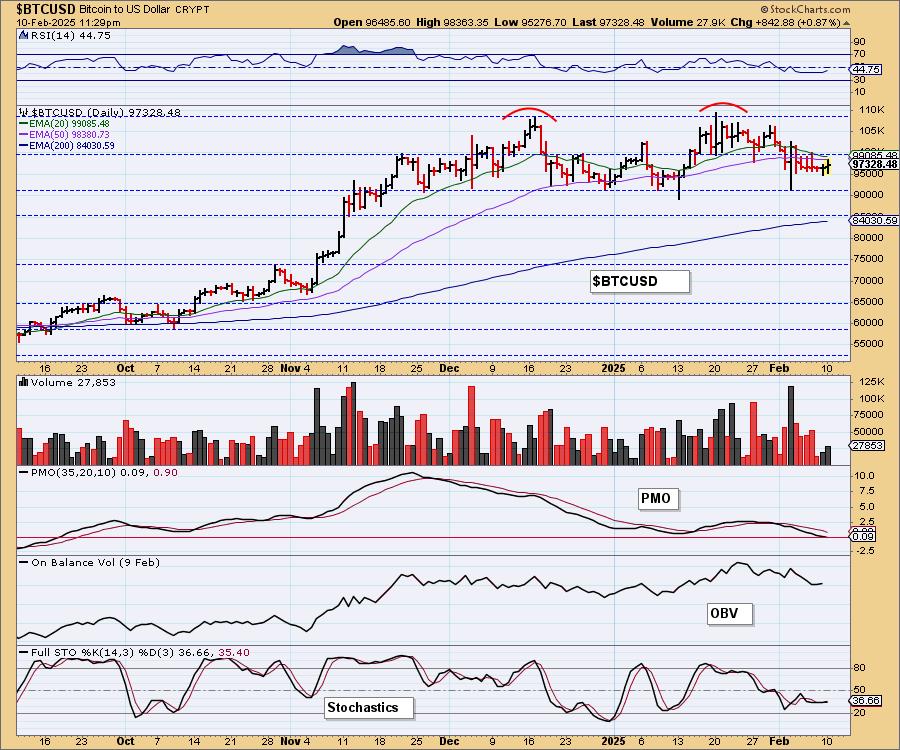
BITCOIN
Bitcoin is consolidating sideways after its big run higher after the election. It is now in a declining trend headed to test support. The PMO is declining and Stochastics are in negative territory below net neutral (50). The RSI is also in negative territory. Our expectation is another test of support at 90,000.
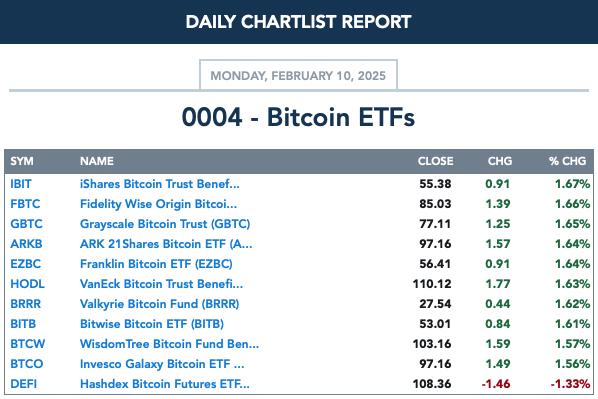
BITCOIN ETFs
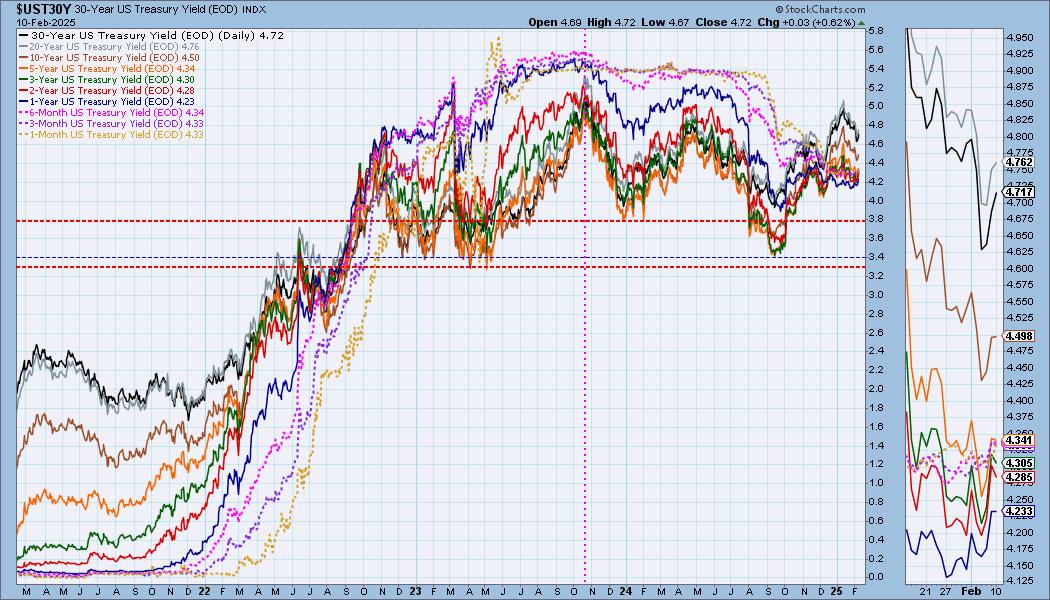
INTEREST RATES
Interest rates are trending lower but today most long-term yields saw gains. We expect them to fall a bit further as rising trends out of the 2024 lows were essentially broken, but we are watching closely for a reversal given they have been in decline for weeks.
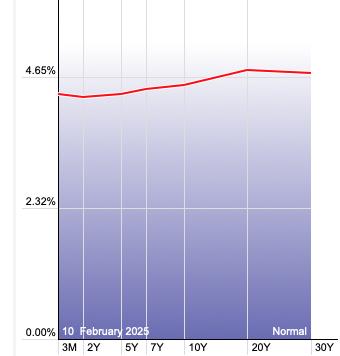
The Yield Curve Chart from StockCharts.com shows us the inversions taking place. The red line should move higher from left to right. Inversions are occurring where it moves downward.
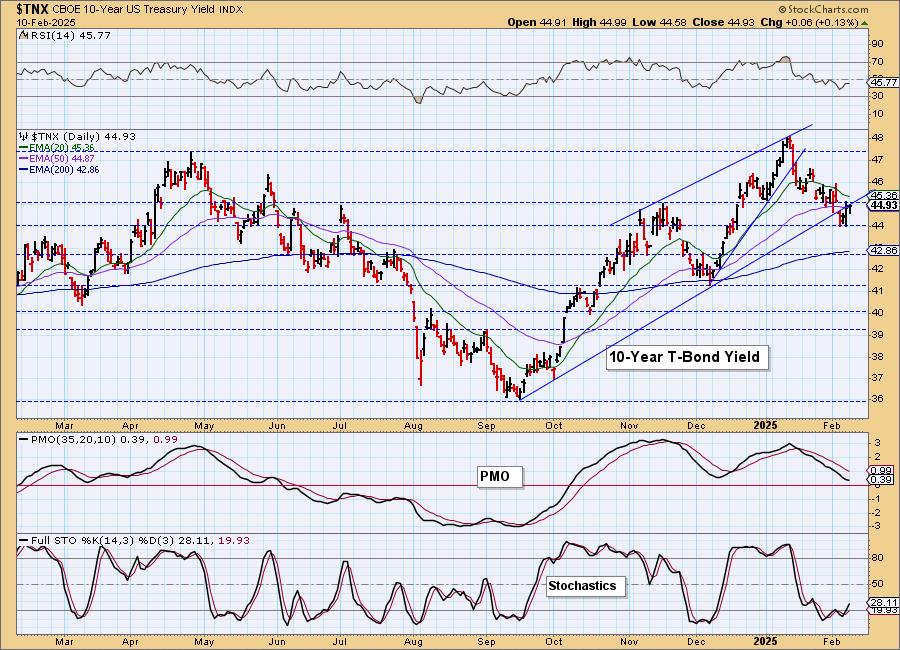
10-YEAR T-BOND YIELD
$TNX is holding support and is attempting to recapture its prior rising trend. The declining trend is still intact and the PMO falling so we see a bearish bias to the chart. However, we do note that Stochastics are rising again so we'll be on the lookout for a break of that trend.
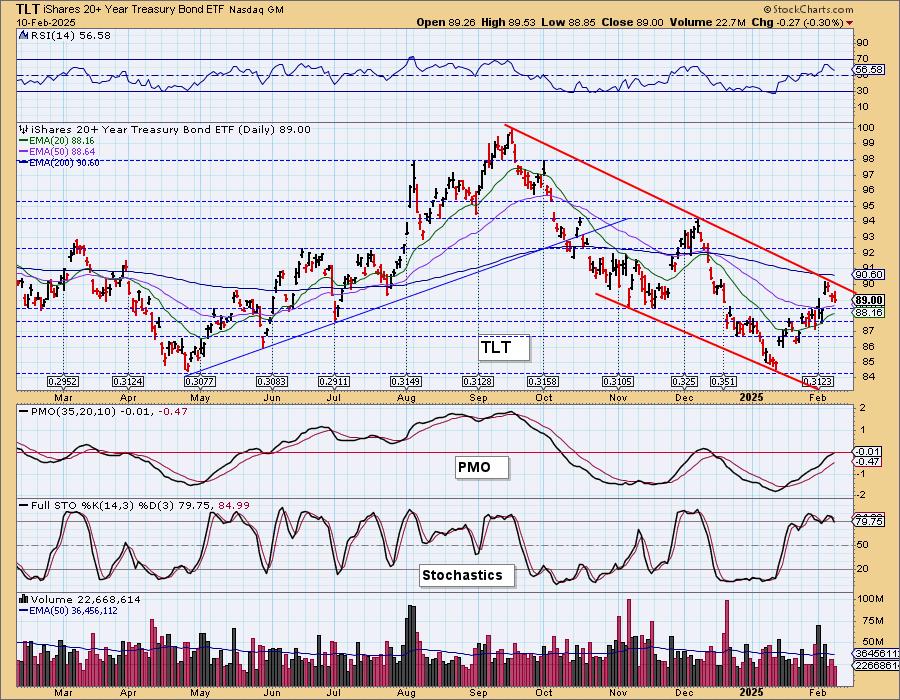
BONDS (TLT)
IT Trend Model: NEUTRAL as of 11/10/2024
LT Trend Model: SELL as of 12/13/2024
TLT Daily Chart: The 20-year yield is rising somewhat and that put a little downside pressure on Bonds. The rising trend is still intact and the PMO is almost above the zero line. Stochastics have topped, but are holding a reading near 80 so there is still some internal strength. We'll look for Bonds to rise a bit further, but we sense we are getting ready to see a shift in rates.
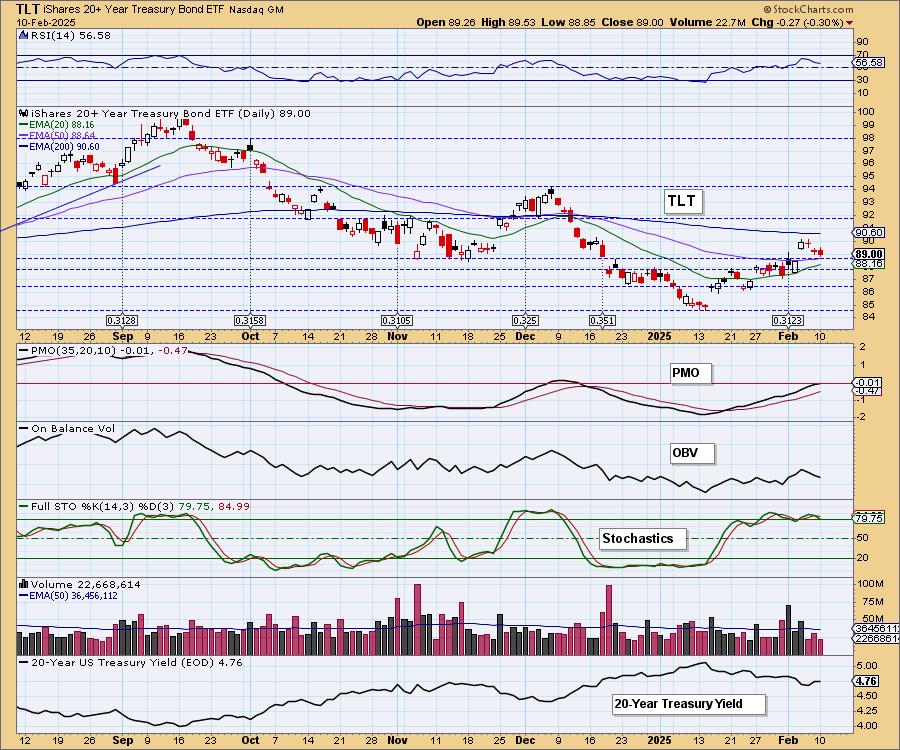
It's make or break time for TLT which is tapping the top of a declining trend channel. This is one reason why we are watching for a shift higher in yields soon.
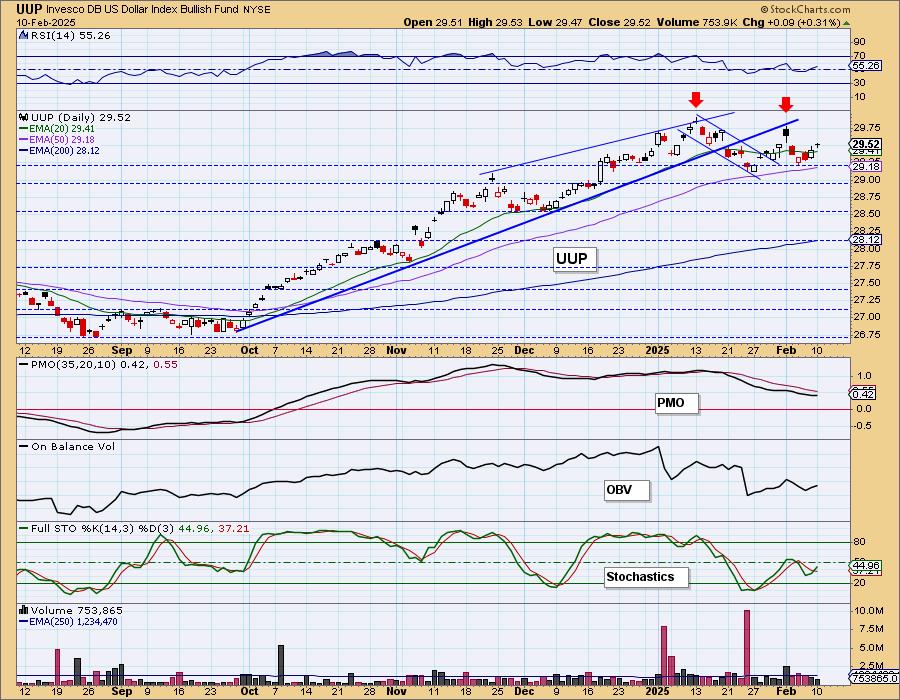
DOLLAR (UUP)
IT Trend Model: BUY as of 10/9/2024
LT Trend Model: BUY as of 5/25/2023
UUP Daily Chart: The Dollar is rallying yet again despite another topping chart pattern in the form of a bearish double top. That pattern won't be considered broken unless we get a breakout above those two tops. It is certainly possible as we see the shift higher in Stochastics. The PMO also wants to turn up. We're going to look for some sideways movement for now.
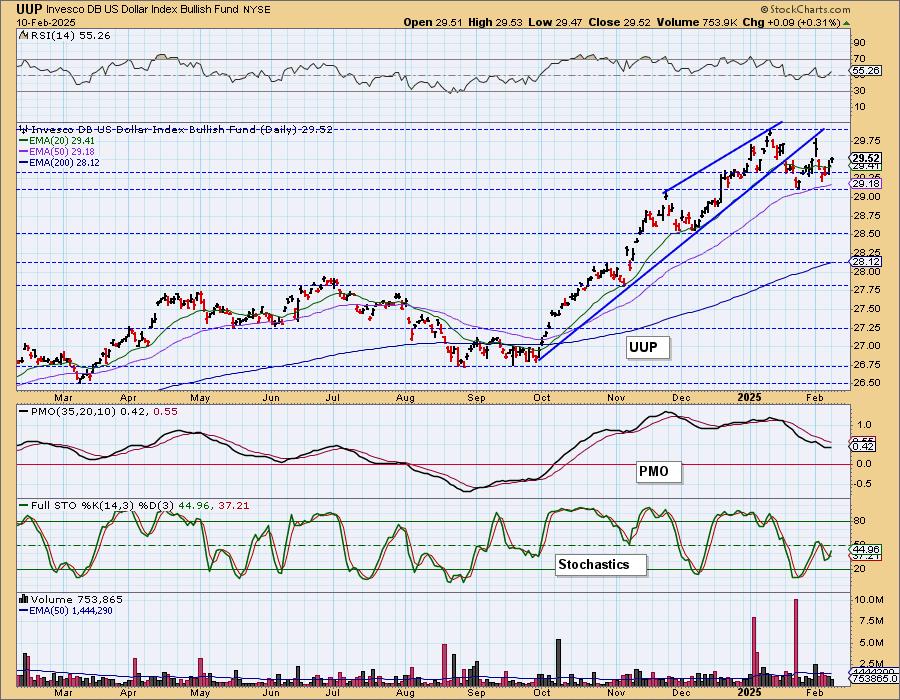
Price broke down from the bearish rising wedge as expected.
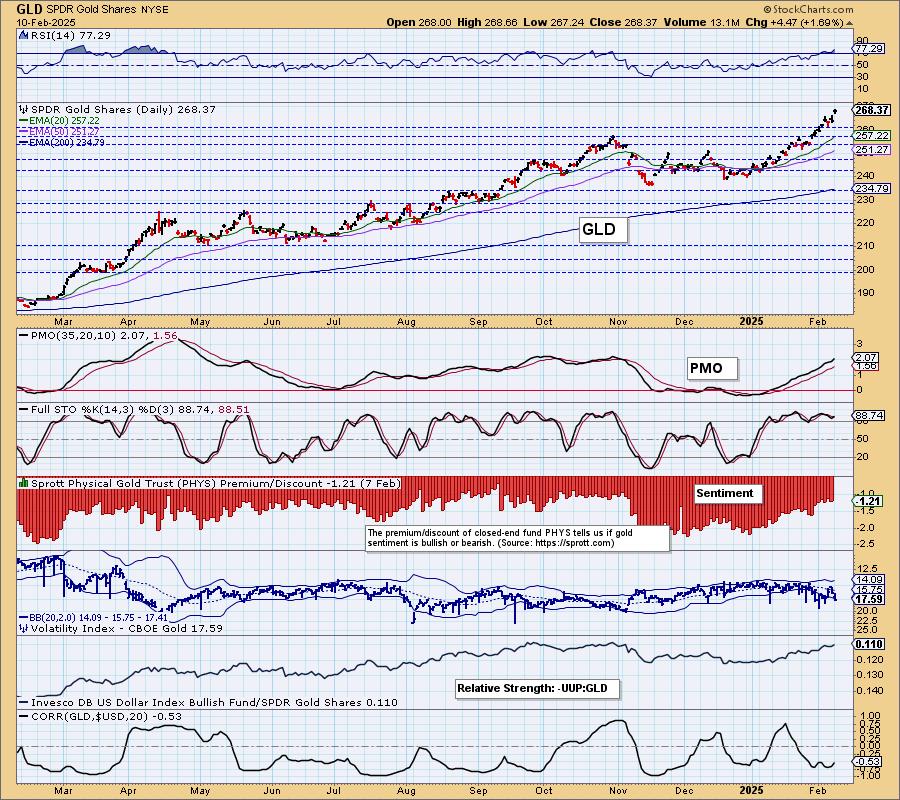
GOLD
IT Trend Model: BUY as of 1/10/2025
LT Trend Model: BUY as of 10/20/2023
GLD Daily Chart: Gold made another new all-time high today. The RSI is quite overbought and really tells us to look for a pause soon, but this rally looks solid. The PMO is rising strongly, but getting a bit overbought. Stochastics look great above 80. Check out the beautiful rising trend on Gold's relative strength against the Dollar.
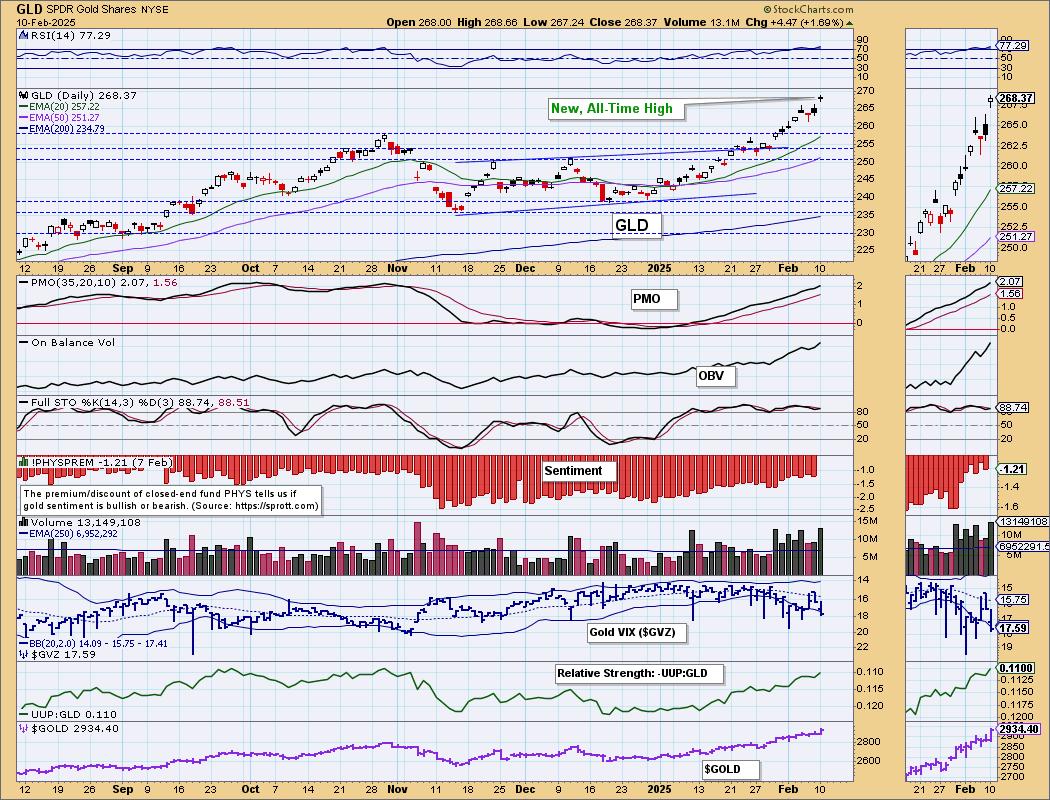
We continue to see discounts move slowly lower which makes sense as that means that investors are getting more bullish on Gold. They're not too bullish at this point as we don't see premiums, but they are getting in territory where we've seen tops.
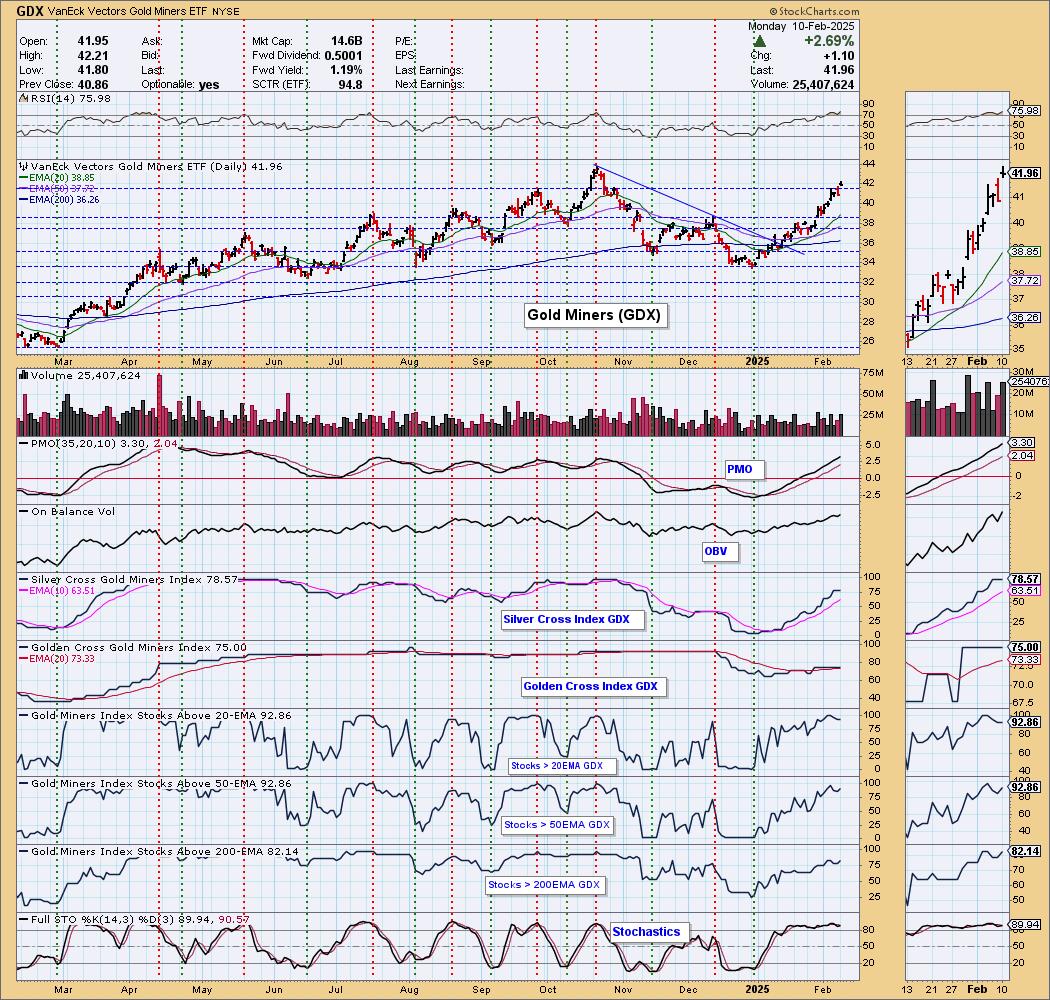
GOLD MINERS (GDX) Daily Chart: Gold Miners are enjoying quite a rally on the back of Gold prices. They should continue to move higher, but we should be on the lookout for a possible pause or consolidation as the RSI has been overbought for quite a few trading days, but ultimately we are looking for an eventual breakout above the October high.
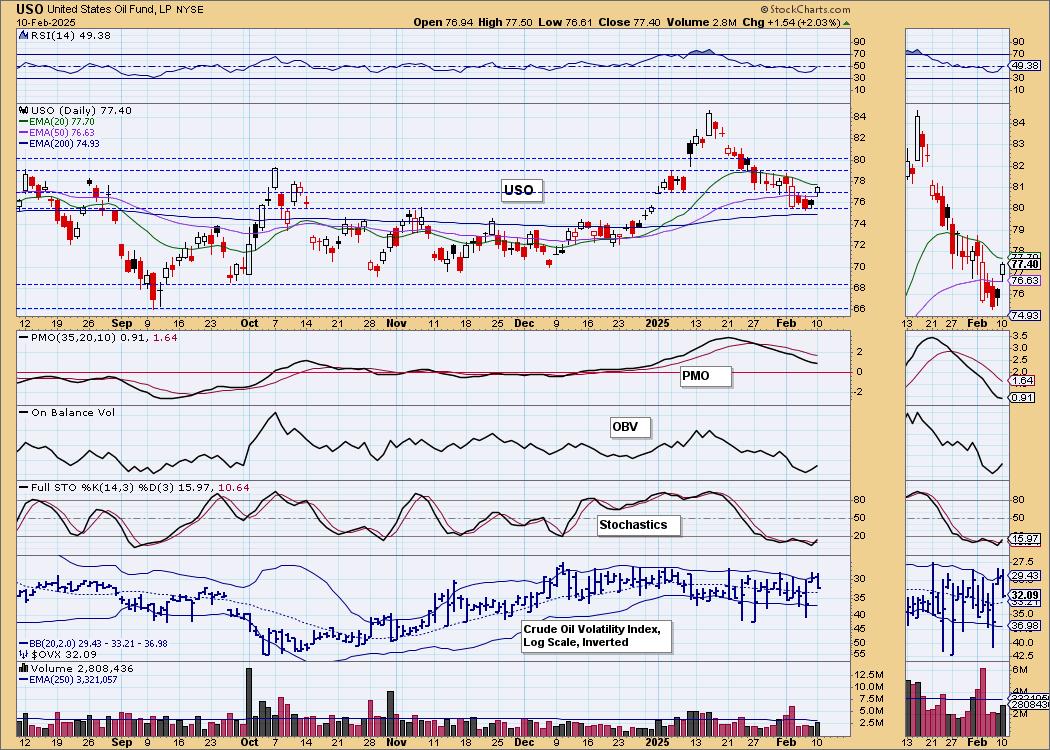
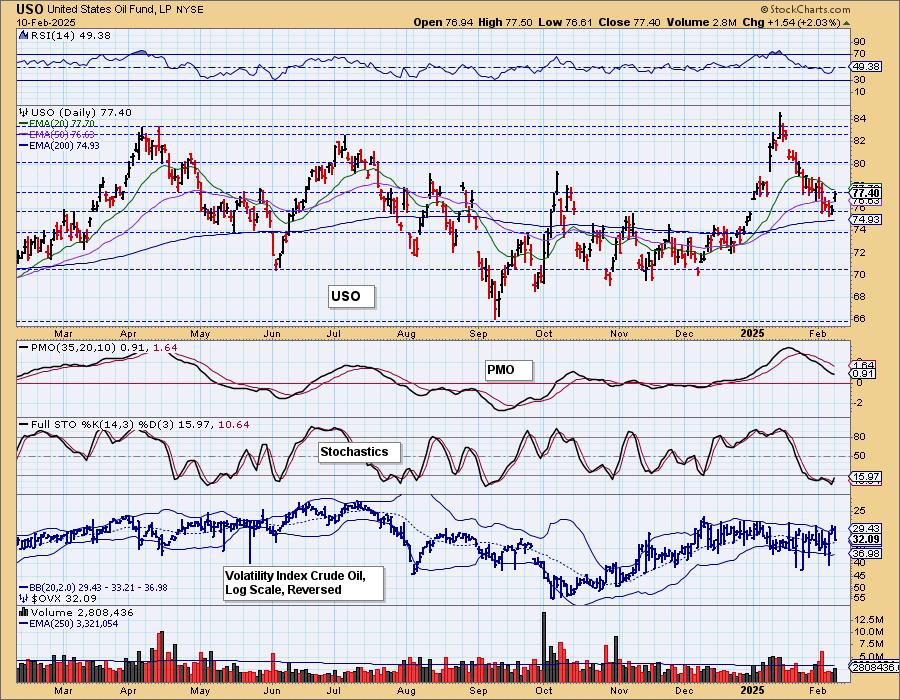
CRUDE OIL (USO)
IT Trend Model: BUY as of 12/24/2024
LT Trend Model: BUY as of 1/10/2025
USO Daily Chart: Crude is starting to come out of its declining trend and is rebounding off a very interesting area of support. We still think upside is limited for Crude Oil with the new administration's effort to bring down Crude prices, but this looks like a possible rally ahead off this strong support level at November top and 200-day EMA. The PMO is beginning to decelerate already and Stochastics have turned up so we would look for a small rally that likely won't stick around very long.
Good Luck & Good Trading!
Erin Swenlin and Carl Swenlin
Technical Analysis is a windsock, not a crystal ball. --Carl Swenlin
(c) Copyright 2025 DecisionPoint.com
Disclaimer: This blog is for educational purposes only and should not be construed as financial advice. The ideas and strategies should never be used without first assessing your own personal and financial situation, or without consulting a financial professional. Any opinions expressed herein are solely those of the author, and do not in any way represent the views or opinions of any other person or entity.
DecisionPoint is not a registered investment advisor. Investment and trading decisions are solely your responsibility. DecisionPoint newsletters, blogs or website materials should NOT be interpreted as a recommendation or solicitation to buy or sell any security or to take any specific action.
NOTE: The signal status reported herein is based upon mechanical trading model signals, specifically, the DecisionPoint Trend Model. They define the implied bias of the price index based upon moving average relationships, but they do not necessarily call for a specific action. They are information flags that should prompt chart review. Further, they do not call for continuous buying or selling during the life of the signal. For example, a BUY signal will probably (but not necessarily) return the best results if action is taken soon after the signal is generated. Additional opportunities for buying may be found as price zigzags higher, but the trader must look for optimum entry points. Conversely, exit points to preserve gains (or minimize losses) may be evident before the model mechanically closes the signal.
Helpful DecisionPoint Links:
DecisionPoint Alert Chart List
DecisionPoint Golden Cross/Silver Cross Index Chart List
DecisionPoint Sector Chart List
Price Momentum Oscillator (PMO)