
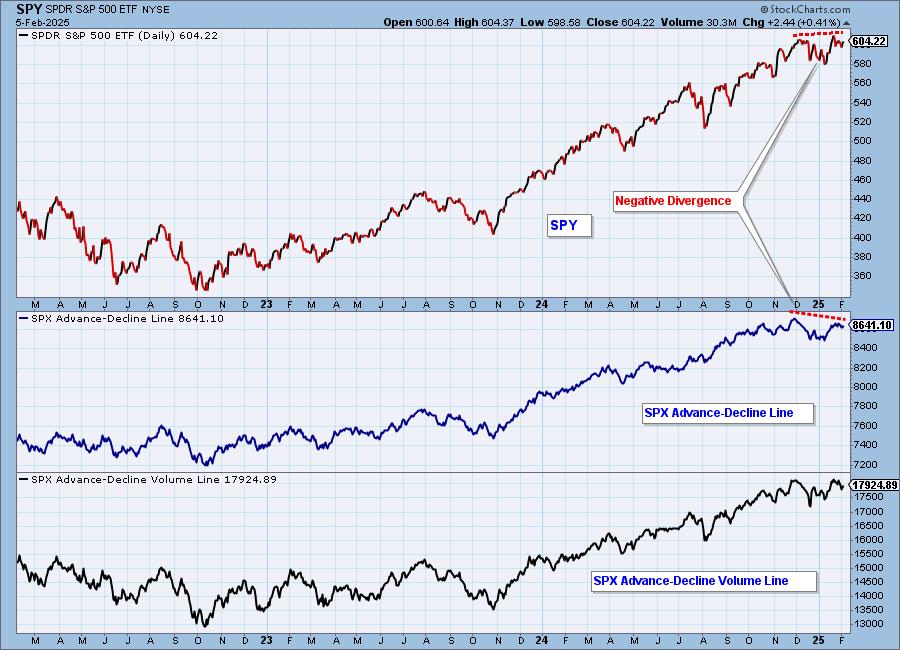
A basic concept in technical analysis is that, when indicator patterns diverge from price patterns, a trend reversal may be in the works. Today two divergences caught our attention. First the S&P 500 Advance-Decline Line has formed a negative divergence, meaning that internal breadth is weakening.
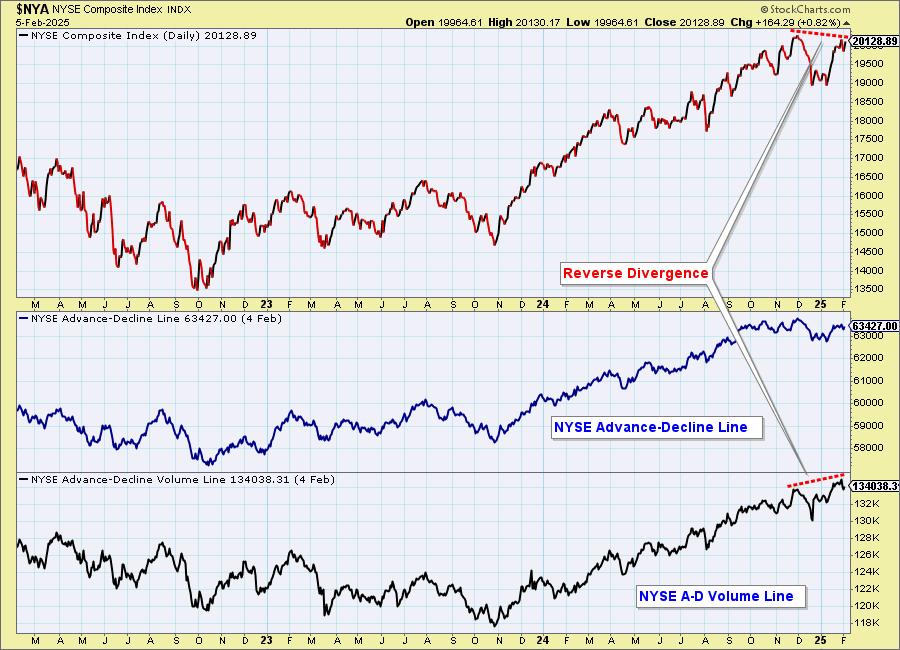
Second, the NYSE Advance-Decline Volume Line has formed a reverse divergence, meaning that it has its recent high has exceeded the December high, whereas the NYSE Composite has made a top lower than its December top. This tells us, that even though up volume was heavy, it failed to push price to new highs.
The DecisionPoint Alert Weekly Wrap presents an end-of-week assessment of the trend and condition of the Stock Market, the U.S. Dollar, Gold, Crude Oil, and Bonds. The DecisionPoint Alert daily report (Monday through Thursday) is abbreviated and gives updates on the Weekly Wrap assessments.
Watch the latest episode of DecisionPoint on our YouTube channel here!
MARKET/INDUSTRY GROUP/SECTOR INDEXES
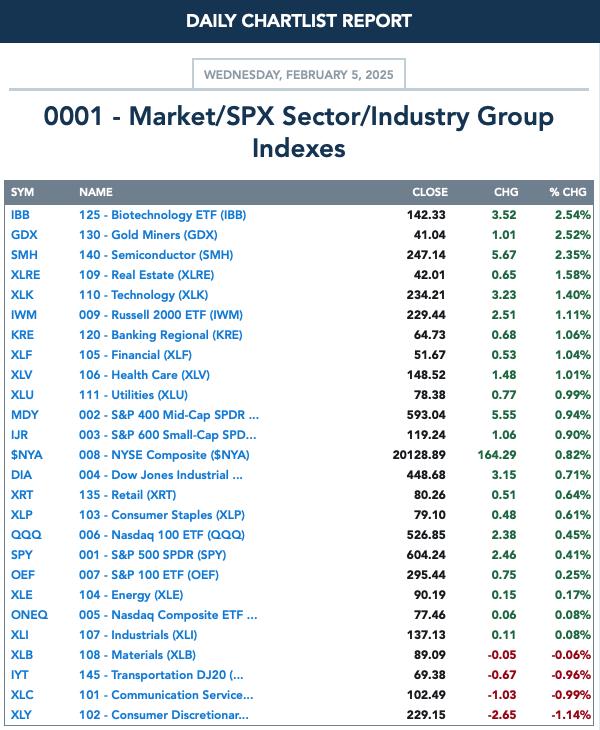
CLICK HERE for Carl's annotated Market Index, Sector, and Industry Group charts.
THE MARKET (S&P 500)
IT Trend Model: BUY as of 8/14/2024
LT Trend Model: BUY as of 3/29/2023
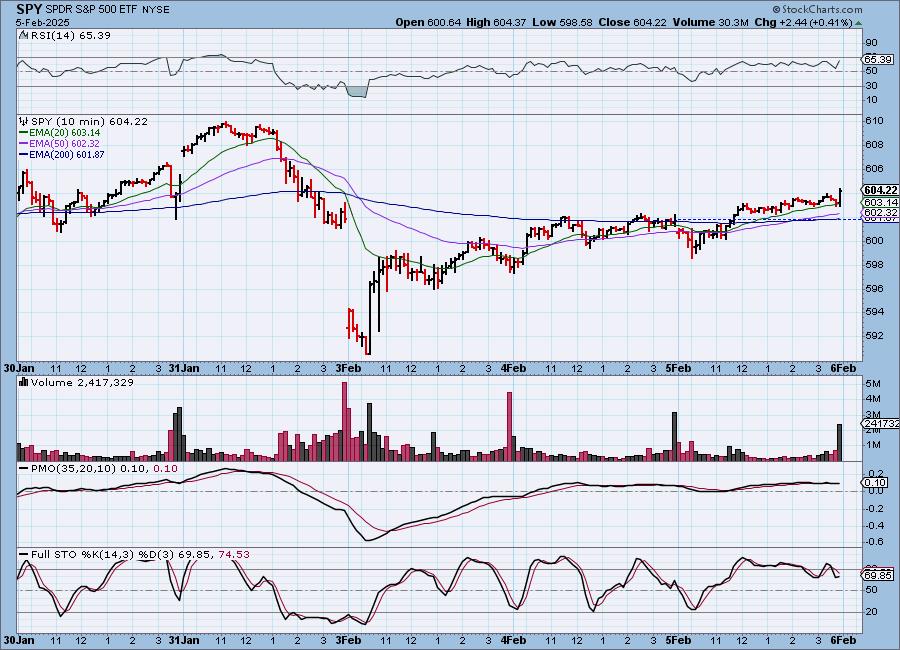
SPY 10-Minute Chart: The market opened lower on the day, but managed a rally recovery quickly. We saw a surge of buying in the last 10 minutes of trading. Stochastics turned up.
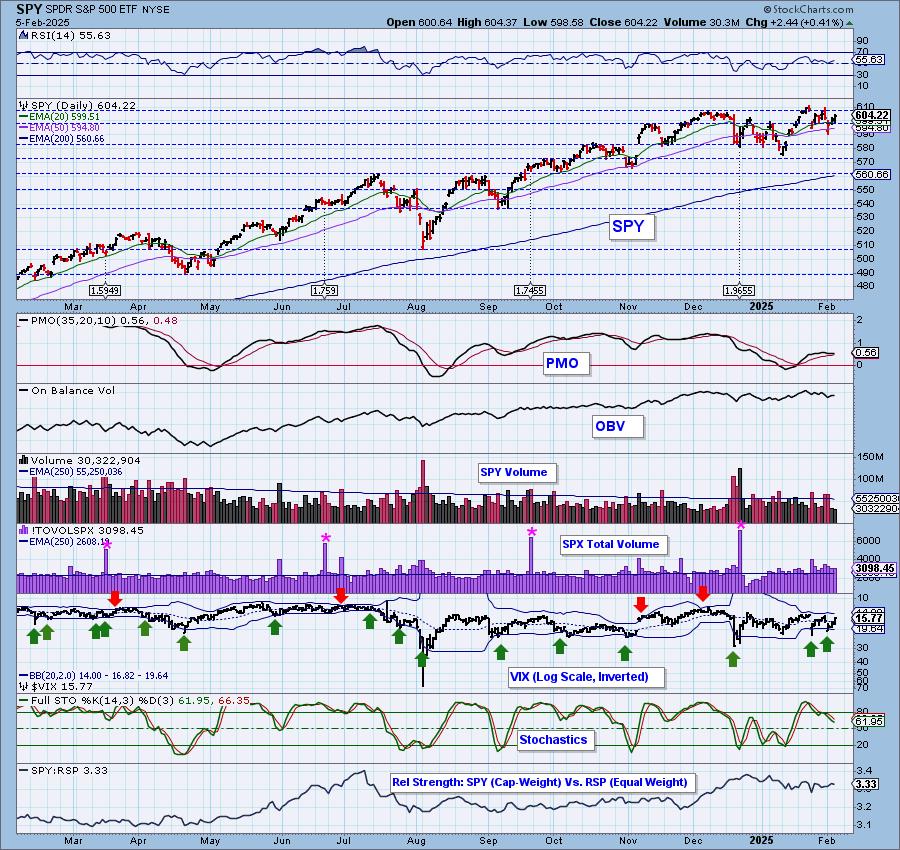
SPY Daily Chart: We have another declining trend established. On the bright side, the PMO did turn back up today.
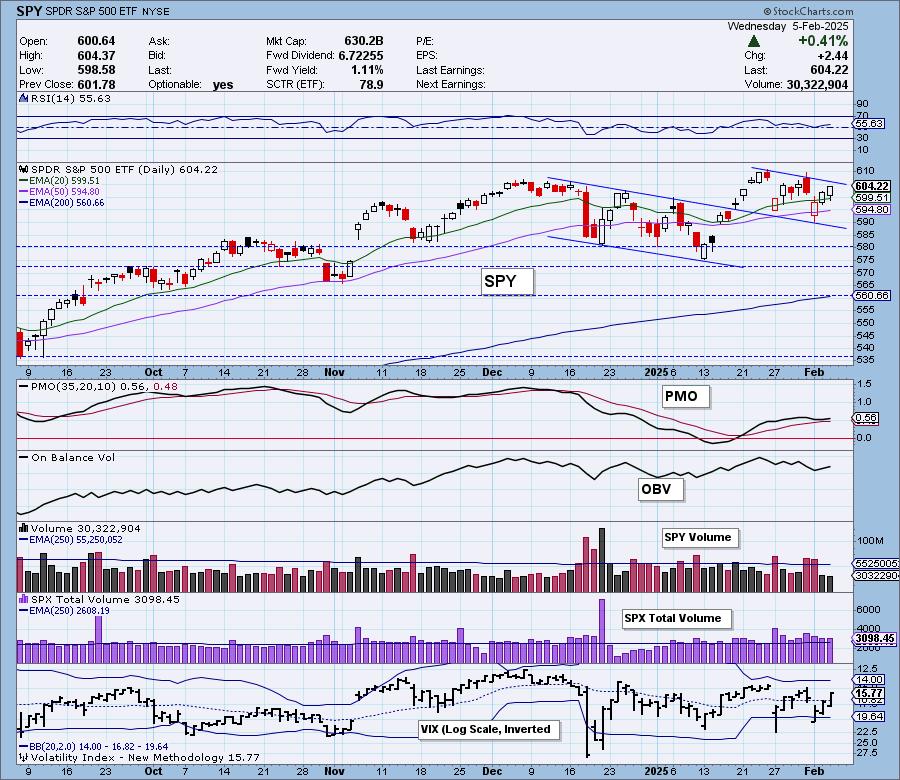
We have mixed readings on internal price strength. The VIX has moved above its moving average on the inverted scale which is positive, but Stochastics are declining.

Here is the latest recording from 2/3. Click HERE to get to our video list.:
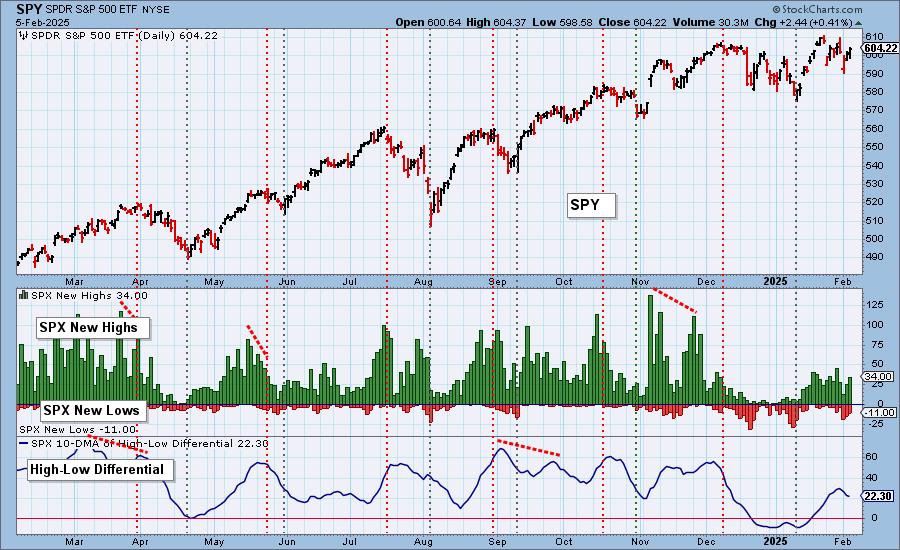
S&P 500 New 52-Week Highs/Lows: New Highs were quite visible on the rally and New Lows did contract. Unfortunately, the High-Low Differential is still in decline.
Climax* Analysis: There were no climax readings today.
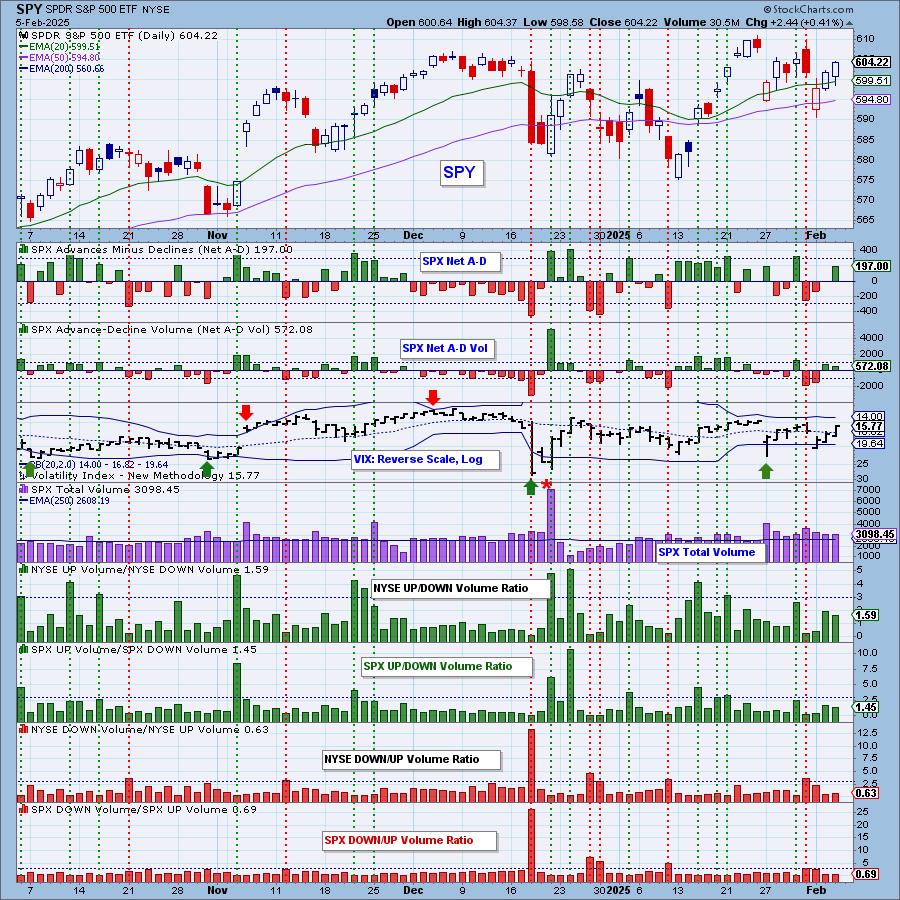
*A climax is a one-day event when market action generates very high readings in, primarily, breadth and volume indicators. We also include the VIX, watching for it to penetrate outside the Bollinger Band envelope. The vertical dotted lines mark climax days -- red for downside climaxes, and green for upside. Climaxes are at their core exhaustion events; however, at price pivots they may be initiating a change of trend.
Short-Term Market Indicators: The short-term market trend is DOWN and the condition is NEUTRAL.
Swenlin Trading Oscillators (STOs) are both rising so this declining trend could be broken. Participation inched slightly higher and we saw some more rising PMOs within the index.
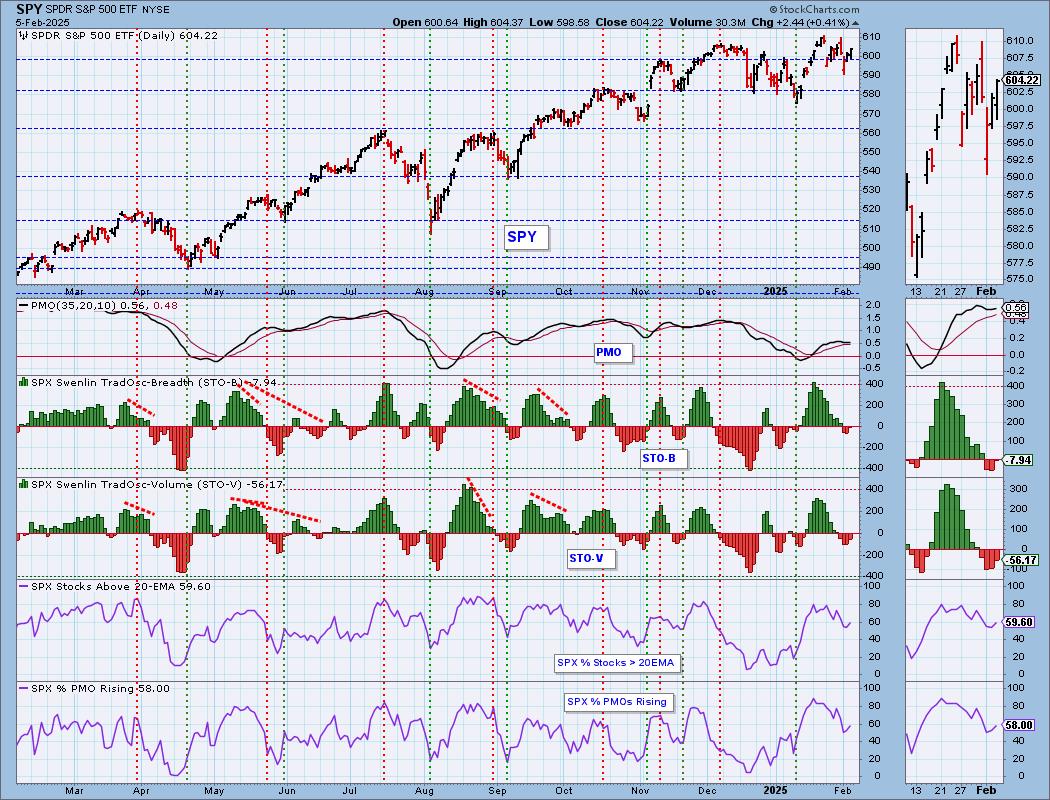
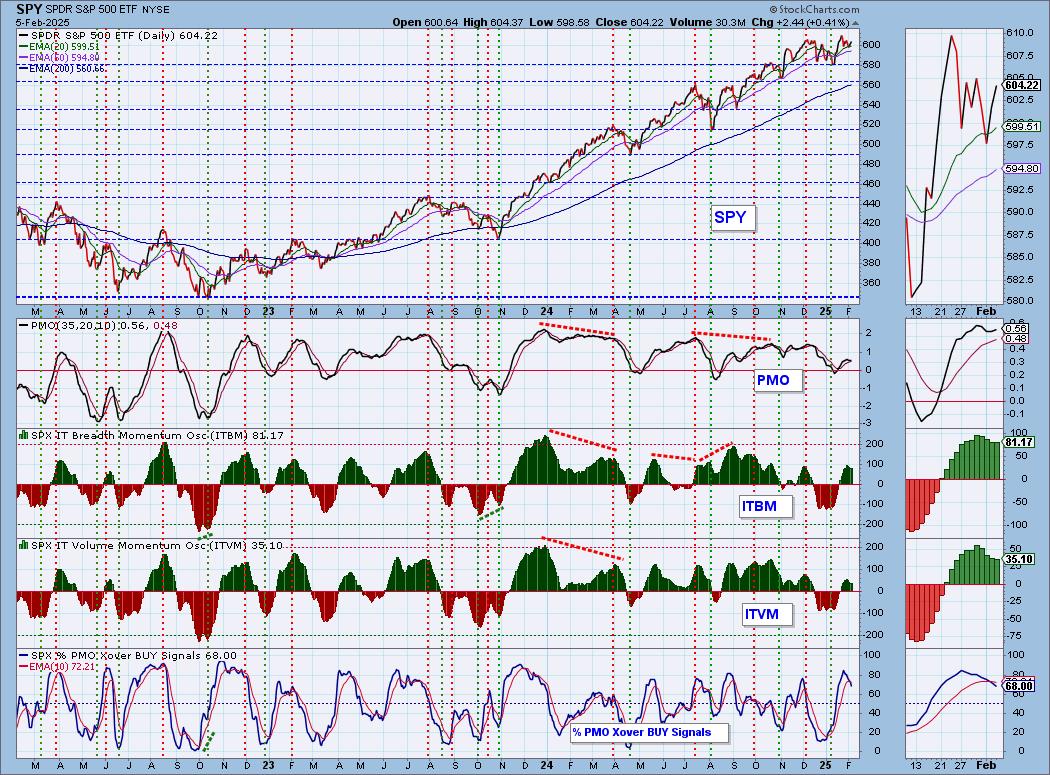
Intermediate-Term Market Indicators: The intermediate-term market trend is UP and the condition is NEUTRAL.
The ITBM and ITVM were mixed today as the ITBM turned up very slightly and the ITVM continues to decline. We continue to see PMO BUY Signals bleed off given only 58% have rising PMOs. That indicator is likely to continue lower from here.
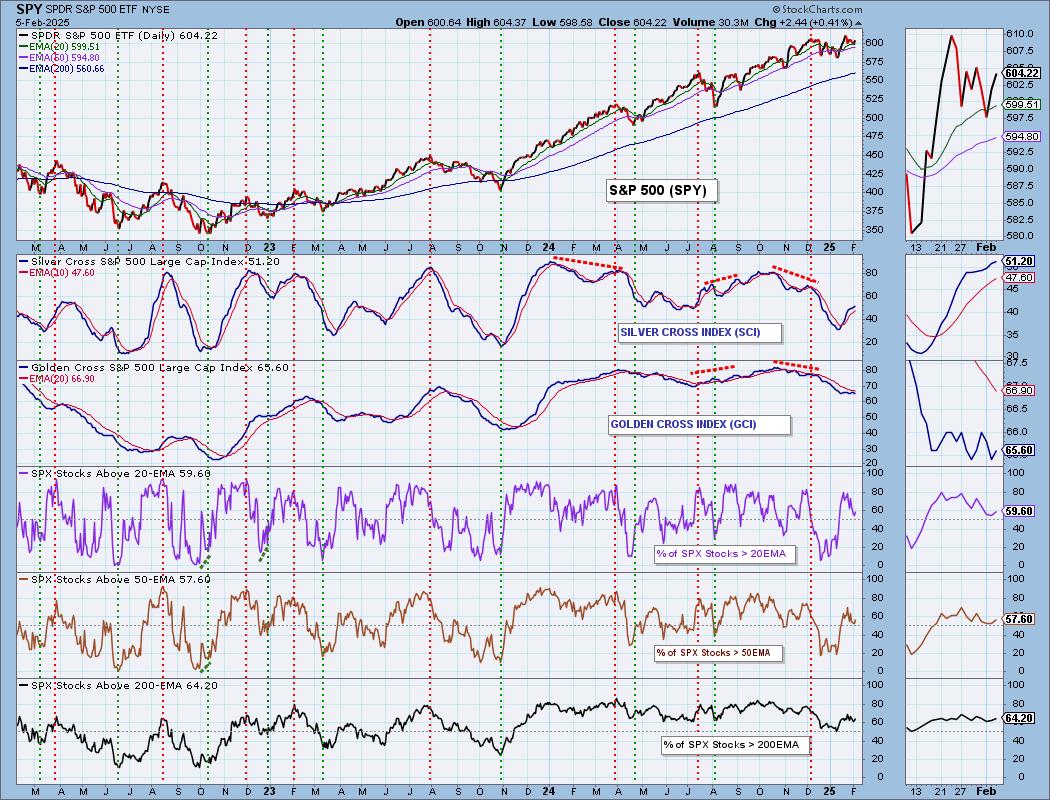
PARTICIPATION CHART (S&P 500): The following chart objectively shows the depth and trend of participation for the SPX in two time frames.
- Intermediate-Term - the Silver Cross Index (SCI) shows the percentage of SPX stocks on IT Trend Model BUY signals (20-EMA > 50-EMA). The opposite of the Silver Cross is a "Dark Cross" -- those stocks are, at the very least, in a correction.
- Long-Term - the Golden Cross Index (GCI) shows the percentage of SPX stocks on LT Trend Model BUY signals (50-EMA > 200-EMA). The opposite of a Golden Cross is the "Death Cross" -- those stocks are in a bear market.
The market bias is BULLISH in the intermediate term.
The market bias is BEARISH in the long term.
Today's rally did see mild expansion on all of the participation indicators. The Silver Cross Index is still rising and could continue higher given we still have more stocks above their 20/50-day EMAs versus Silver Crosses. However, upside is becoming limited as participation indicators are in declining trends. The Silver Cross Index is above its signal line so the IT Bias is BULLISH. The Golden Cross Index has essentially stagnated. We now have fewer stocks above their 50/200-day EMAs versus Golden Crosses so the Golden Cross Index should turn lower again soon. It is below its signal line so the LT Bias is BEARISH even though it holds a higher reading than the Silver Cross Index.
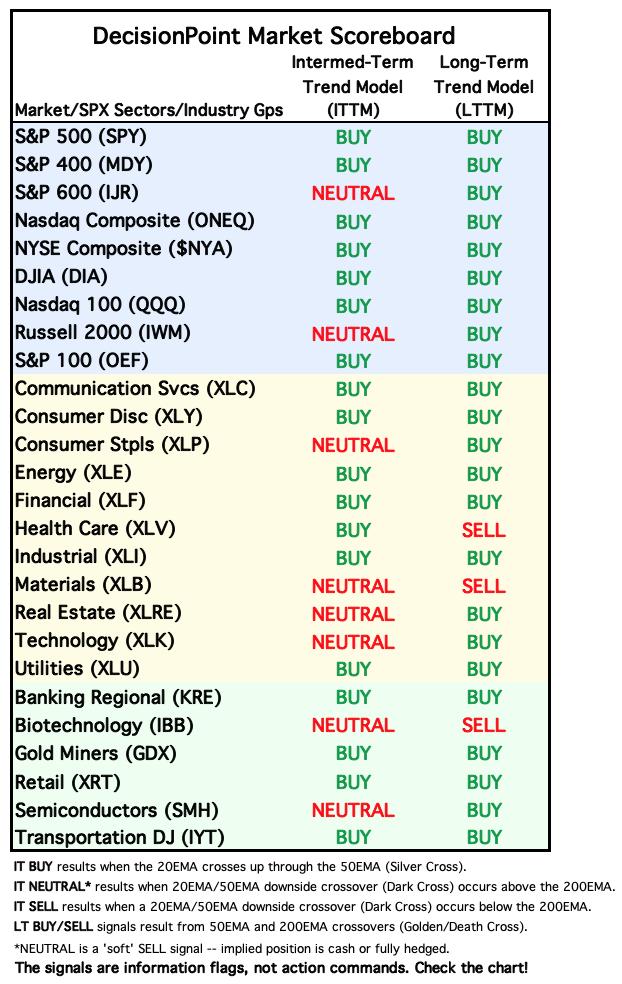
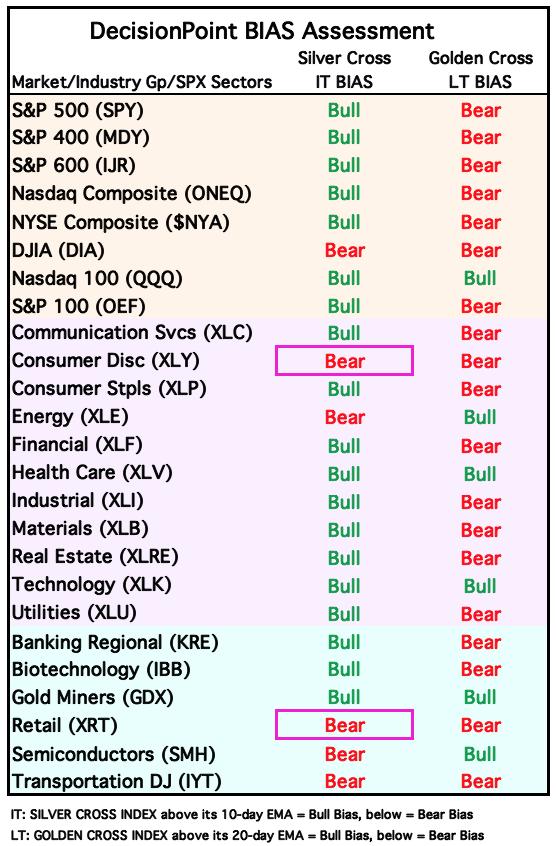
BIAS Assessment: The following table expresses the current BIAS of various price indexes based upon the relationship of the Silver Cross Index to its 10-day EMA (intermediate-term), and of the Golden Cross Index to its 20-day EMA (long-term). When the Index is above the EMA it is bullish, and it is bearish when the Index is below the EMA. The BIAS does not imply that any particular action should be taken. It is information to be used in the decision process.
The items with highlighted borders indicate that the BIAS changed today.
*****************************************************************************************************
CONCLUSION: The market managed to push higher despite a bad day from Alphabet (GOOGL) which was down -7.29%. It is now in another declining trend channel and it is near the top of the channel suggesting we will see a decline. STOs are now rising again so a breakout is certainly possible here. We are unimpressed by PMO analysis given we have declining trends on Rising PMOs and %PMO Xover BUY Signals. The internals appear somewhat weak with participation also in declining trends. We are expecting more downside on weakening internals, but STOs could be telling us there is a bit more rally to be had.
Erin is 50% long, 0% short. (This is intended as information, not a recommendation.)
*****************************************************************************************************
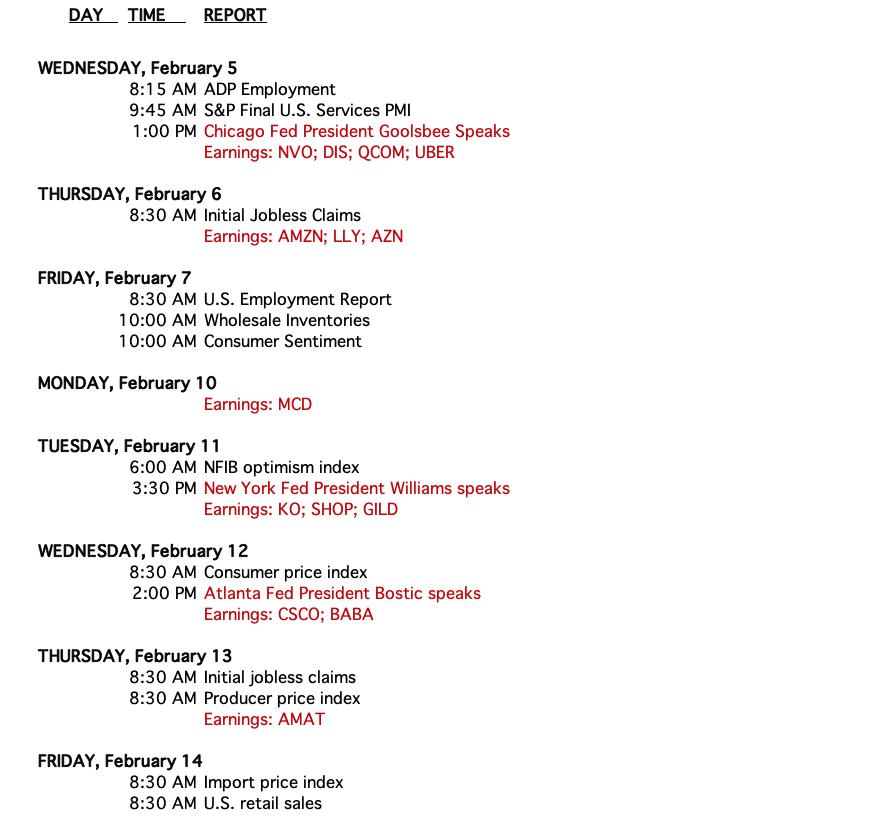
CALENDAR
Have you subscribed the DecisionPoint Diamonds yet? DP does the work for you by providing handpicked stocks/ETFs from exclusive DP scans! Add it with a discount! Contact support@decisionpoint.com for more information!
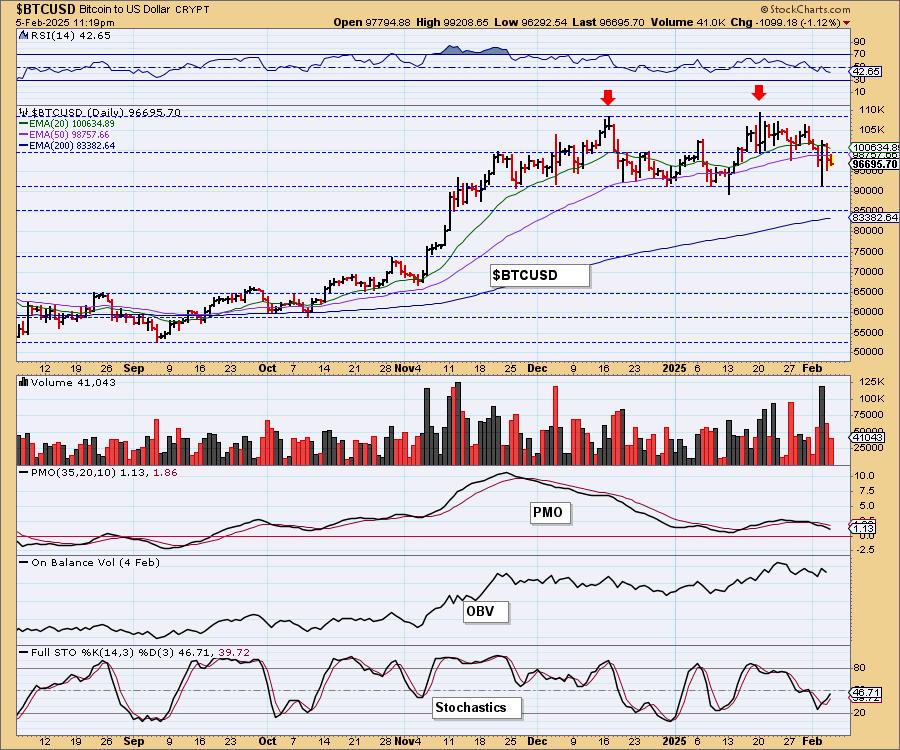
BITCOIN
Bitcoin is headed to test support at 90,000 again. The PMO tells us that support level is very vulnerable to attack. The RSI is negative. Stochastics are rising again so maybe support will hold one more time.
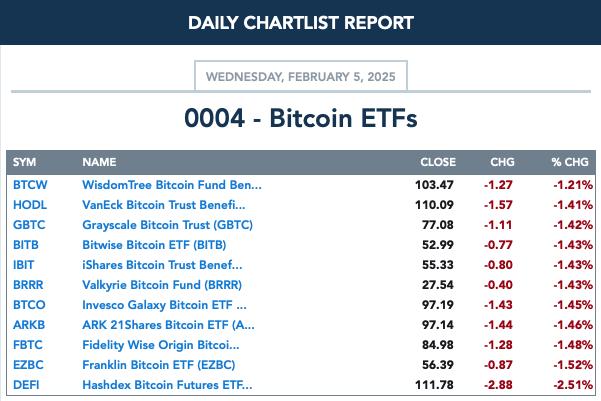
BITCOIN ETFs
INTEREST RATES
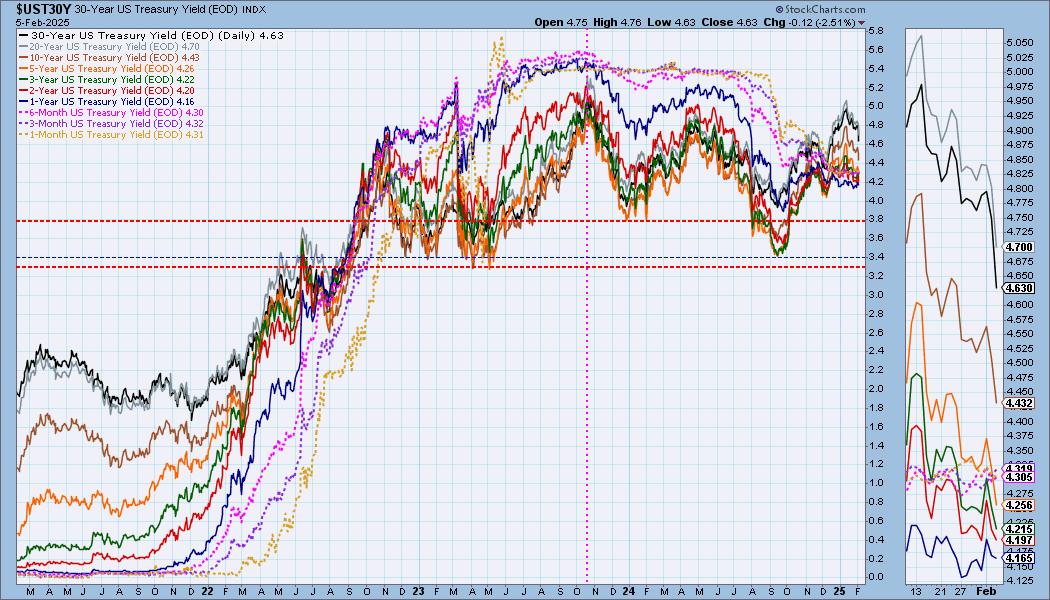
Yields fell today extending declining trends. We expect them to fall further from here.
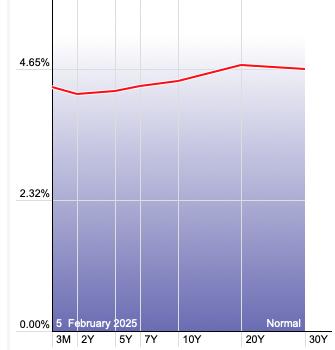
The Yield Curve Chart from StockCharts.com shows us the inversions taking place. The red line should move higher from left to right. Inversions are occurring where it moves downward.
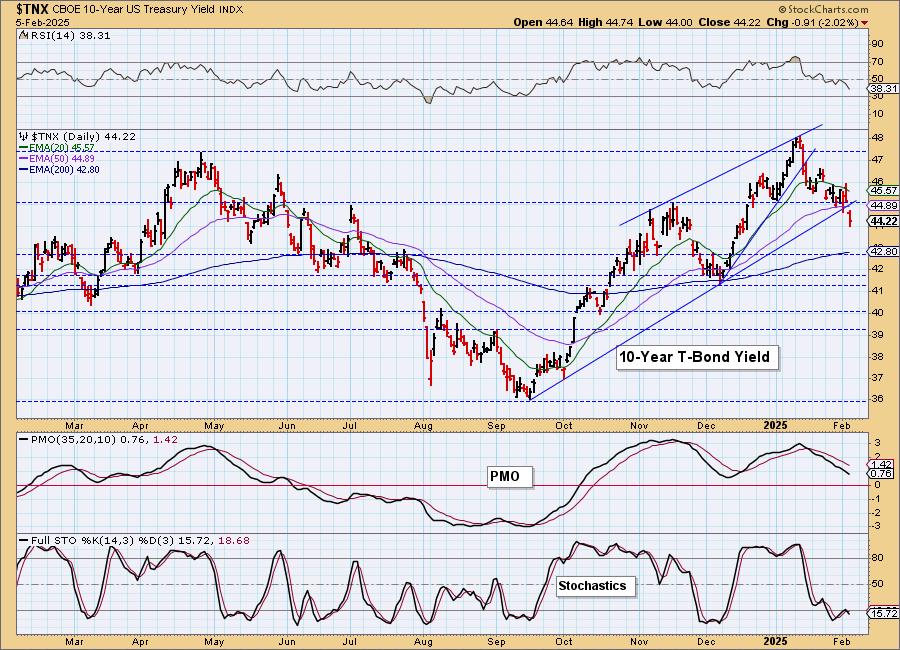
10-YEAR T-BOND YIELD
$TNX finally broke its rising bottoms trendline, setting it up for more decline. We had been waiting for this given the bearish head and shoulders top. Now we look toward the 200-day EMA for support. The PMO is declining and the RSI is negative.
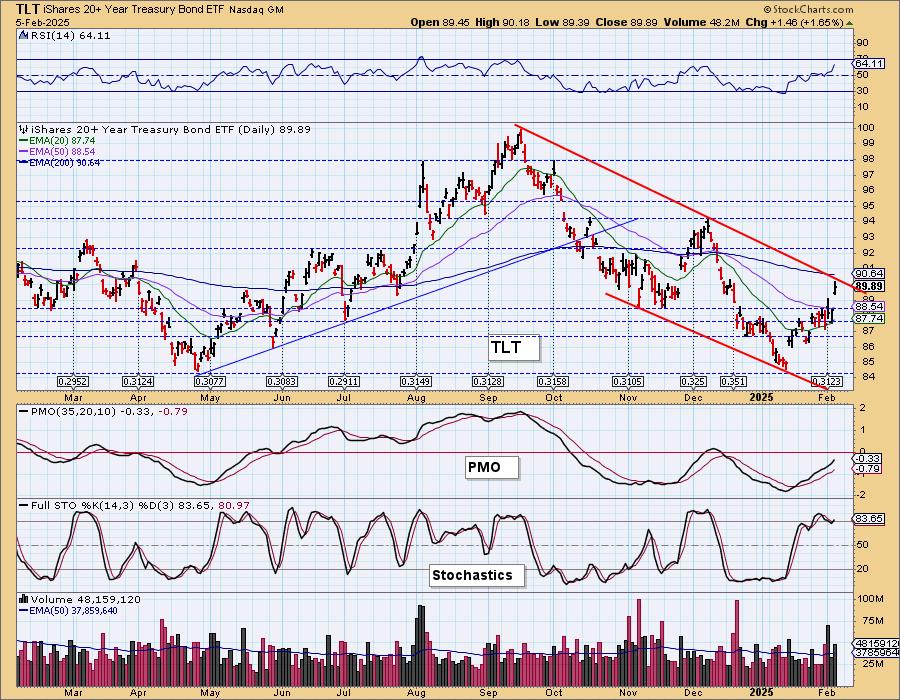
BONDS (TLT)
IT Trend Model: NEUTRAL as of 11/10/2024
LT Trend Model: SELL as of 12/13/2024
TLT Daily Chart: TLT rallied strongly today as yields dove lower. We see more upside ahead for Bonds, but know that the minimum upside target of the reverse head and shoulders will take price just below 92.00 so upside may be limited. Of course it is a "minimum" upside target so it isn't out of the question that it could rally past that. Indicators look very good while the 20-year yield looks very bearish.
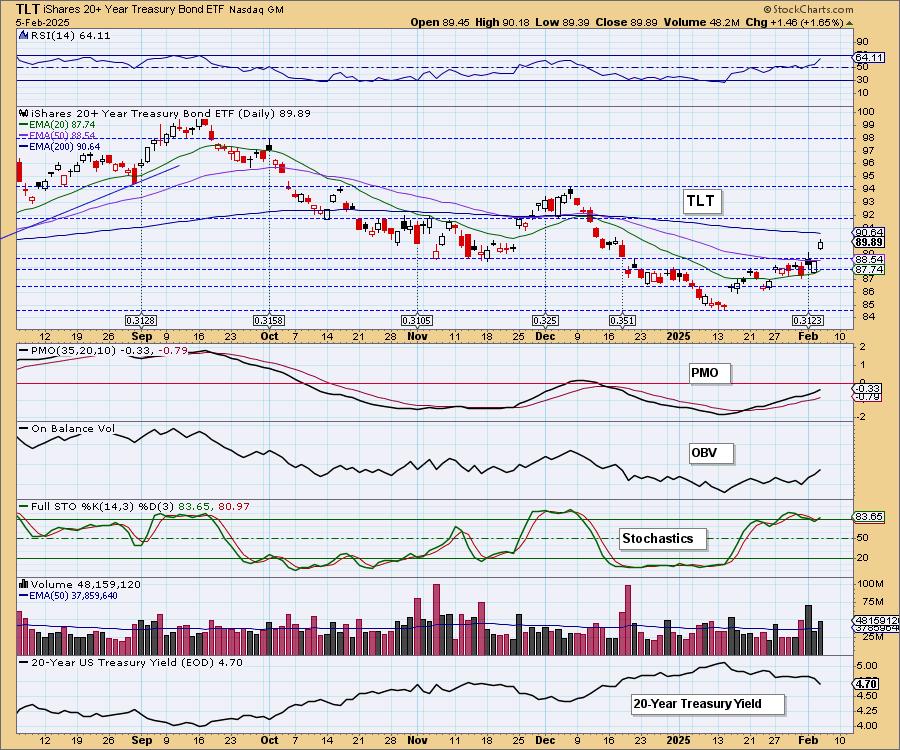
Price is still in a long-term declining trend channel and price is now up against the top. We could see a stutter step at the 200-day EMA.
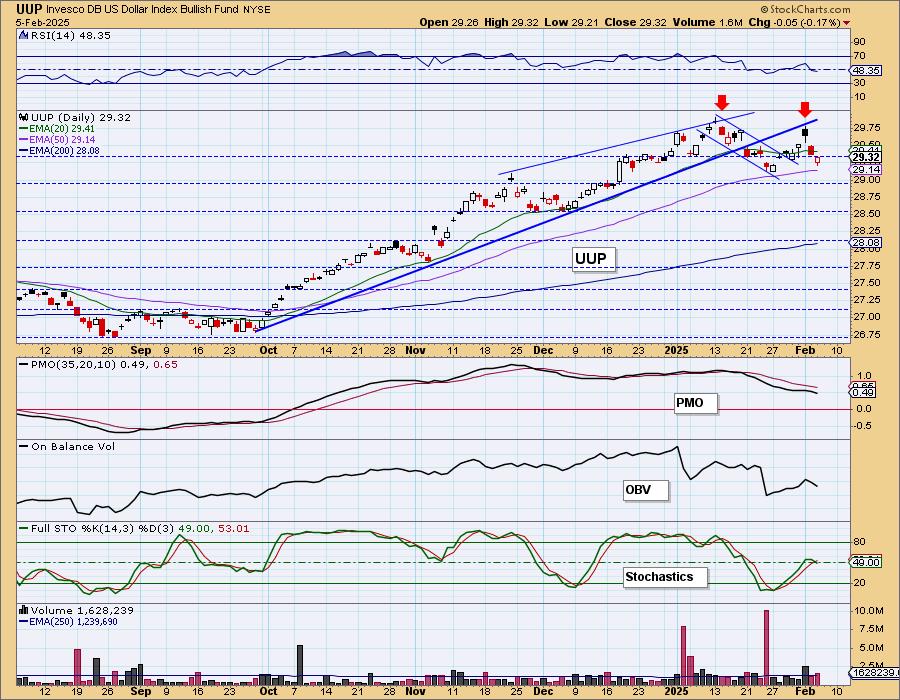
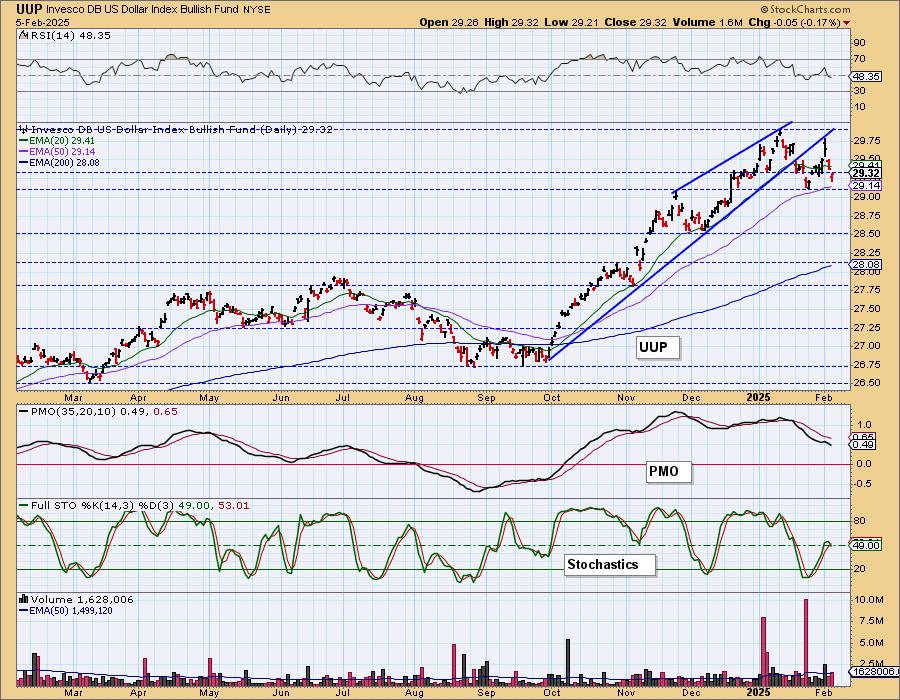
DOLLAR (UUP)
IT Trend Model: BUY as of 10/9/2024
LT Trend Model: BUY as of 5/25/2023
UUP Daily Chart: It appears we're not going to get any more upside out of the bull flag. We now have a loose double top formation that suggests we'll see downside, not rally. The PMO topped beneath its signal line and the RSI has moved into negative territory. Stochastics have reversed into negative territory below net neutral (50).
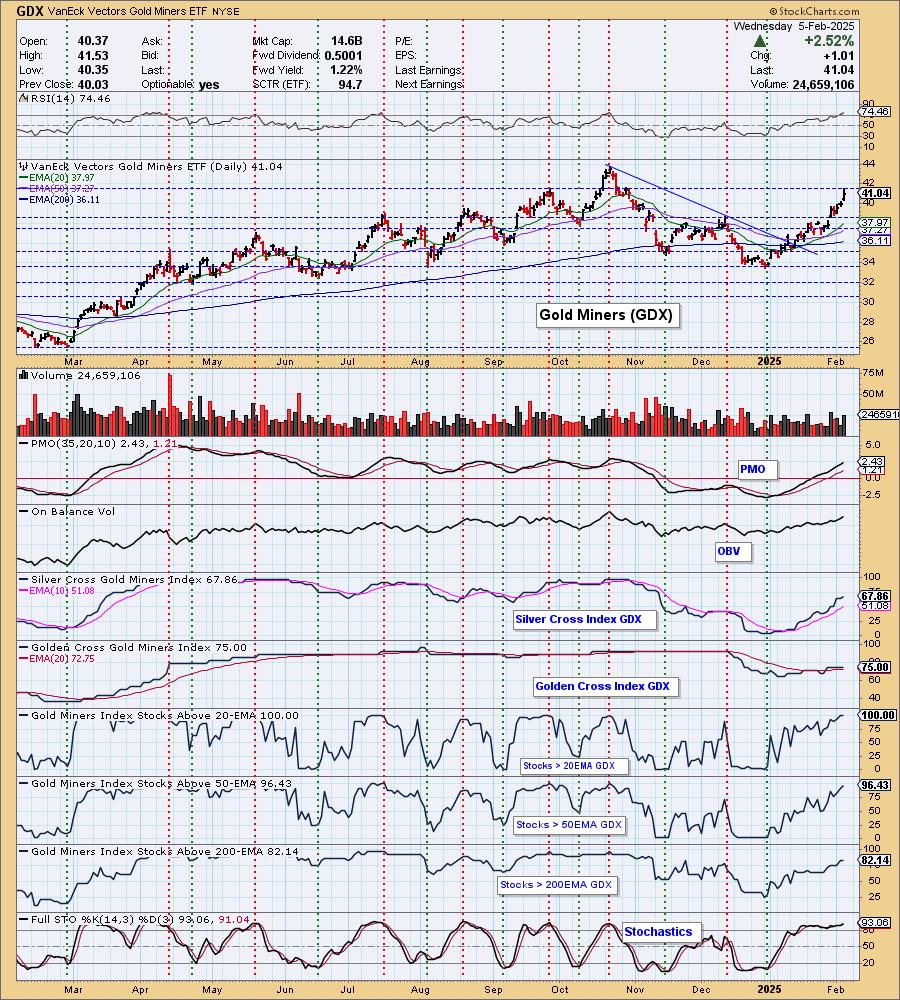
GOLD
IT Trend Model: BUY as of 1/10/2025
LT Trend Model: BUY as of 10/20/2023
GLD Daily Chart: Gold set another all-time high and looks poised to continue higher. The RSI is overbought now so it is overdue for a pause, but with the Dollar looking weak, Gold could see even higher prices. Even if the Dollar starts to recover, we can see that Gold's relative strength line to the Dollar is rising. We would look for more all-time highs with a possible pause arriving soon.
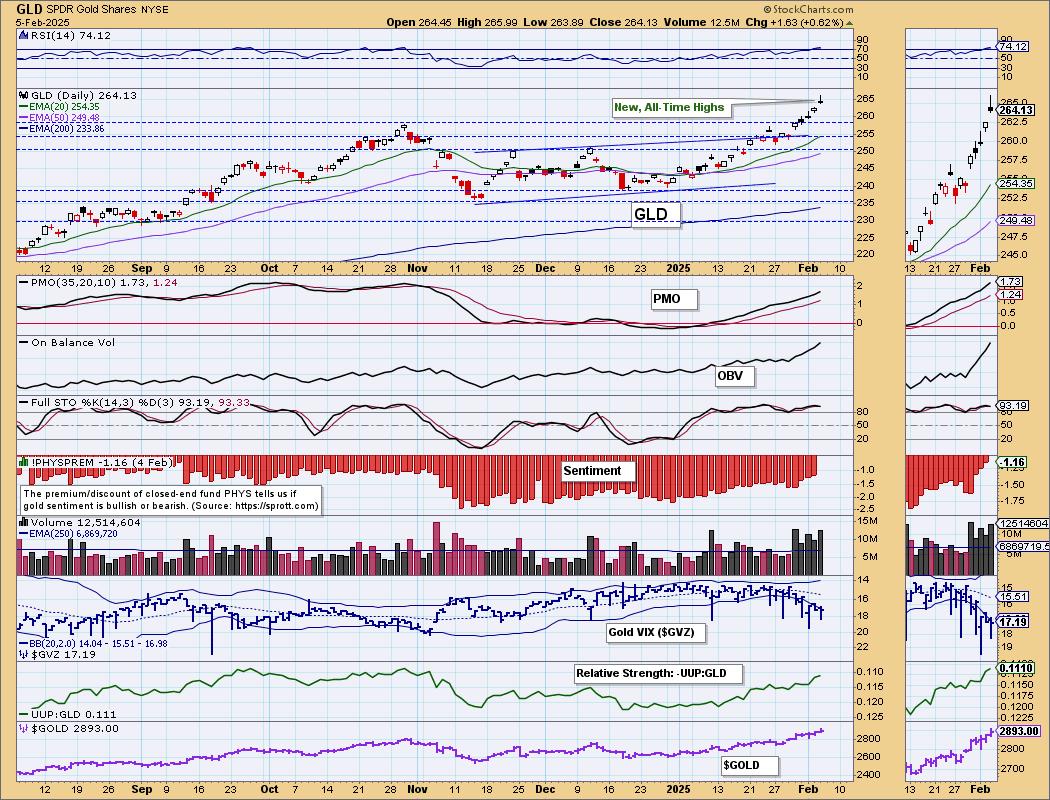
Discounts have been slowly paring back which tells us that investors are getting more bullish on Gold. The stage is set for even higher prices on Gold.

GOLD MINERS (GDX) Daily Chart: Gold looks very bullish and that is good news for Gold Miners which tend to move quickly higher on Gold rallies. Participation is extremely strong with very good readings on the Silver Cross Index and Golden Cross Index. We see more upside ahead for both Gold and Gold Miners.
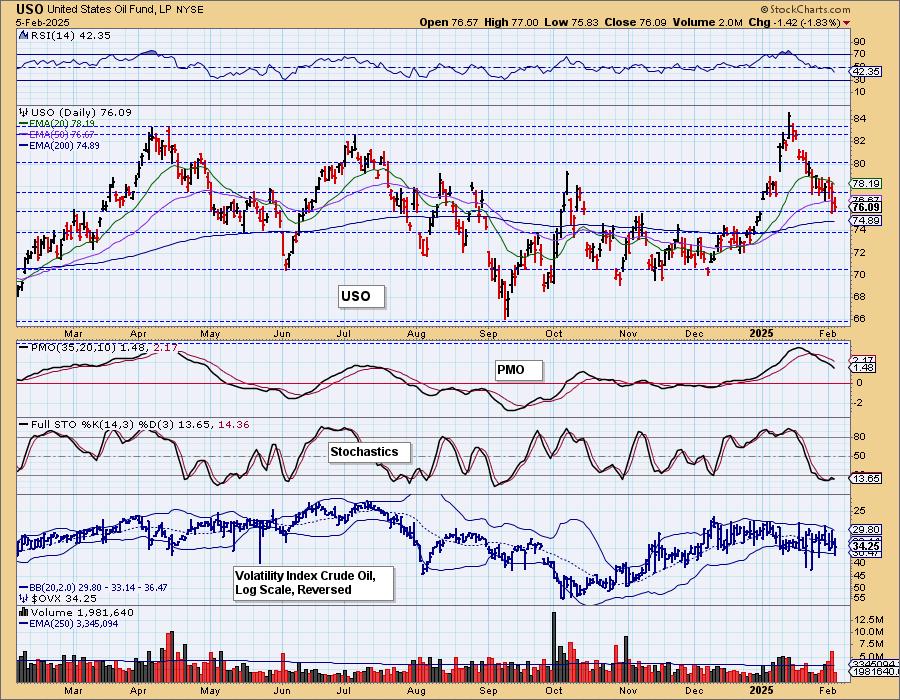
CRUDE OIL (USO)
IT Trend Model: BUY as of 12/24/2024
LT Trend Model: BUY as of 1/10/2025
USO Daily Chart: Crude is holding support at the November top and the 200-day EMA, but indicators are very negative so we don't expect this level of support to hold. Stochastics topped below 20 which is especially bearish. We could see some consolidation or possibly a small bounce off this level, but any upside isn't likely to catch hold given overall fundamentals of higher production levels on tap by this administration. There will continue to be strong downside pressure applied.
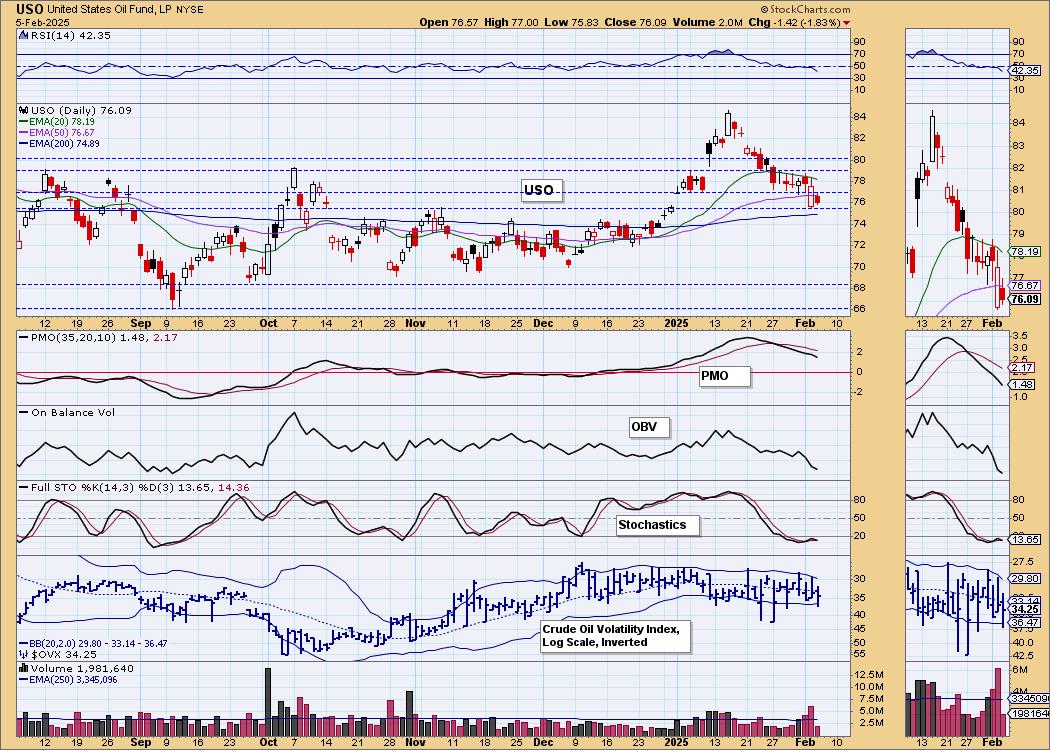
Price hit the top of a very long-term trading range so it isn't surprising to see the correction. It's time for price to test the bottom of the range and that is where we believe it is ultimately headed.
Good Luck & Good Trading!
Erin Swenlin and Carl Swenlin
Technical Analysis is a windsock, not a crystal ball. --Carl Swenlin
(c) Copyright 2025 DecisionPoint.com
Disclaimer: This blog is for educational purposes only and should not be construed as financial advice. The ideas and strategies should never be used without first assessing your own personal and financial situation, or without consulting a financial professional. Any opinions expressed herein are solely those of the author, and do not in any way represent the views or opinions of any other person or entity.
DecisionPoint is not a registered investment advisor. Investment and trading decisions are solely your responsibility. DecisionPoint newsletters, blogs or website materials should NOT be interpreted as a recommendation or solicitation to buy or sell any security or to take any specific action.
NOTE: The signal status reported herein is based upon mechanical trading model signals, specifically, the DecisionPoint Trend Model. They define the implied bias of the price index based upon moving average relationships, but they do not necessarily call for a specific action. They are information flags that should prompt chart review. Further, they do not call for continuous buying or selling during the life of the signal. For example, a BUY signal will probably (but not necessarily) return the best results if action is taken soon after the signal is generated. Additional opportunities for buying may be found as price zigzags higher, but the trader must look for optimum entry points. Conversely, exit points to preserve gains (or minimize losses) may be evident before the model mechanically closes the signal.
Helpful DecisionPoint Links:
DecisionPoint Alert Chart List
DecisionPoint Golden Cross/Silver Cross Index Chart List
DecisionPoint Sector Chart List
Price Momentum Oscillator (PMO)