
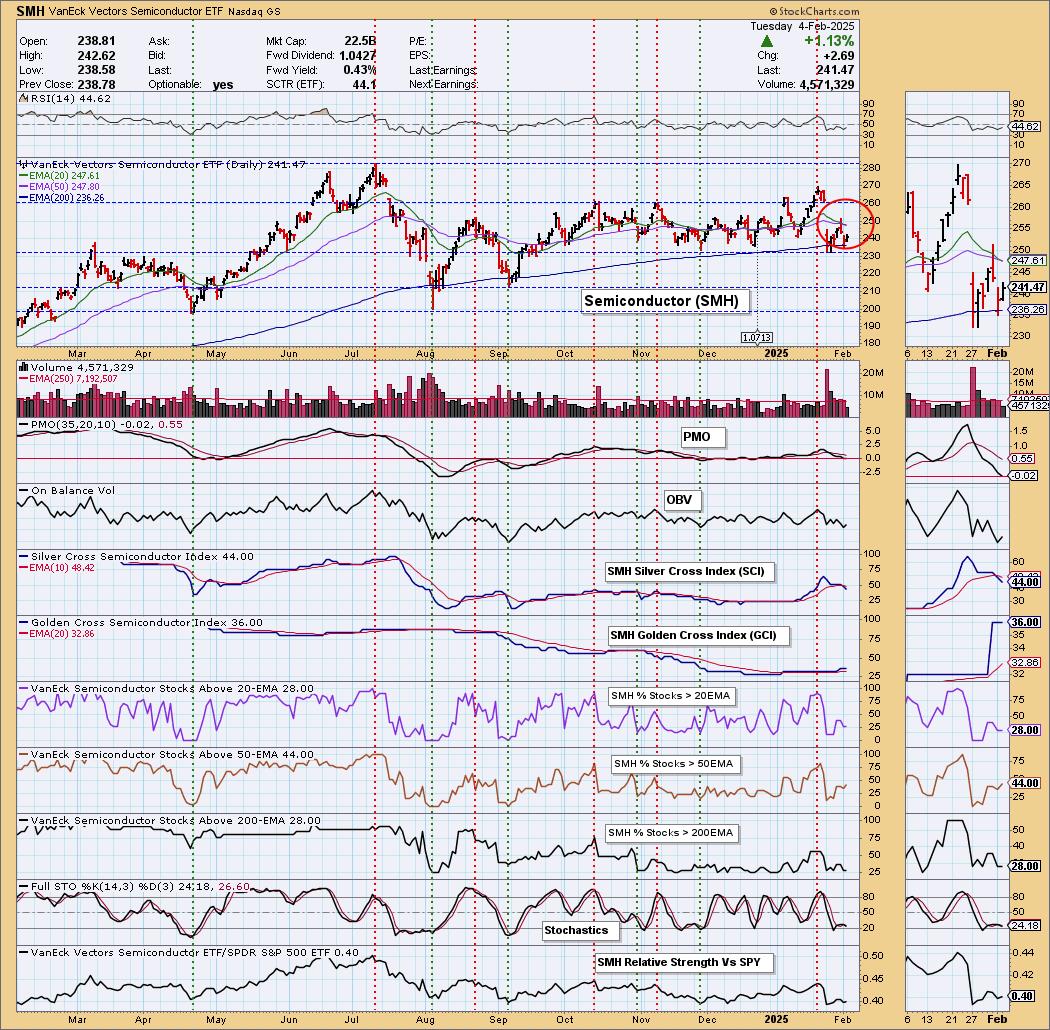
Today the Semiconductor ETF (SMH) 20-day EMA crossed down through the 50-day EMA (Dark Cross), above the 200-day EMA, generating an IT Trend Model NEUTRAL Signal. Price continues to move sideways, but given this signal, we could be looking at a possible breakdown in the future. Participation is slim at best and Stochastics are dropping in very negative territory. The Silver Cross Index had a Bearish Shift across its signal line giving us a BEARISH IT Bias.
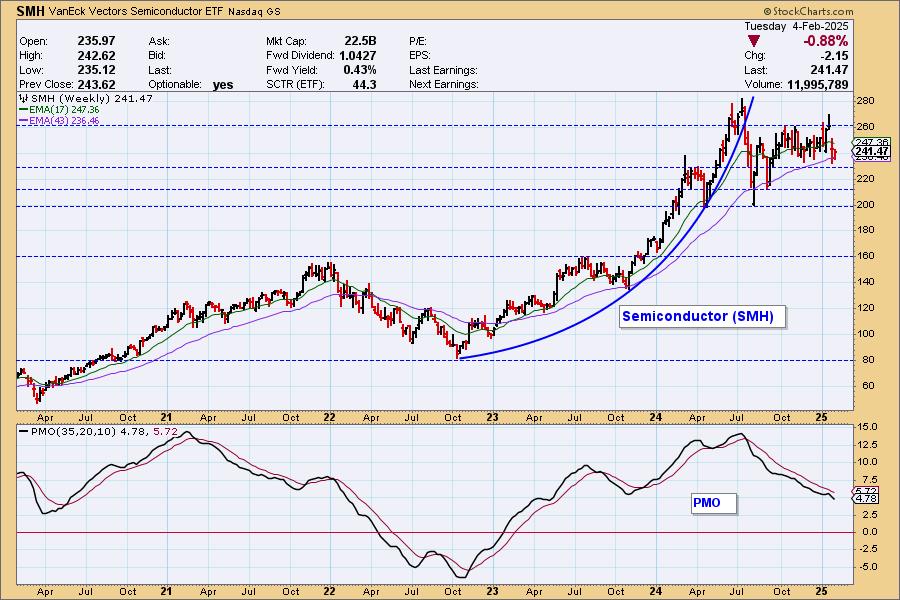
On the weekly chart we see that SMH is in a high-level consolidation after having broken down from a parabolic advance. As usual, sideways price action causes the PMO to move back to the zero line.
The DecisionPoint Alert Weekly Wrap presents an end-of-week assessment of the trend and condition of the Stock Market, the U.S. Dollar, Gold, Crude Oil, and Bonds. The DecisionPoint Alert daily report (Monday through Thursday) is abbreviated and gives updates on the Weekly Wrap assessments.
Watch the latest episode of DecisionPoint on our YouTube channel here!
MARKET/INDUSTRY GROUP/SECTOR INDEXES
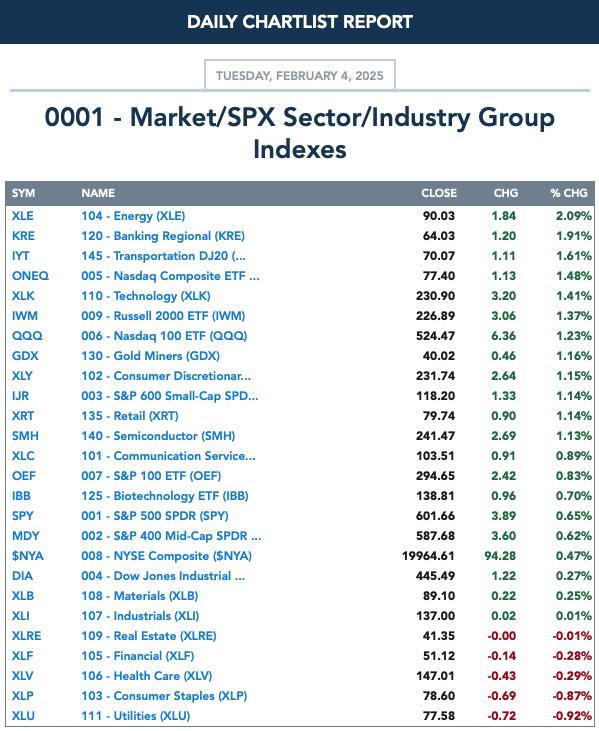
CLICK HERE for Carl's annotated Market Index, Sector, and Industry Group charts.
THE MARKET (S&P 500)
IT Trend Model: BUY as of 8/14/2024
LT Trend Model: BUY as of 3/29/2023
SPY 10-Minute Chart: Canada has also successfully managed to avoid tariffs for one month like Mexico and that seemed to settle investor nerves as price inch higher all day.
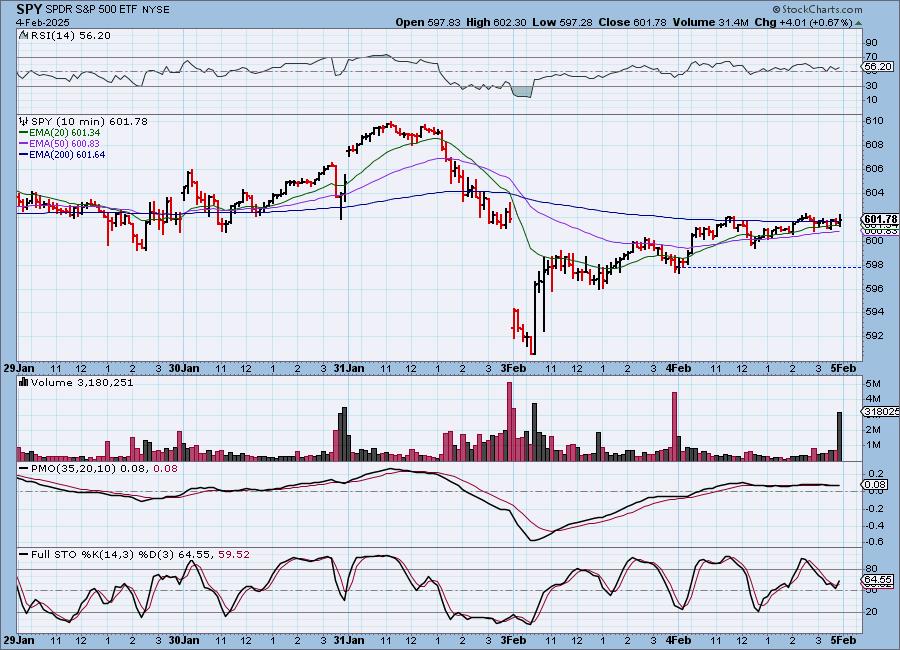
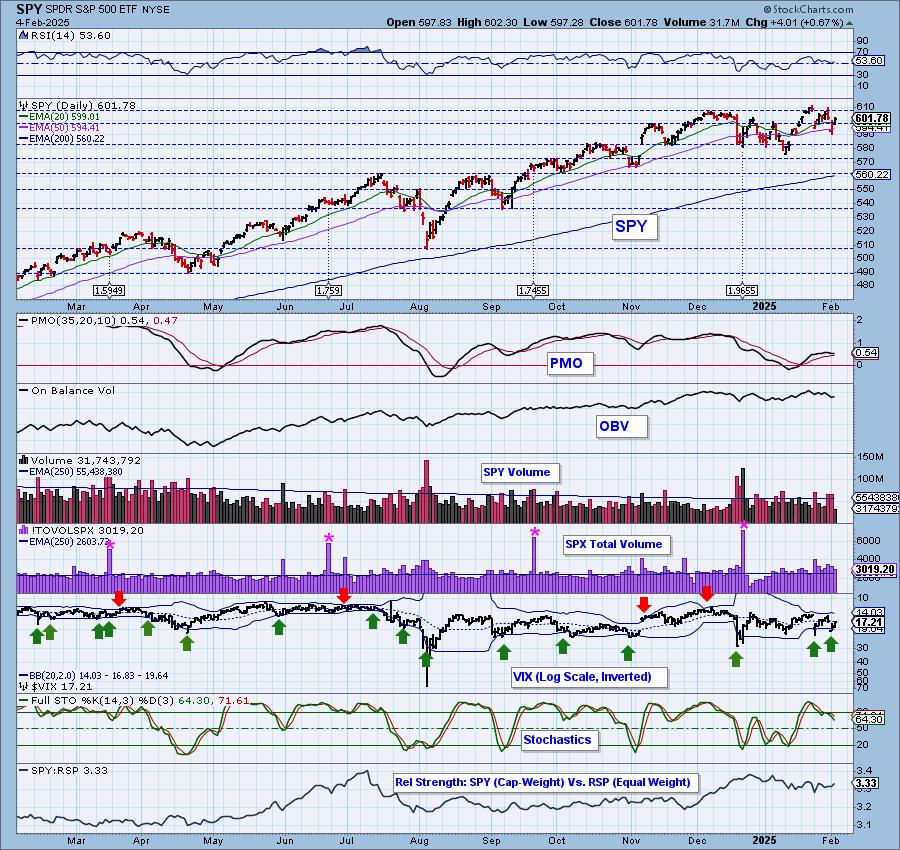
SPY Daily Chart: Price is currently in a short-term declining trend. The PMO did not bottom, it held the same reading as yesterday.

The VIX downside puncture on our inverted scale did indeed lead to a bounce today. Bands are very tight so we could see a puncture in either direction soon. It should temper our expectations on punctures. Stochastics are falling so internal weakness is visible.

Here is the latest recording from 2/3. Click HERE to get to our video list.:
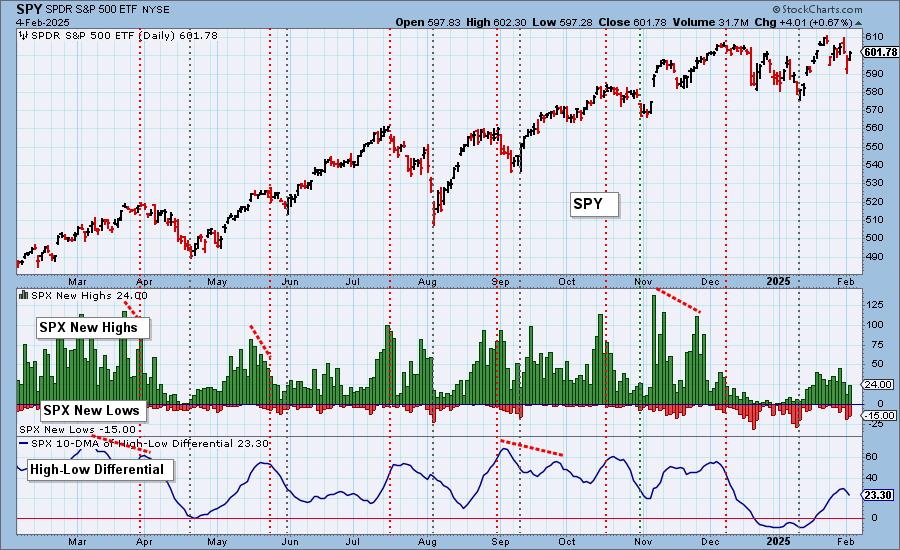
S&P 500 New 52-Week Highs/Lows: New Highs expanded on the rally, but are still showing a declining trend. New Lows contracted, but were still very visible. The High-Low Differential is falling so we could see more downside from here.
Climax* Analysis: There were no climax readings today. We note that SPX Net A-D was negative, while price was up.
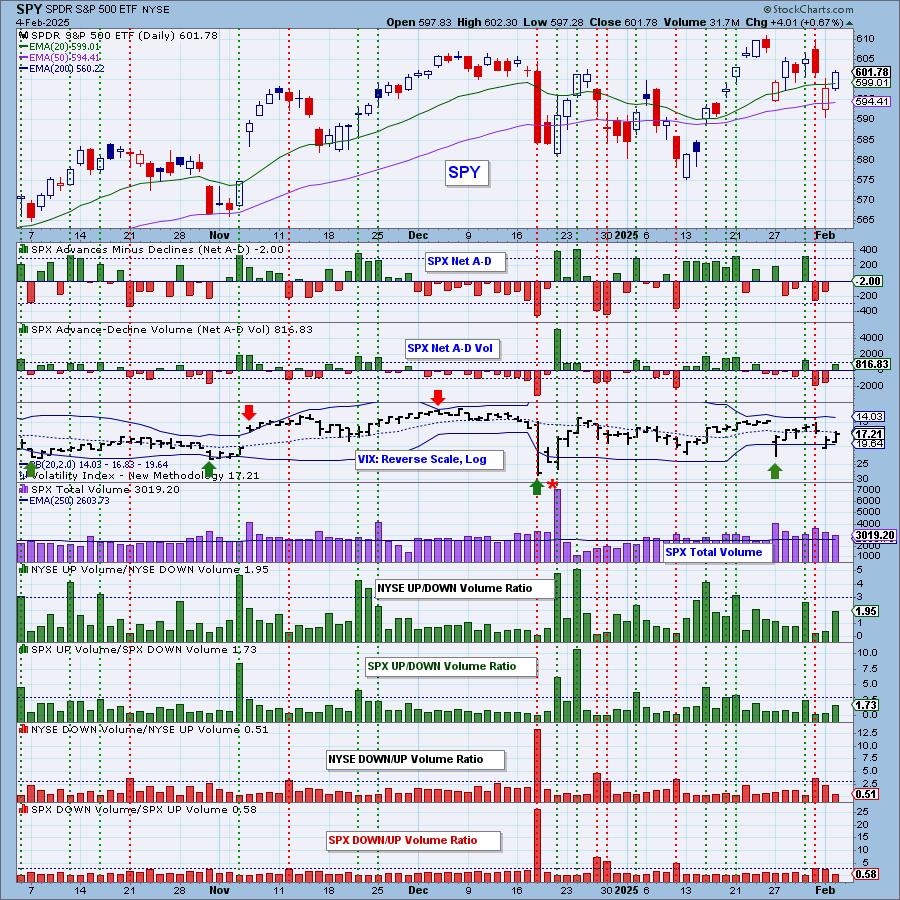
*A climax is a one-day event when market action generates very high readings in, primarily, breadth and volume indicators. We also include the VIX, watching for it to penetrate outside the Bollinger Band envelope. The vertical dotted lines mark climax days -- red for downside climaxes, and green for upside. Climaxes are at their core exhaustion events; however, at price pivots they may be initiating a change of trend.
Short-Term Market Indicators: The short-term market trend is DOWN and the condition is NEUTRAL.
Swenlin Trading Oscillators (STOs) were mixed today. The STO-V actually turned up today. It is still in negative territory, but that is a welcome sign for bulls. Considering we had a very nice rally today, we didn't see any expansion in stocks above their 20-day EMAs and we only saw a tiny increase in rising PMOs.
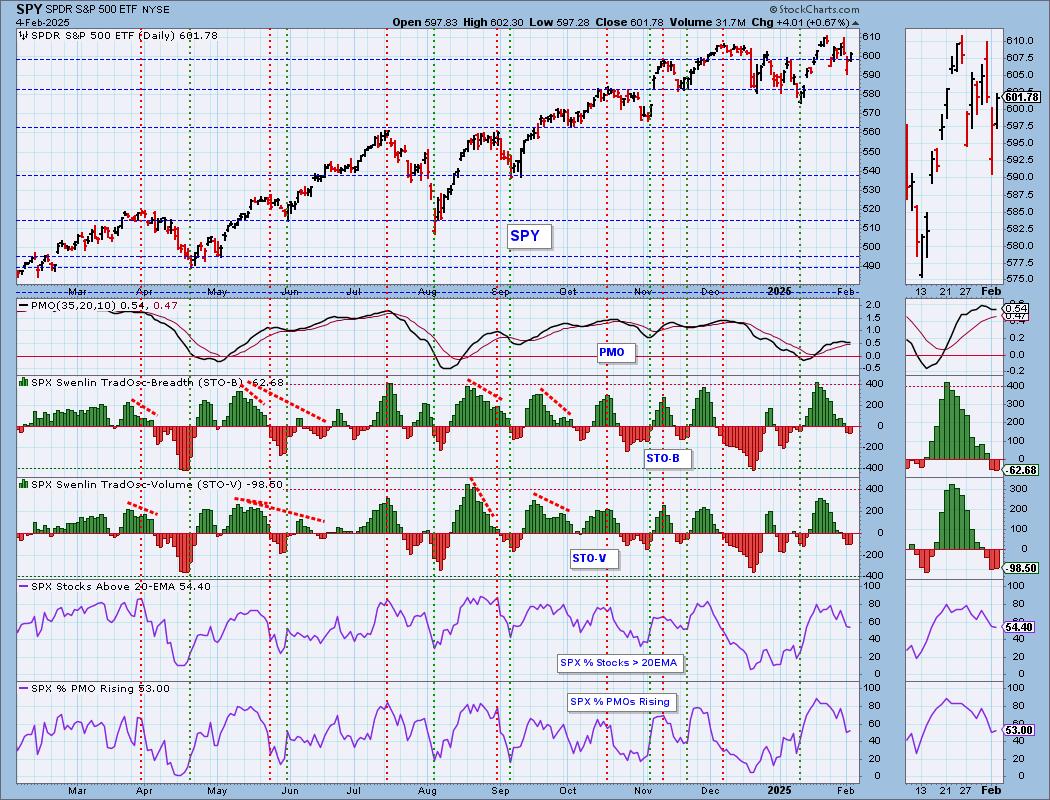
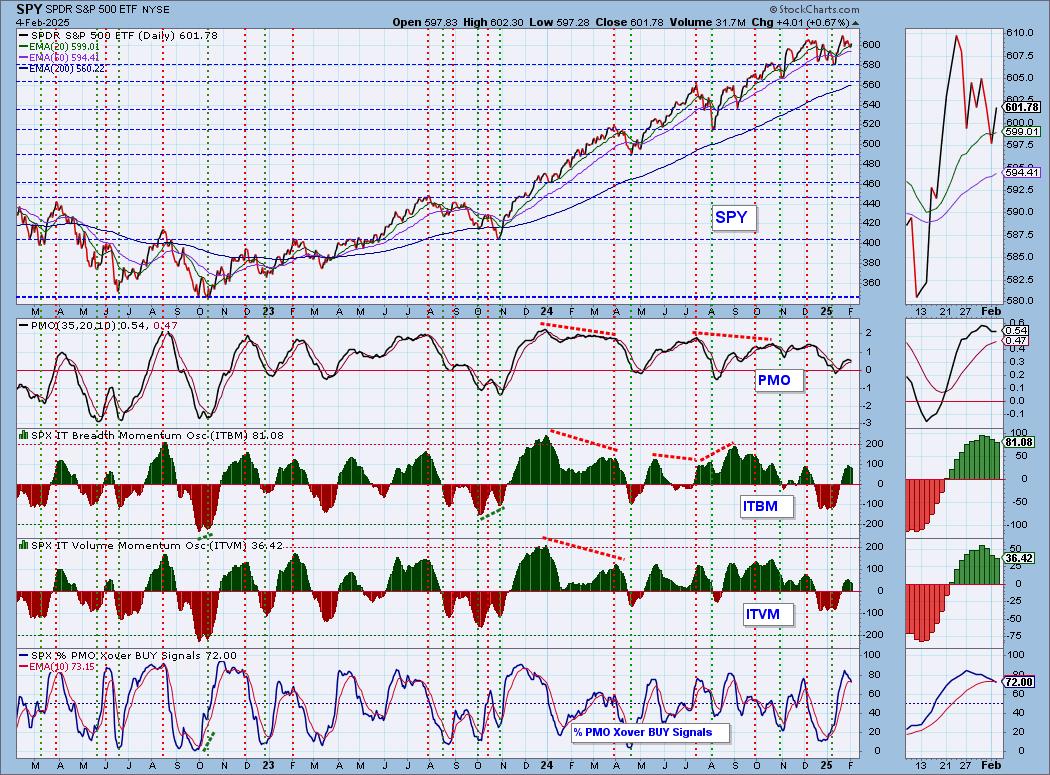
Intermediate-Term Market Indicators: The intermediate-term market trend is UP and the condition is NEUTRAL.
The ITBM and ITVM continue drop so there is definitely weakness visible in the intermediate term. We also saw a downside crossover on %PMO Xover BUY Signals.
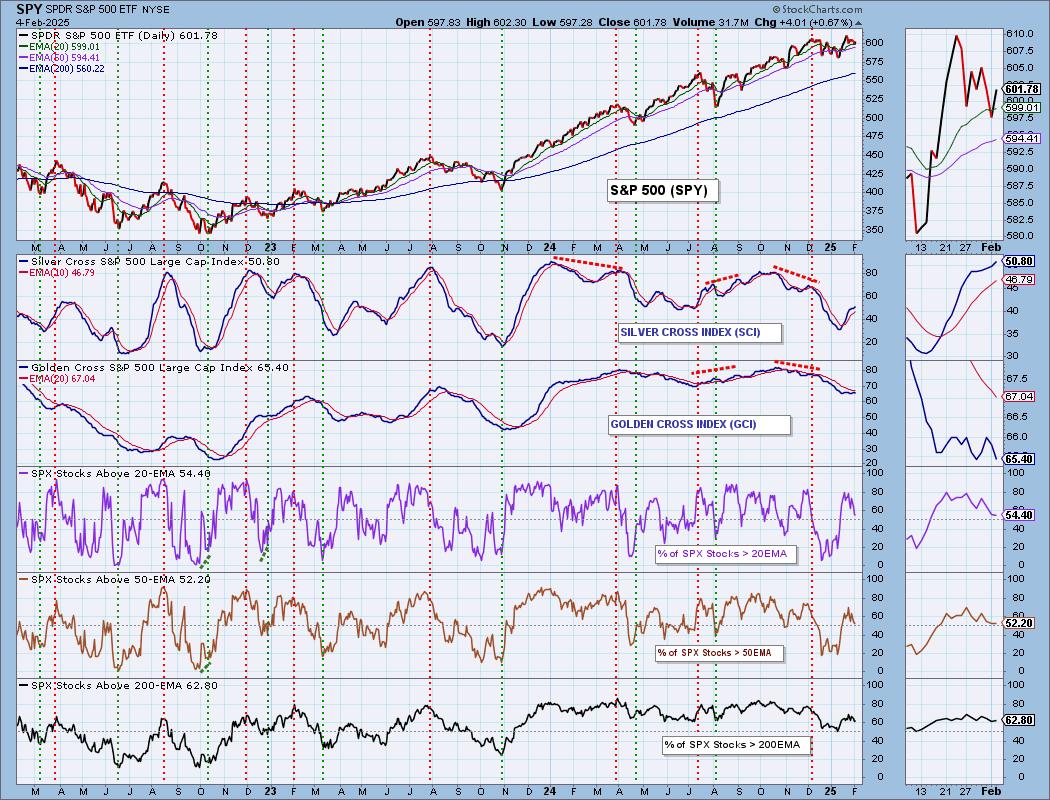
PARTICIPATION CHART (S&P 500): The following chart objectively shows the depth and trend of participation for the SPX in two time frames.
- Intermediate-Term - the Silver Cross Index (SCI) shows the percentage of SPX stocks on IT Trend Model BUY signals (20-EMA > 50-EMA). The opposite of the Silver Cross is a "Dark Cross" -- those stocks are, at the very least, in a correction.
- Long-Term - the Golden Cross Index (GCI) shows the percentage of SPX stocks on LT Trend Model BUY signals (50-EMA > 200-EMA). The opposite of a Golden Cross is the "Death Cross" -- those stocks are in a bear market.
The market bias is BULLISH in the intermediate term.
The market bias is BEARISH in the long term.
We didn't see any real expansion on stocks above key moving averages on today's rally. The Silver Cross Index is still rising, but will probably begin to struggle if we don't get more stocks above their 20/50-day EMAs. It is above its signal line so the IT Bias is BULLISH. The Golden Cross Index continues to fall and given there are fewer stocks above their 200-day EMA than Golden Crosses, it should continue to make its way lower. It is below its signal line so the LT Bias is BEARISH.
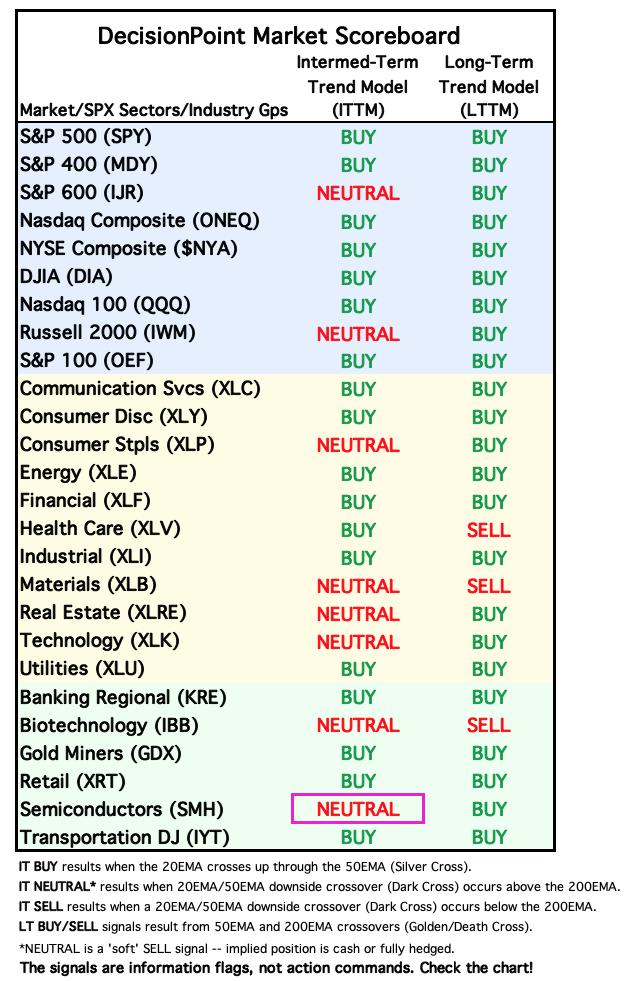
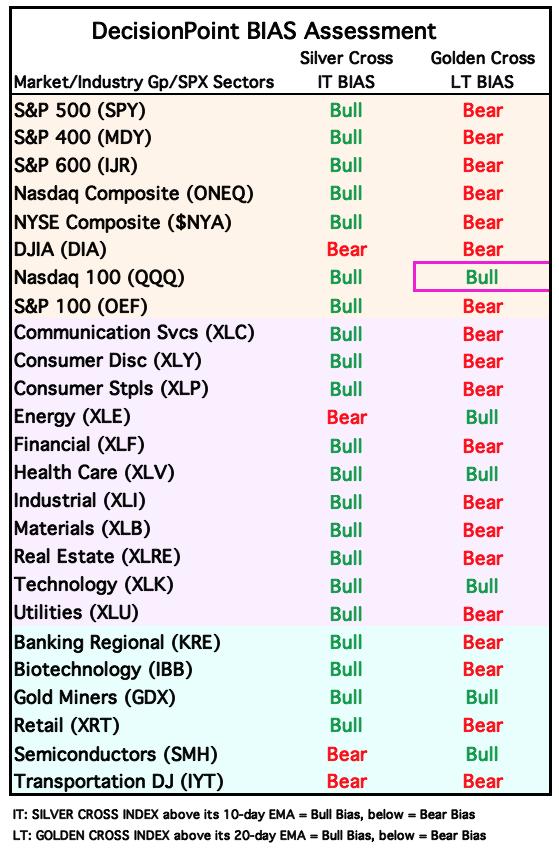
BIAS Assessment: The following table expresses the current BIAS of various price indexes based upon the relationship of the Silver Cross Index to its 10-day EMA (intermediate-term), and of the Golden Cross Index to its 20-day EMA (long-term). When the Index is above the EMA it is bullish, and it is bearish when the Index is below the EMA. The BIAS does not imply that any particular action should be taken. It is information to be used in the decision process.
The items with highlighted borders indicate that the BIAS changed today.
*****************************************************************************************************
CONCLUSION: Given the magnitude of today's rally, we should've seen more than just the STO-V rise. Participation didn't gain and we saw negative Net A-D. Mega-caps may be at it again, pushing the index higher while internals fail. We're losing PMO BUY Signals and the ITBM and ITVM continue to move lower. There are clear problems so we would expect to see the index lose ground as participation slowly bleeds out. GOOGL reported earnings after the bell and as of this writing, is down almost 8% in after hours trading so we could see a decline after all.
Erin is 50% long, 0% short. (This is intended as information, not a recommendation.)
*****************************************************************************************************
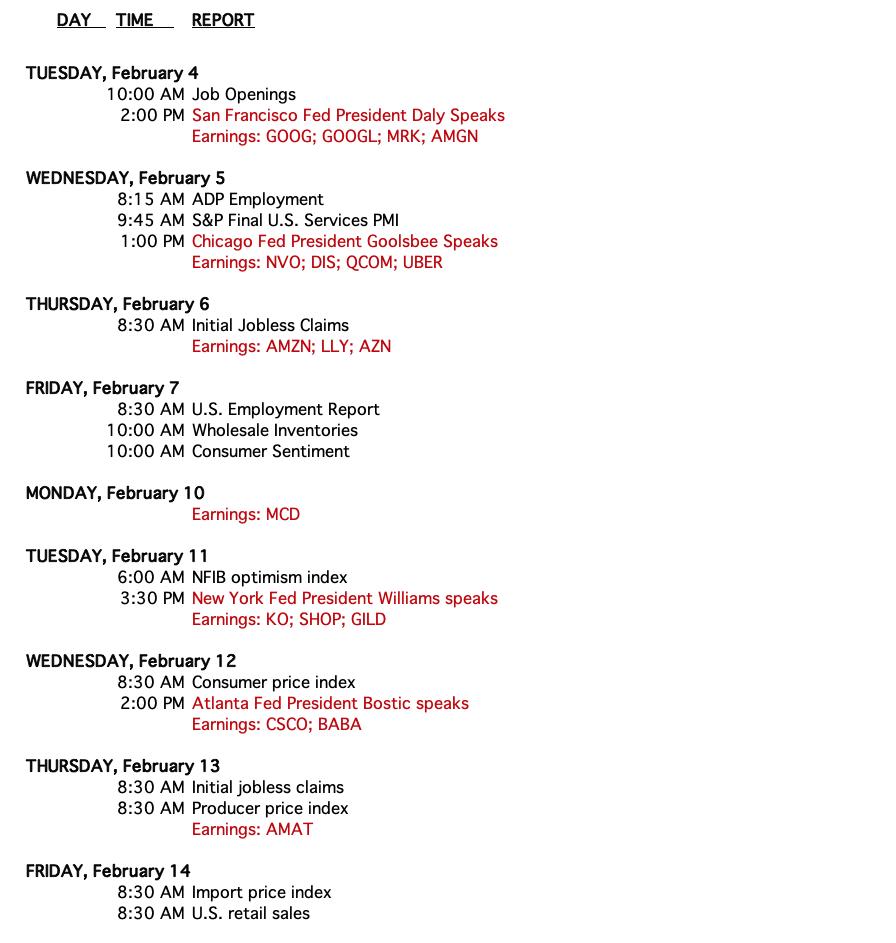
CALENDAR
Have you subscribed the DecisionPoint Diamonds yet? DP does the work for you by providing handpicked stocks/ETFs from exclusive DP scans! Add it with a discount! Contact support@decisionpoint.com for more information!
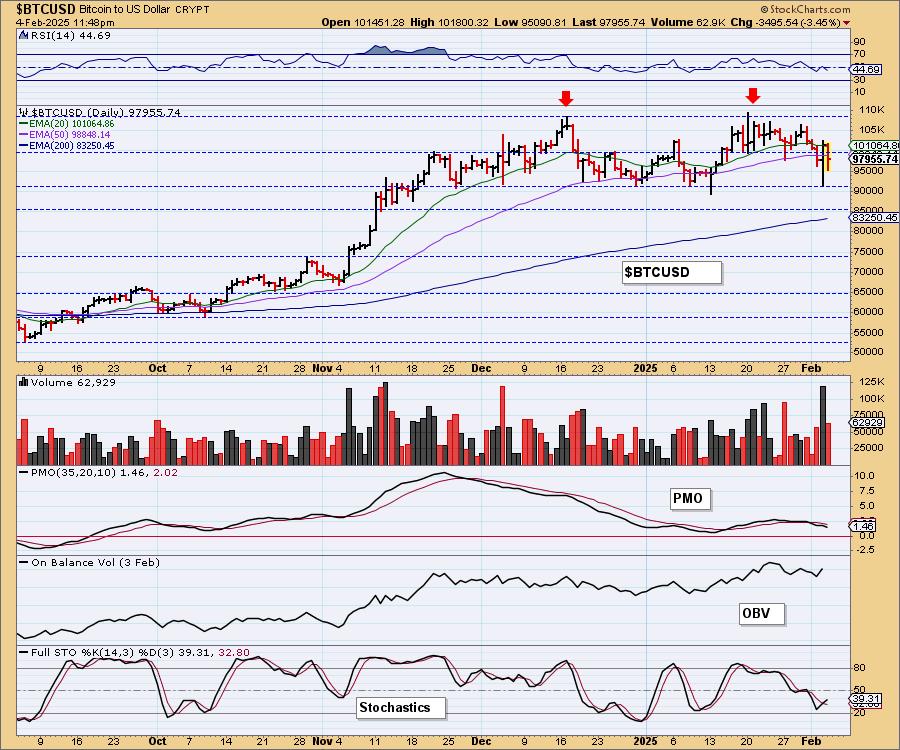
BITCOIN
Bitcoin is going nowhere as it slides sideways in a trading range. This is starting to look a bit like a bearish double top with the December top being the first and the 2025 high being the second. Combine this with a declining PMO and there is a higher probability that support won't hold at 90,000. We've been looking toward a breakout but this topping pattern has us concerned.
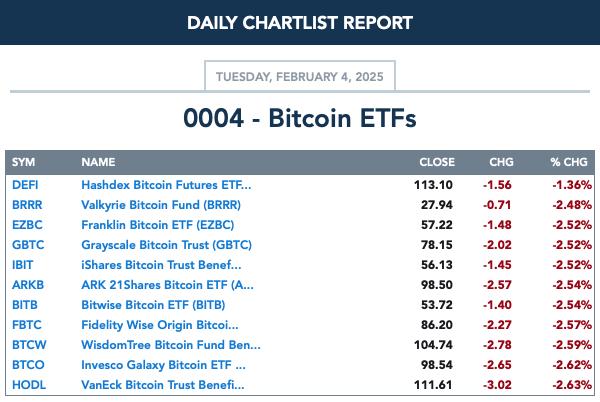
BITCOIN ETFs
INTEREST RATES
Yields are in declining trends and are likely to continue downward from here. Bond funds are getting their time in the sun.
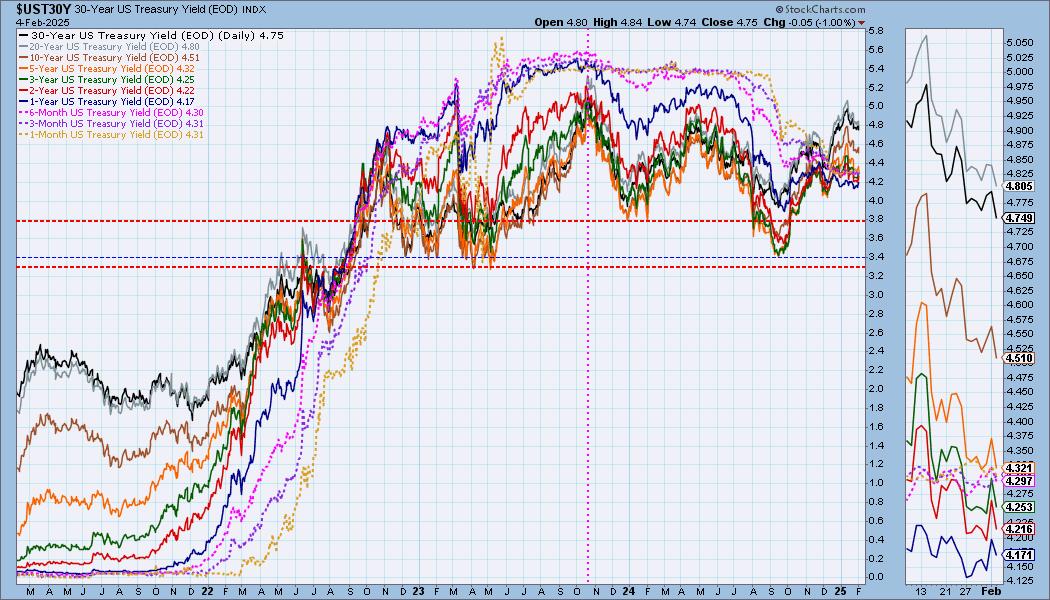
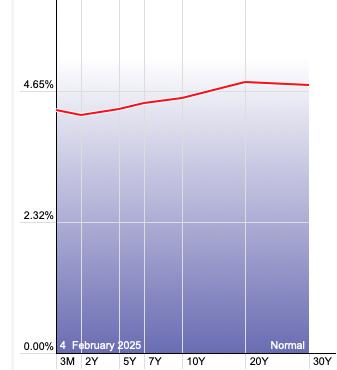
The Yield Curve Chart from StockCharts.com shows us the inversions taking place. The red line should move higher from left to right. Inversions are occurring where it moves downward.
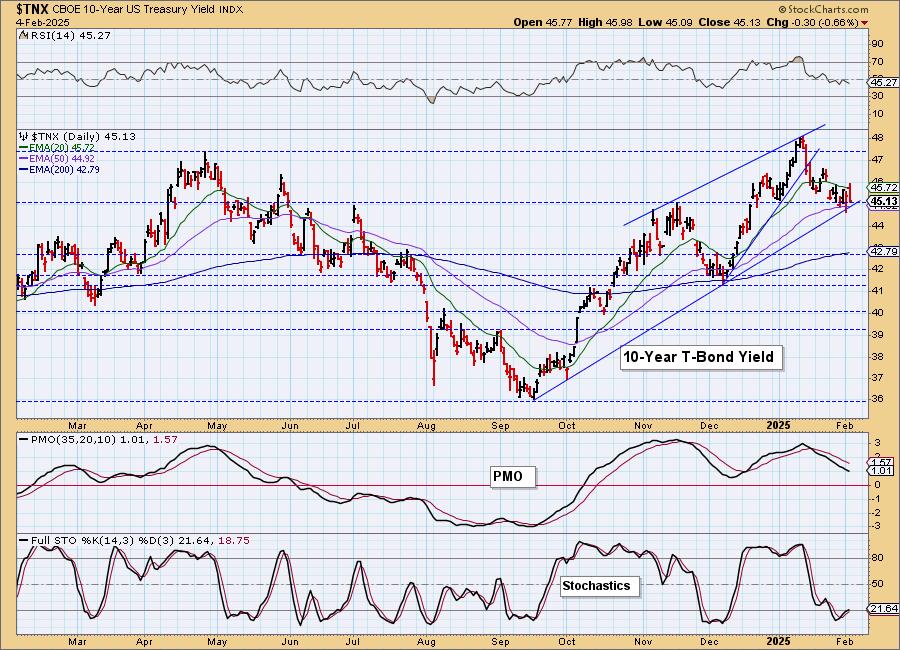
10-YEAR T-BOND YIELD
$TNX will not break down. It continues to cling to support at the November high and the 50-day EMA. It is preventing it from dropping out of the current rising trend. Stochastics have turned up, but given the bearish look of the PMO, we are expecting a breakdown.
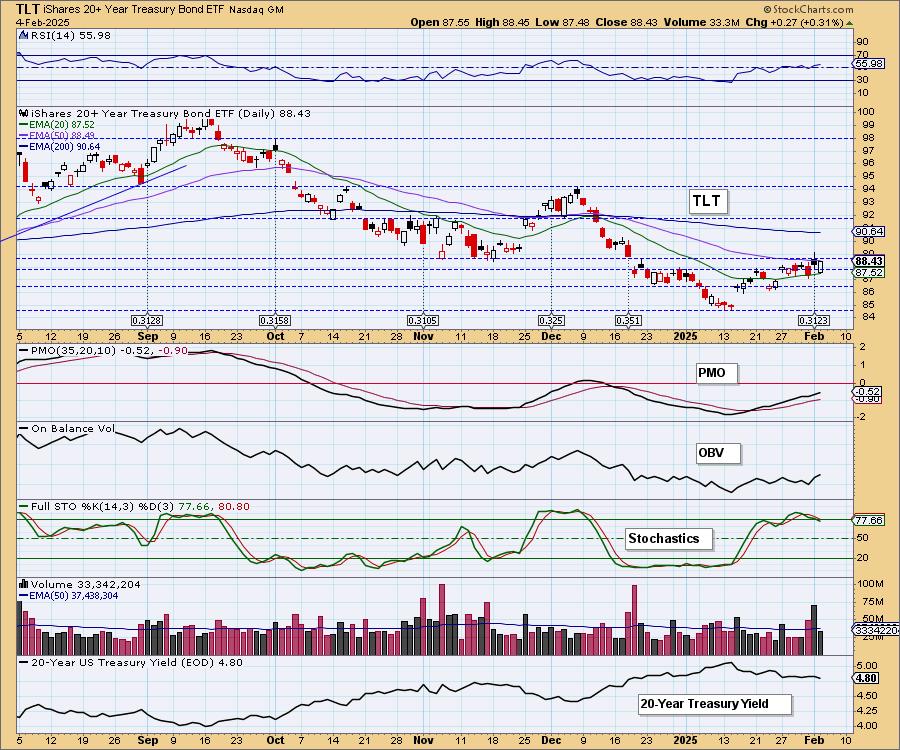
BONDS (TLT)
IT Trend Model: NEUTRAL as of 11/10/2024
LT Trend Model: SELL as of 12/13/2024
TLT Daily Chart: The only problem we see on TLT is that Stochastics are falling. The RSI and PMO look healthy and the 20-year yield is in a declining trend so we do expect more upside out of TLT.
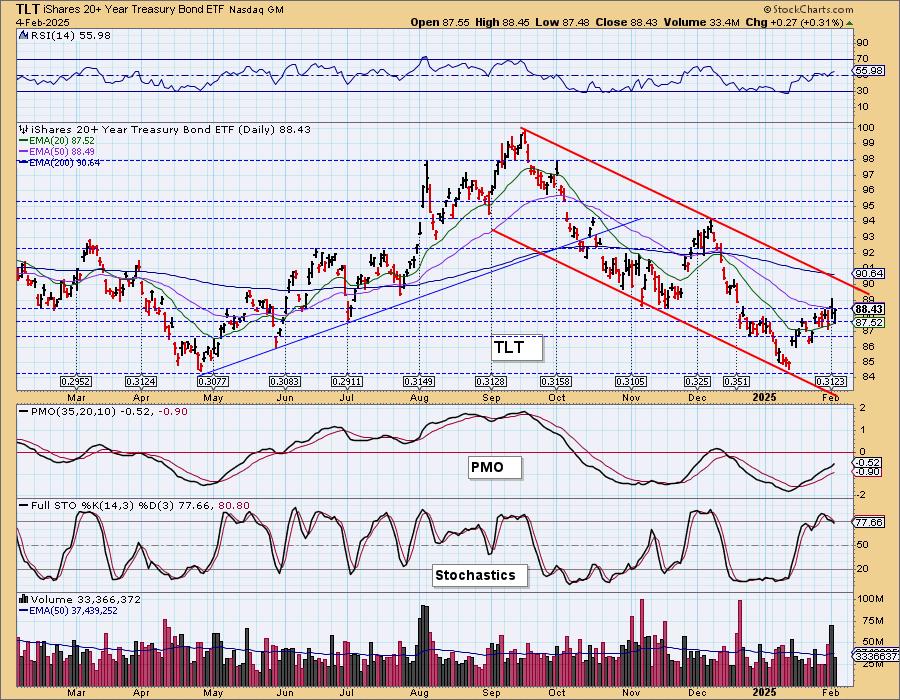
Price is still in a long-term declining trend channel so upside potential may be limited.
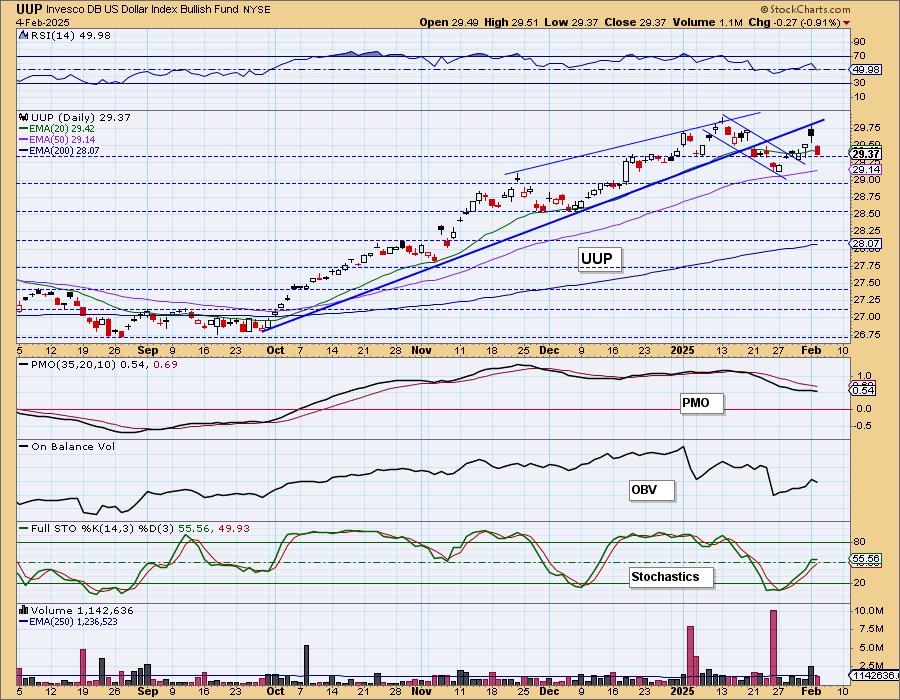
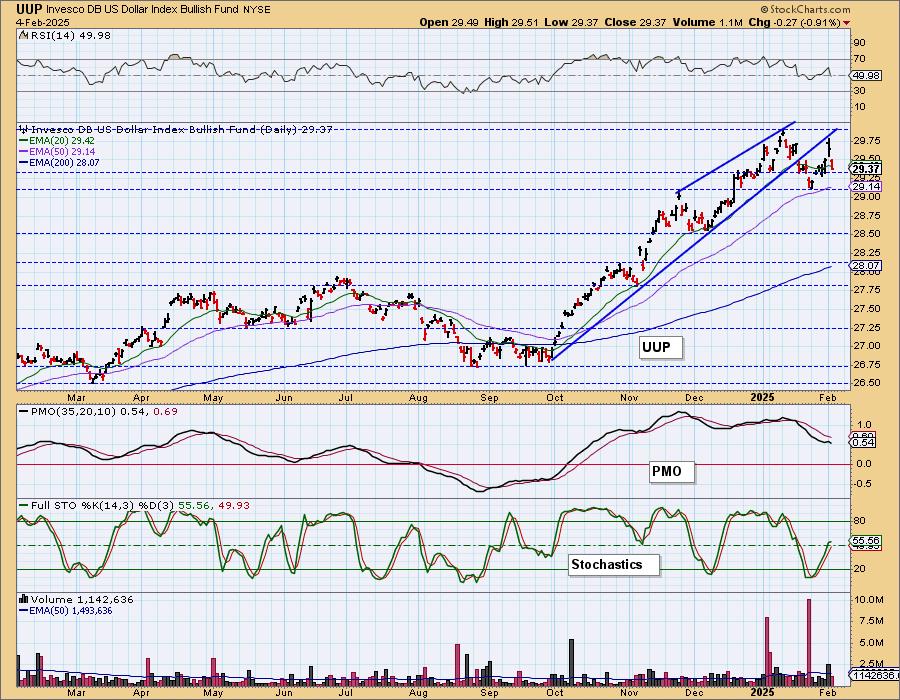
DOLLAR (UUP)
IT Trend Model: BUY as of 10/9/2024
LT Trend Model: BUY as of 5/25/2023
UUP Daily Chart: The Dollar dropped, but is above support. The decline did push the PMO lower and the RSI just left positive territory. Stochastics stalled. We've been looking for more upside out of this bull flag, but it does look vulnerable to more decline.
GOLD
IT Trend Model: BUY as of 1/10/2025
LT Trend Model: BUY as of 10/20/2023
GLD Daily Chart: Gold enjoyed a strong rally on the Dollar's decline. It continues to make new all-time highs. The RSI is now in overbought territory so it is time to see some cooling. Indicators are still very bullish and relative strength is rising against the Dollar.
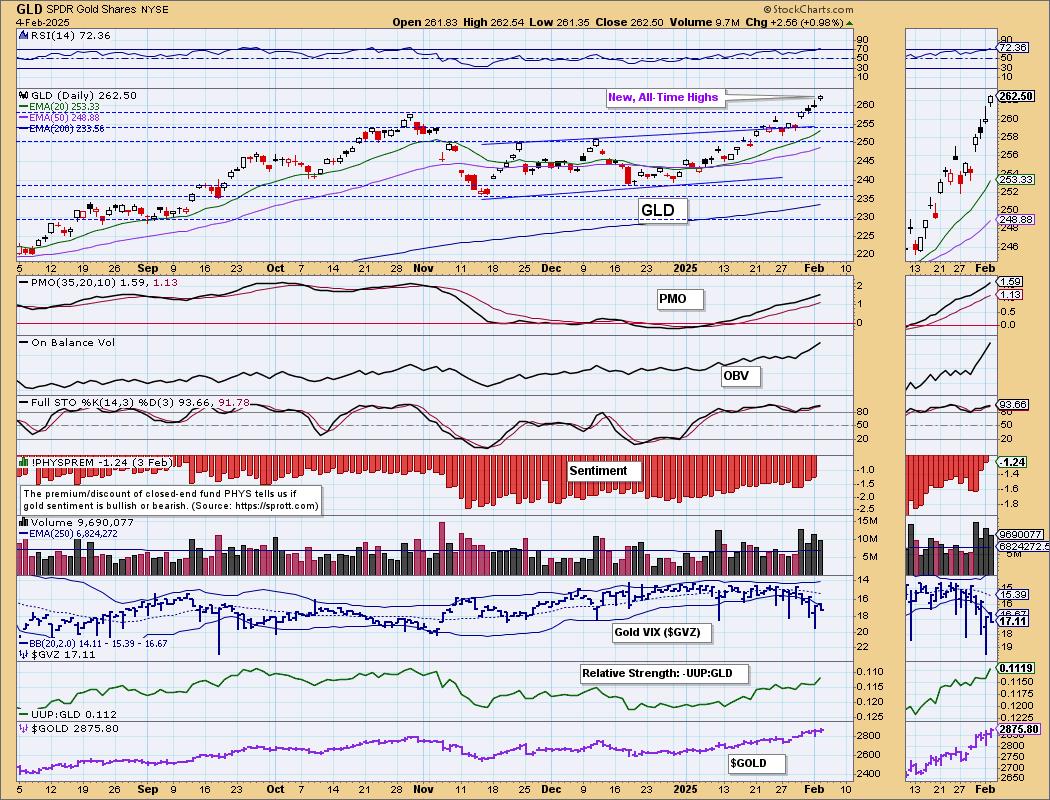
Discounts have been slowly paring back which tells us that investors are getting more bullish on Gold. As we said above, it still looks very good for Gold, but it does seem time to get some consolidation.

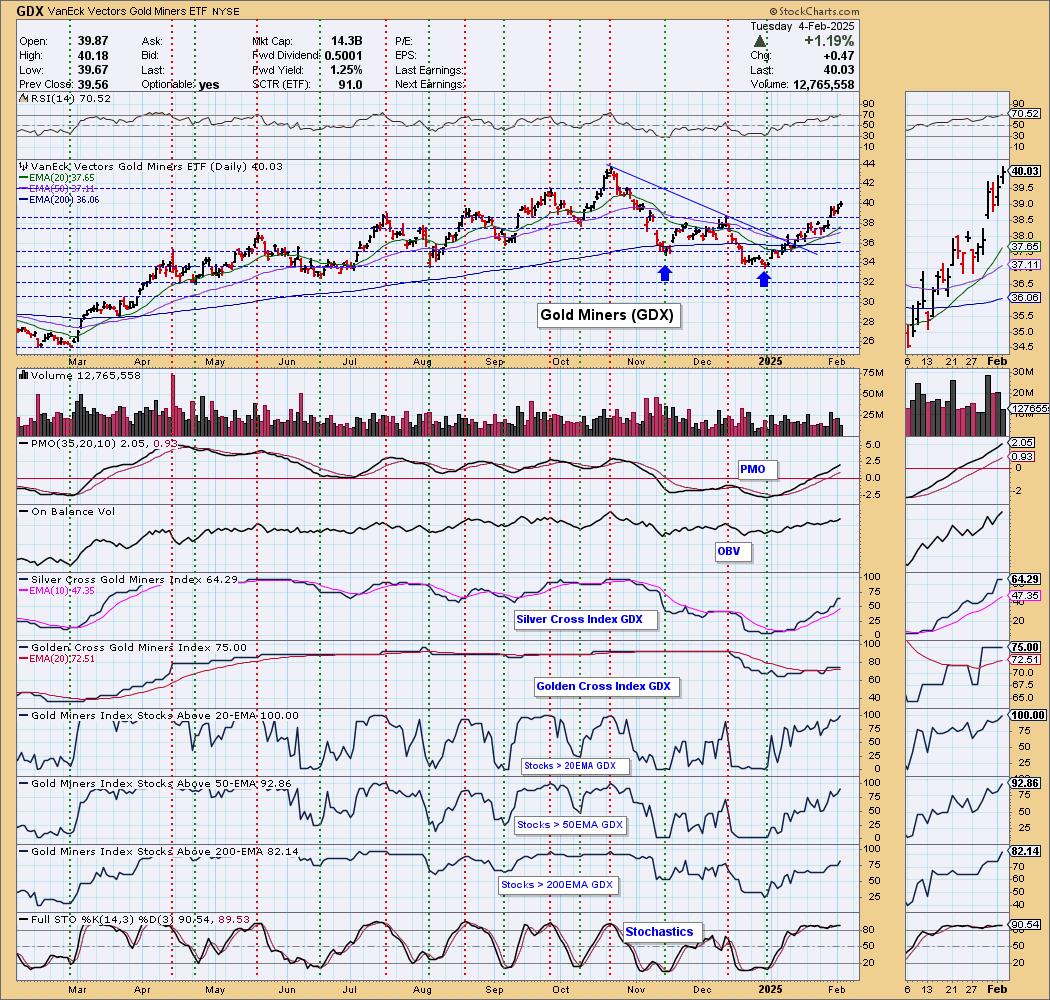
GOLD MINERS (GDX) Daily Chart: We now have all Gold Miners with price above their 20-day EMAs and nearly all are above their 50-day EMA. Gold is due for a pause so we could see the same for Gold Miners, but ultimately we are expecting them to challenge last year's high.
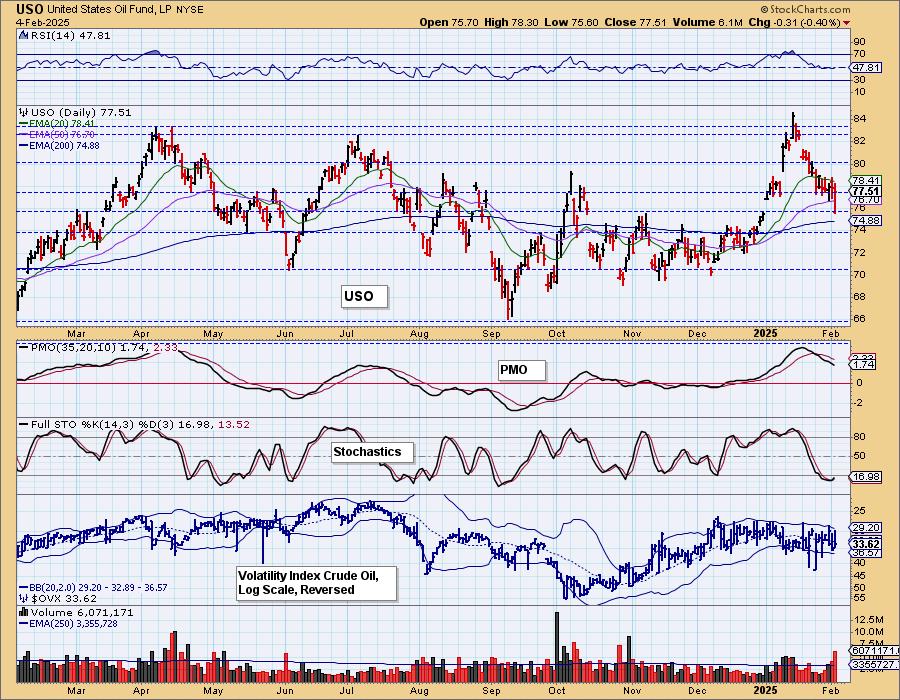
CRUDE OIL (USO)
IT Trend Model: BUY as of 12/24/2024
LT Trend Model: BUY as of 1/10/2025
USO Daily Chart: Today saw a bullish hollow red candlestick. Price closed above the open, but it was below yesterday's close. This could be a possible bottom, but price pressures are bringing Crude lower as the administration continues to gear up on the national energy emergency order. We just don't see much upside potential, but this may be a chance for price to recover a few losses. This is fairly strong support at the November top and 200-day EMA so maybe we see a little upside before the decline continues.
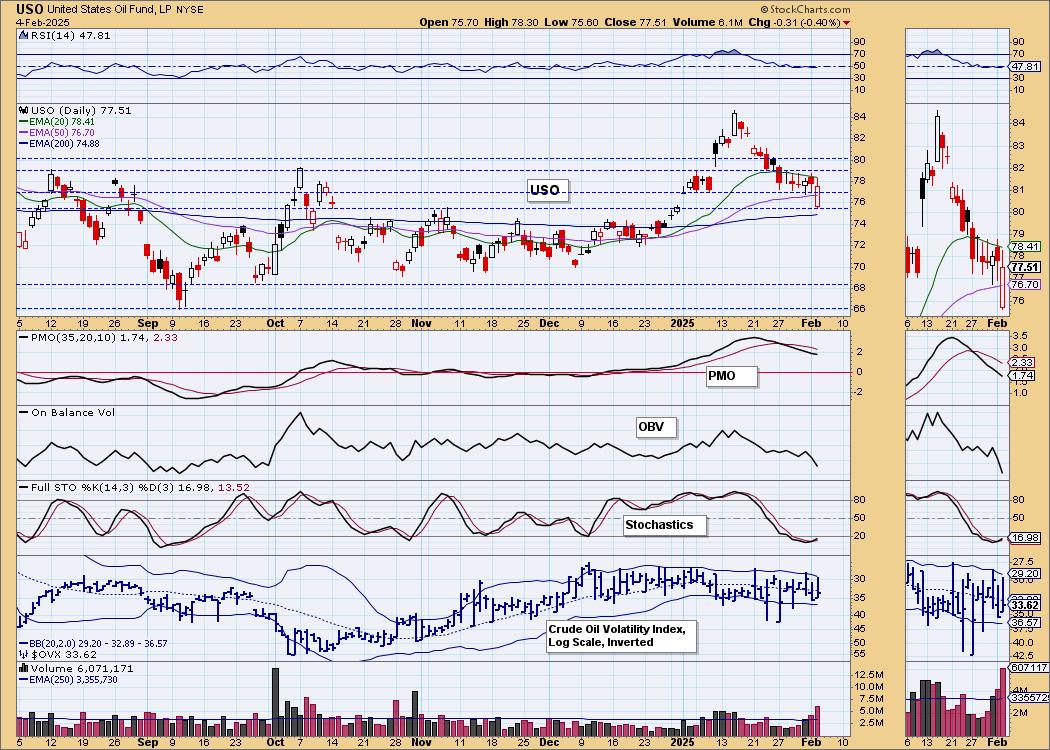
Price hit the top of a very long-term trading range so it isn't surprising to see the correction. It's time for price to test the bottom of the range and that is where we believe it is ultimately headed.
Good Luck & Good Trading!
Erin Swenlin and Carl Swenlin
Technical Analysis is a windsock, not a crystal ball. --Carl Swenlin
(c) Copyright 2025 DecisionPoint.com
Disclaimer: This blog is for educational purposes only and should not be construed as financial advice. The ideas and strategies should never be used without first assessing your own personal and financial situation, or without consulting a financial professional. Any opinions expressed herein are solely those of the author, and do not in any way represent the views or opinions of any other person or entity.
DecisionPoint is not a registered investment advisor. Investment and trading decisions are solely your responsibility. DecisionPoint newsletters, blogs or website materials should NOT be interpreted as a recommendation or solicitation to buy or sell any security or to take any specific action.
NOTE: The signal status reported herein is based upon mechanical trading model signals, specifically, the DecisionPoint Trend Model. They define the implied bias of the price index based upon moving average relationships, but they do not necessarily call for a specific action. They are information flags that should prompt chart review. Further, they do not call for continuous buying or selling during the life of the signal. For example, a BUY signal will probably (but not necessarily) return the best results if action is taken soon after the signal is generated. Additional opportunities for buying may be found as price zigzags higher, but the trader must look for optimum entry points. Conversely, exit points to preserve gains (or minimize losses) may be evident before the model mechanically closes the signal.
Helpful DecisionPoint Links:
DecisionPoint Alert Chart List
DecisionPoint Golden Cross/Silver Cross Index Chart List
DecisionPoint Sector Chart List
Price Momentum Oscillator (PMO)