
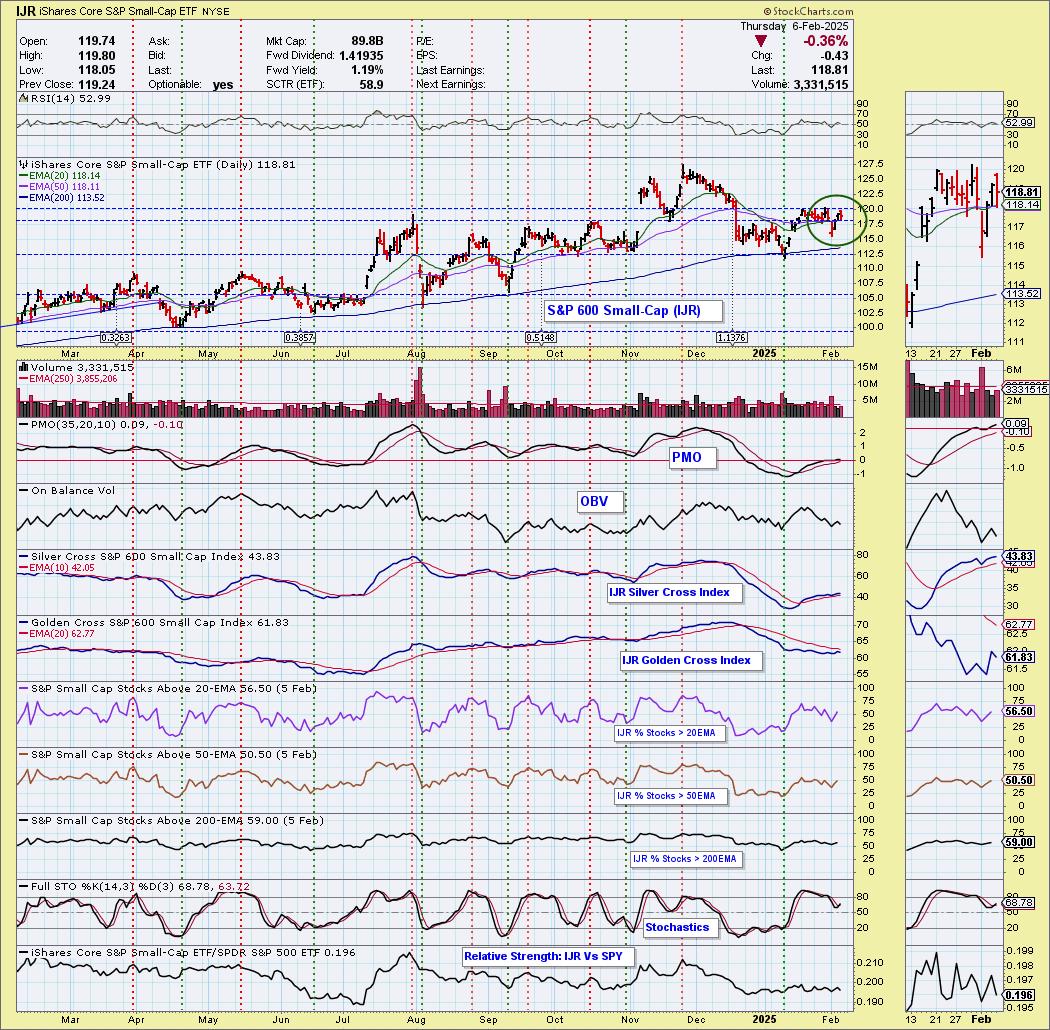
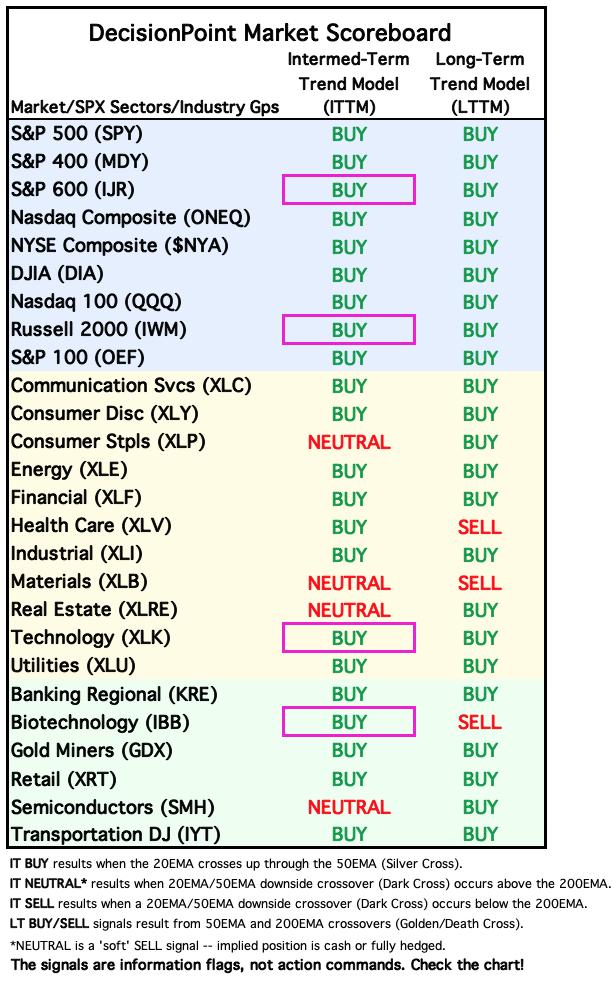
Today the S&P 600 Small-Cap Index ETF (IJR) 20-day EMA crossed up through the 50-day EMA (Silver Cross), generating an IT Trend Model BUY Signal. Price isn't going anywhere and is up against resistance. Participation is above our 50% bullish threshold, but just barely. There is an opportunity for a breakout here, but we don't think we'll get much upside out of this signal.
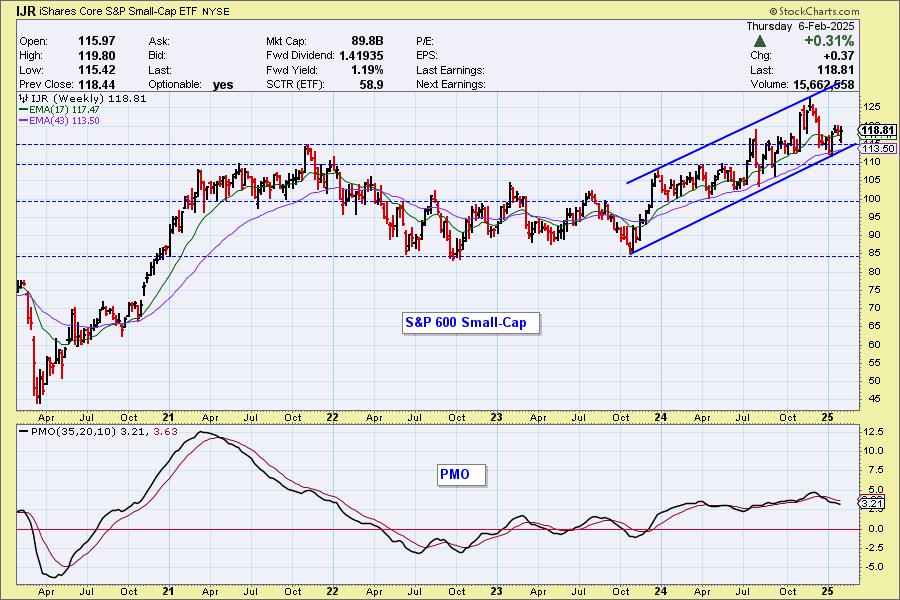
The IJR weekly chart shows price near the bottom of a rising trend channel. Price did not get to the top of the channel before turning down which is a sign of weakness. The weekly PMO is also in decline.
____________
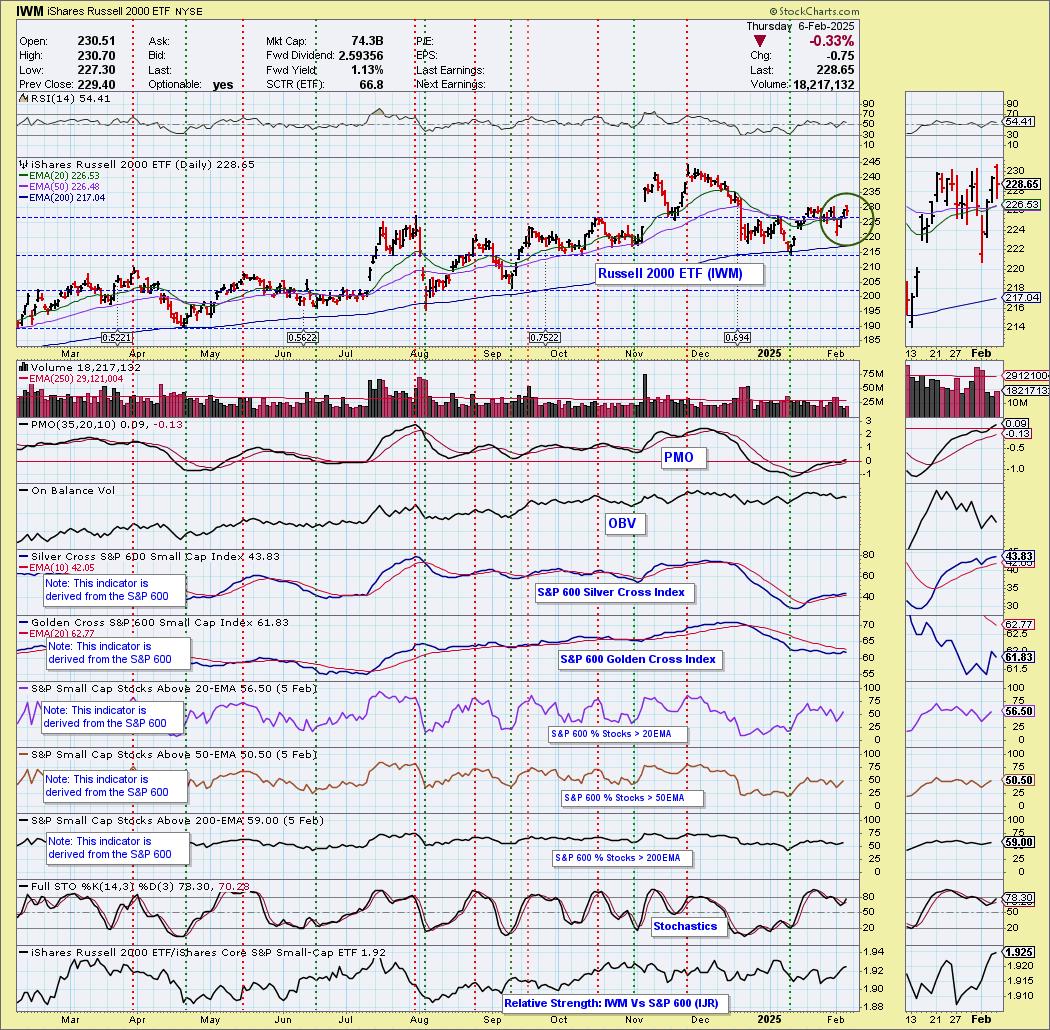
Also today, the Russell 2000 ETF (IWM) 20-day EMA crossed up through the 50-day EMA (Silver Cross), generating an IT Trend Model BUY Signal. It is also stuck beneath resistance. The PMO has entered positive territory and the RSI is currently positive so we could get a breakout here, but as with IJR we don't see much upside potential.
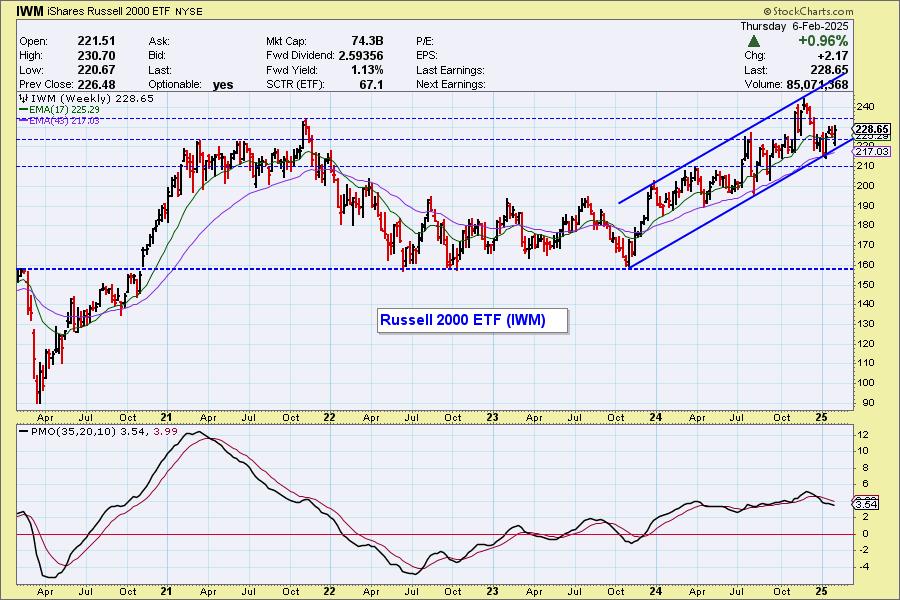
Not surprisingly the IWM weekly chart shows price near the bottom of a rising trend channel, just like IJR. The weekly PMO is in decline so the rising trend is likely vulnerable.
____________
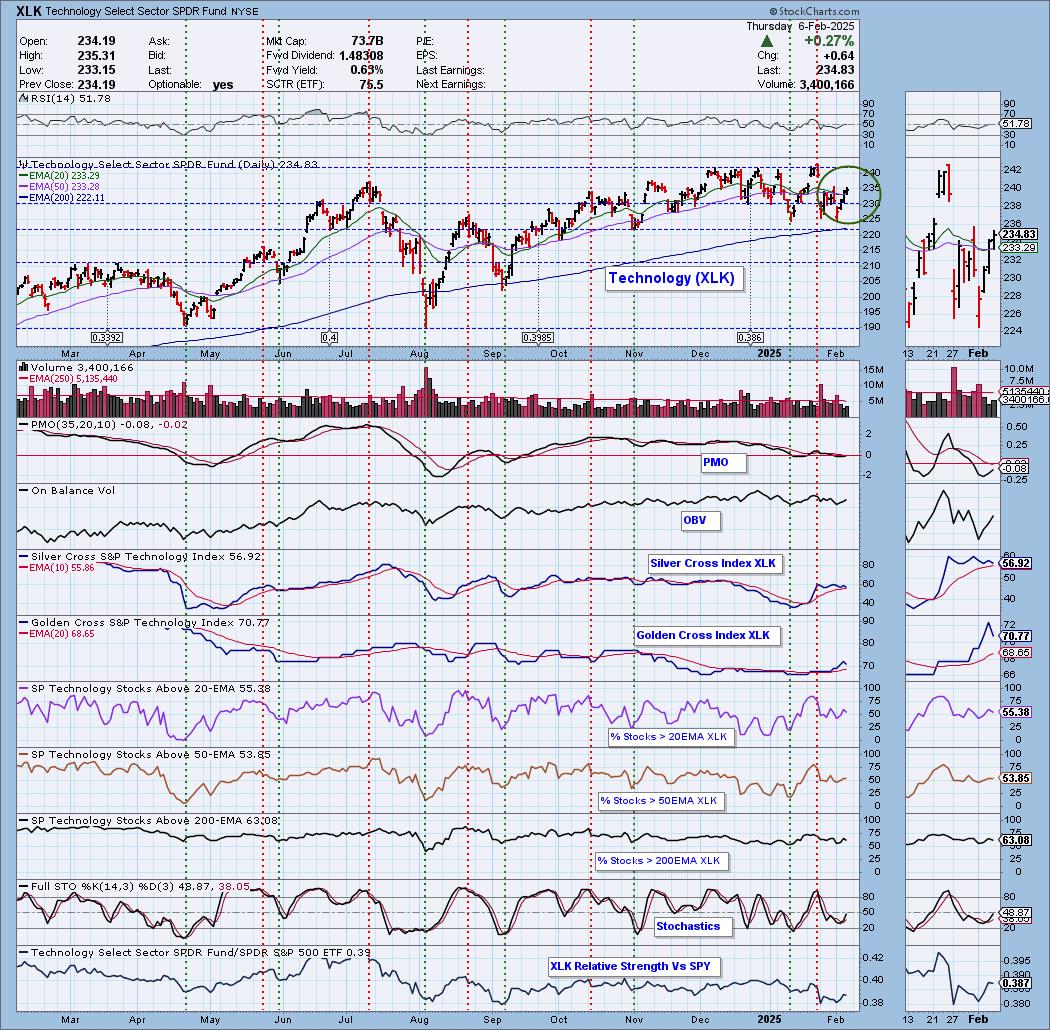
Also, the Technology Sector ETF (XLK) 20-day EMA crossed up through the 50-day EMA (Silver Cross), generating an IT Trend Model BUY Signal. We continue to see whipsaw as price essentially moves sideways beneath resistance. Participation is above our bullish 50% threshold, but as with IJR, just barely. Both the Silver Cross Index and Golden Cross Index are in decline. This signal is vulnerable given the 20/50-day EMAs are only one one-hundredth of a point away from each other.
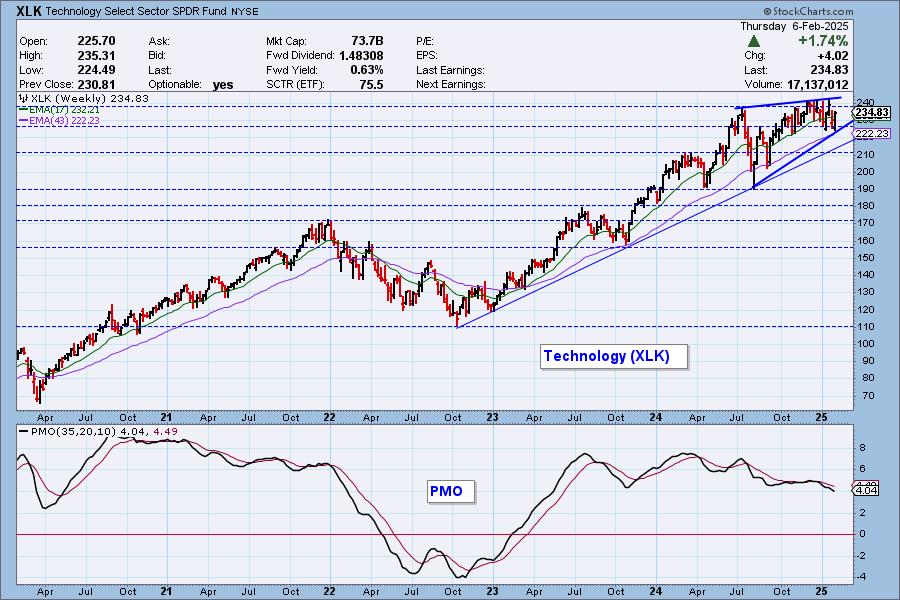
The weekly XLK chart shows a bearish rising wedge. We have a rising wedge formation on the weekly chart which is bearish and suggests we will see a breakdown. The weekly PMO is in agreement.
____________
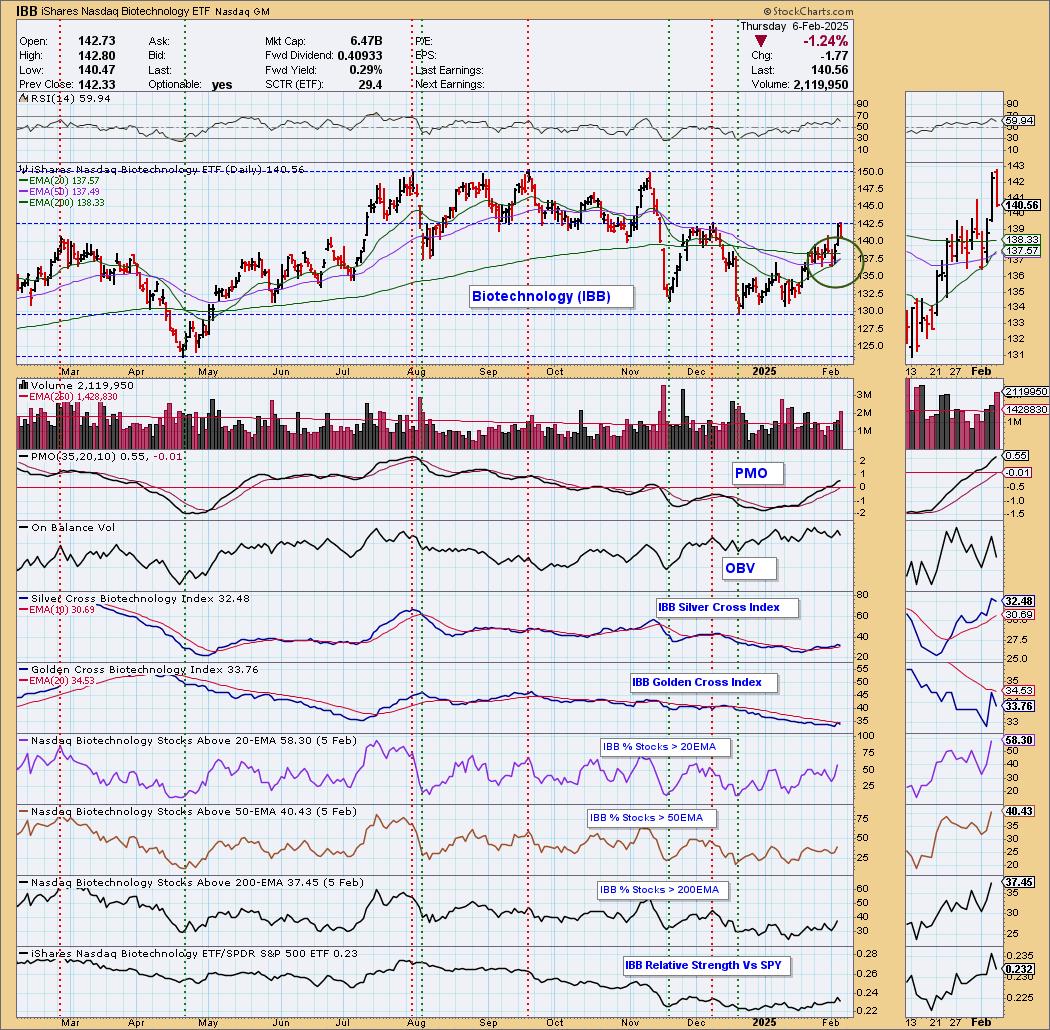
Finally, the Biotechnology ETF (IBB) 20-day EMA crossed up through the 50-day EMA (Silver Cross), generating an IT Trend Model BUY Signal. Price hit overhead resistance, but could see a breakout. The PMO is rising strongly and participation of stocks above their 20-day EMA is rising quickly. More work needs to be done, but this is a good start.
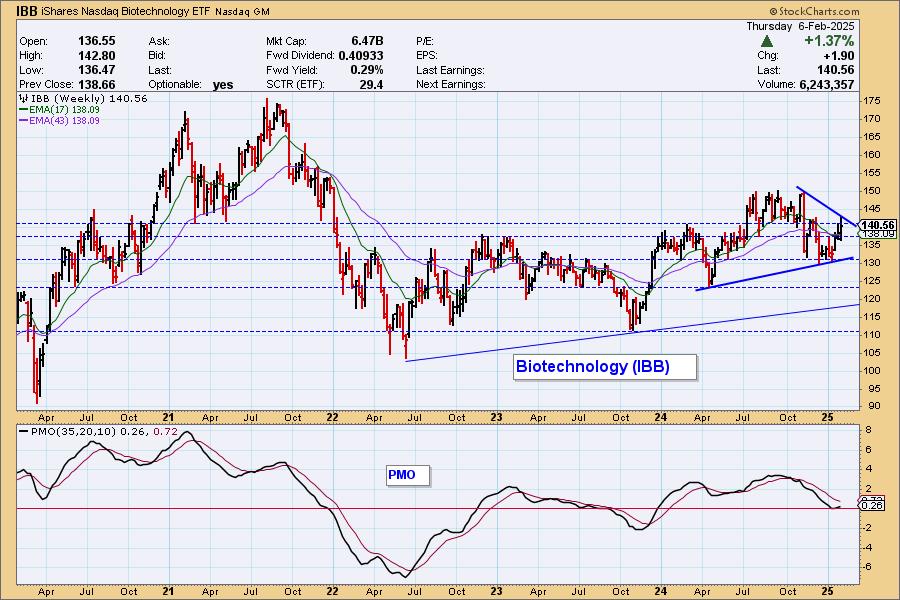
Longer-term IBB is trending upward, but closer it is in a triangle formation. These can break in either direction but typically they are continuation patterns. The prior trend was up so the expectation would be a breakout not a breakdown. The weekly PMO is rising above the zero line.
The DecisionPoint Alert Weekly Wrap presents an end-of-week assessment of the trend and condition of the Stock Market, the U.S. Dollar, Gold, Crude Oil, and Bonds. The DecisionPoint Alert daily report (Monday through Thursday) is abbreviated and gives updates on the Weekly Wrap assessments.
Watch the latest episode of DecisionPoint on our YouTube channel here!
MARKET/INDUSTRY GROUP/SECTOR INDEXES
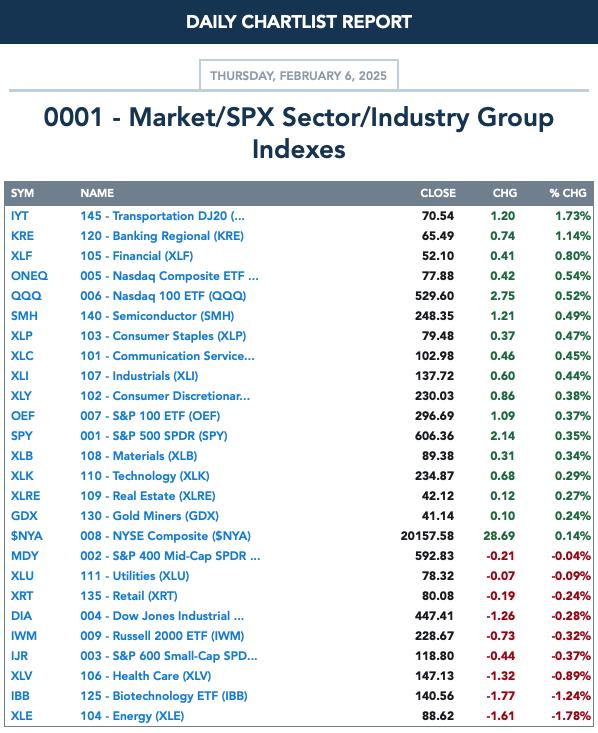
CLICK HERE for Carl's annotated Market Index, Sector, and Industry Group charts.
THE MARKET (S&P 500)
IT Trend Model: BUY as of 8/14/2024
LT Trend Model: BUY as of 3/29/2023
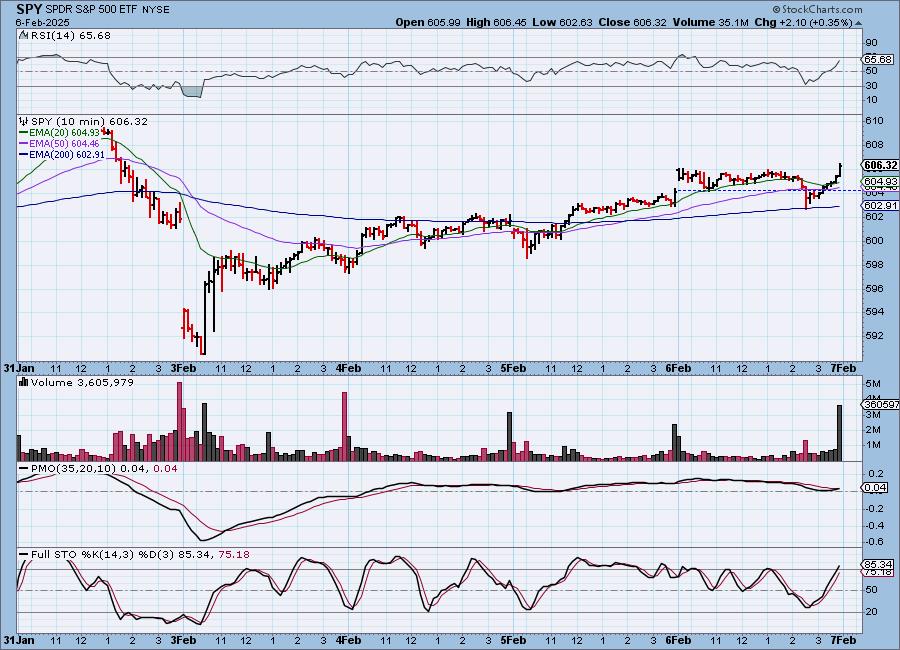
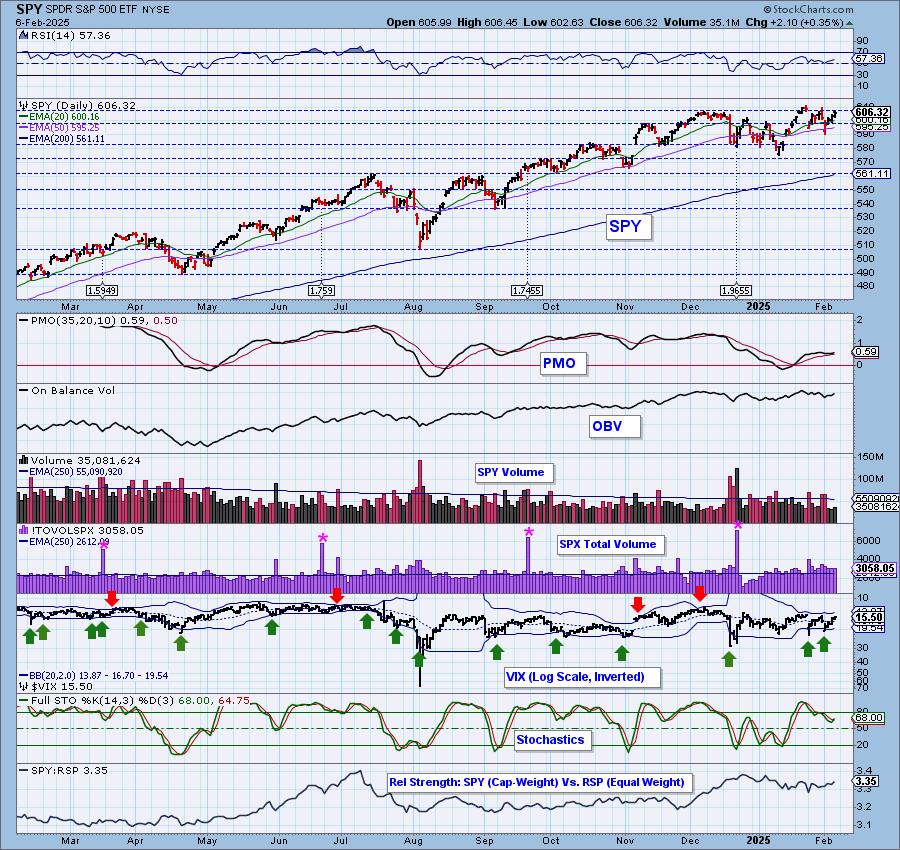
SPY 10-Minute Chart: The market was mostly stagnant, trading slightly higher. We saw a quick decline, but losses were quickly recouped. The 10-minute PMO is crossing its signal line.
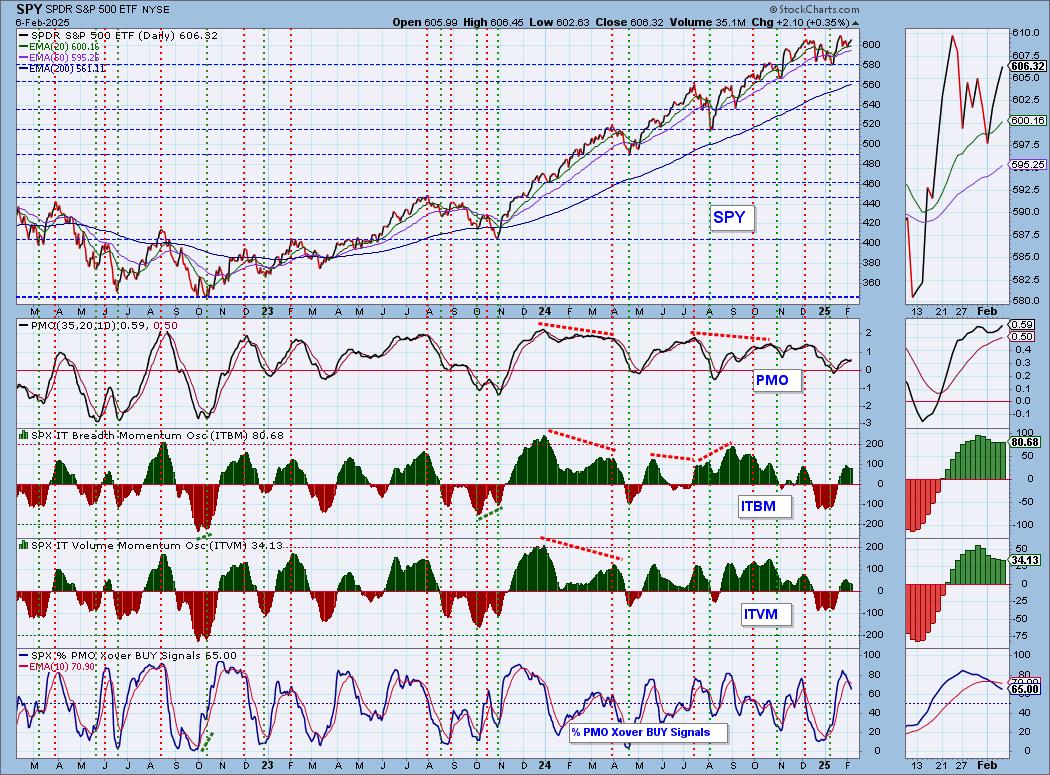
SPY Daily Chart: The declining trend was almost broken with today's rally. The PMO is back on the rise. Currently we have a declining trend on the OBV which confirms the downtrend in price.
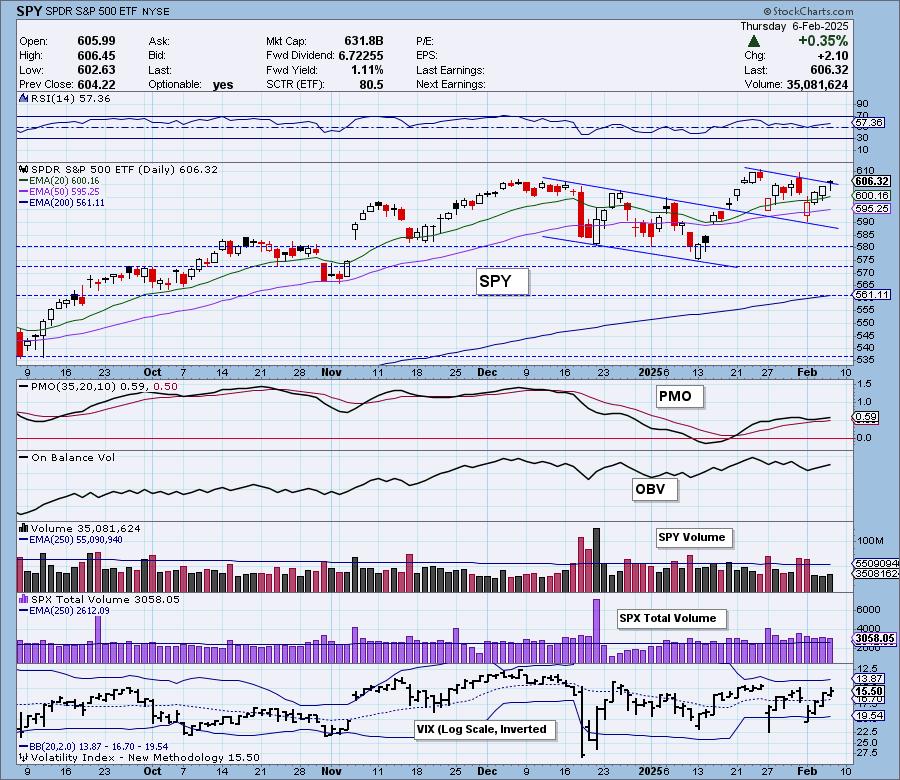
Stochastics tipped upward today and the VIX traded above its moving average on the inverted scale. This is near-term positive for price, but the declining trend still troubles us.

Here is the latest recording from 2/3. Click HERE to get to our video list.:
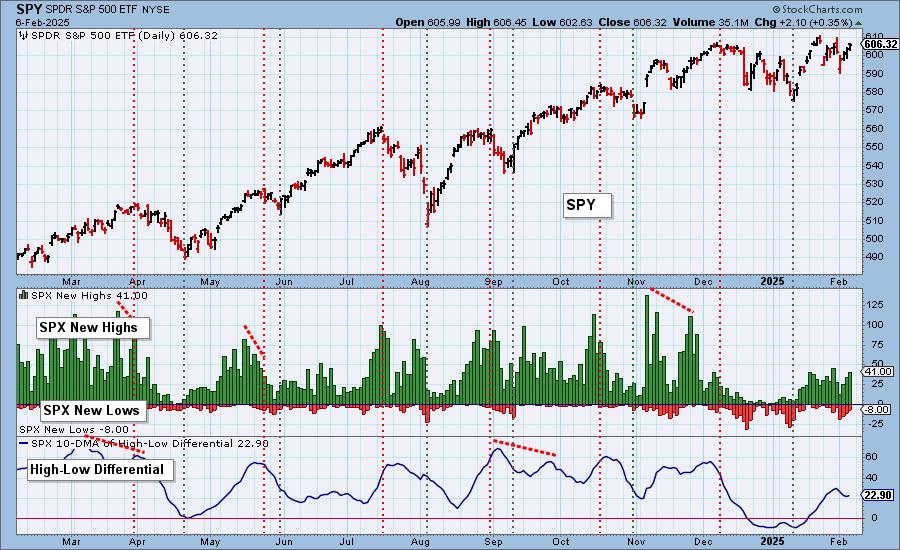
S&P 500 New 52-Week Highs/Lows: New Highs look solid today and we have a declining trend on New Lows which is also positive. The High-Low Differential is rising again.
Climax* Analysis: There were no climax readings today.
*A climax is a one-day event when market action generates very high readings in, primarily, breadth and volume indicators. We also include the VIX, watching for it to penetrate outside the Bollinger Band envelope. The vertical dotted lines mark climax days -- red for downside climaxes, and green for upside. Climaxes are at their core exhaustion events; however, at price pivots they may be initiating a change of trend.
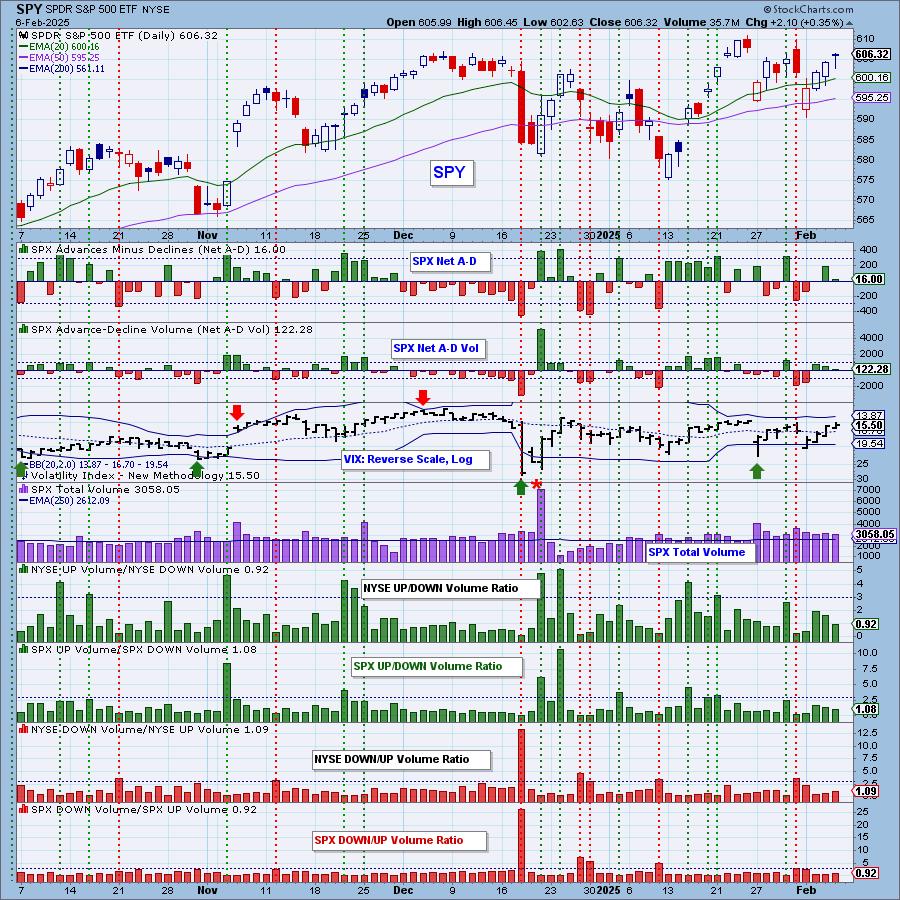
Short-Term Market Indicators: The short-term market trend is DOWN and the condition is NEUTRAL.
Swenlin Trading Oscillators (STOs) both turned lower which is a big attention flag that despite a rally, there are internal problems. Participation and %PMOs Rising both topped on today's rally.
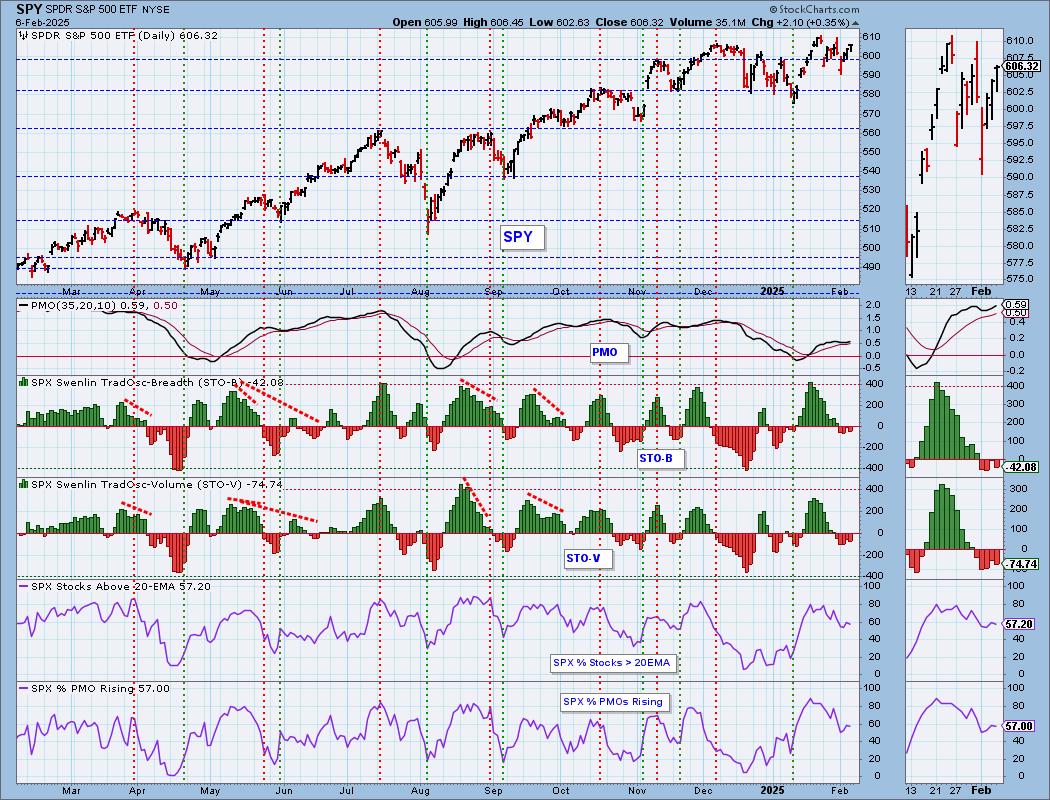
Intermediate-Term Market Indicators: The intermediate-term market trend is UP and the condition is NEUTRAL.
The ITBM and ITVM both declined today in concert with the STOs. We continue to lose PMO BUY Signals. This is not a healthy chart.
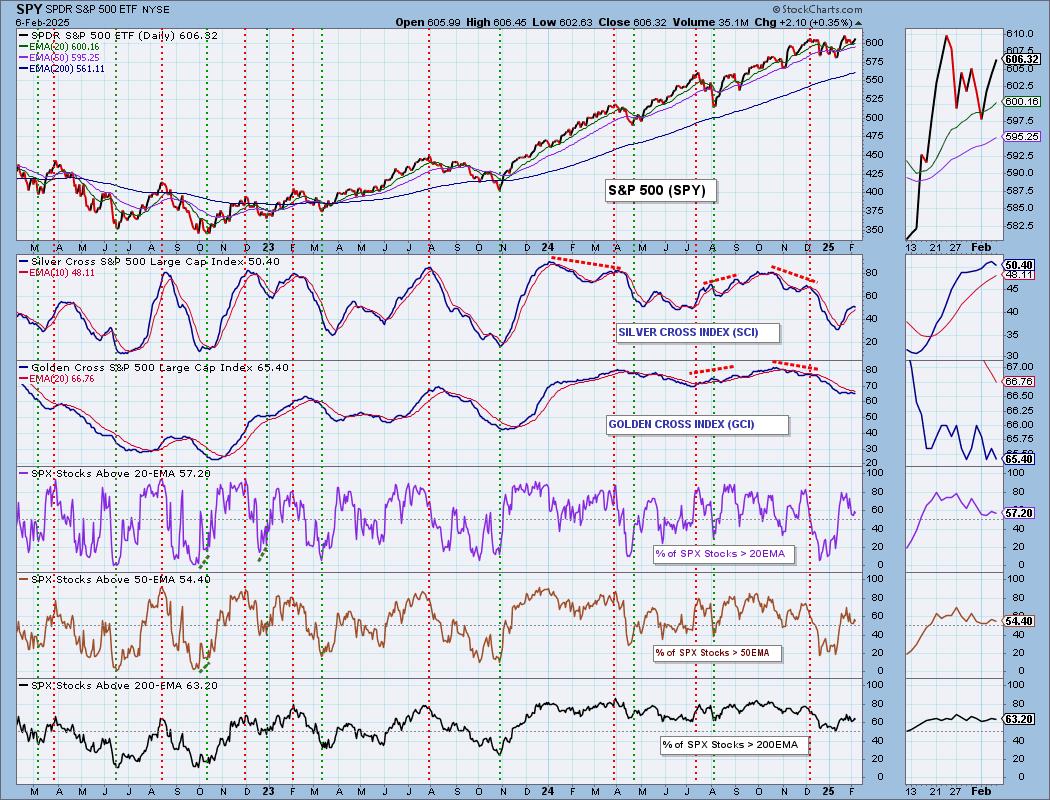
PARTICIPATION CHART (S&P 500): The following chart objectively shows the depth and trend of participation for the SPX in two time frames.
- Intermediate-Term - the Silver Cross Index (SCI) shows the percentage of SPX stocks on IT Trend Model BUY signals (20-EMA > 50-EMA). The opposite of the Silver Cross is a "Dark Cross" -- those stocks are, at the very least, in a correction.
- Long-Term - the Golden Cross Index (GCI) shows the percentage of SPX stocks on LT Trend Model BUY signals (50-EMA > 200-EMA). The opposite of a Golden Cross is the "Death Cross" -- those stocks are in a bear market.
The market bias is BULLISH in the intermediate term.
The market bias is BEARISH in the long term.
The rally did not see an expansion in participation, instead it declined suggesting the broad market is struggling. Participation also is in a declining trend while price is inching higher. The Silver Cross Index topped today as did the Golden Cross Index. The Silver Cross Index could conceivably turn back up as there are slightly more stocks above the 20/50-day EMAs versus Silver Crosses. It is above its signal line so the IT Bias is BULLISH. The Golden Cross Index is likely to continue lower as there are fewer stocks above their 50/200-day EMAs than those with Golden Crosses.
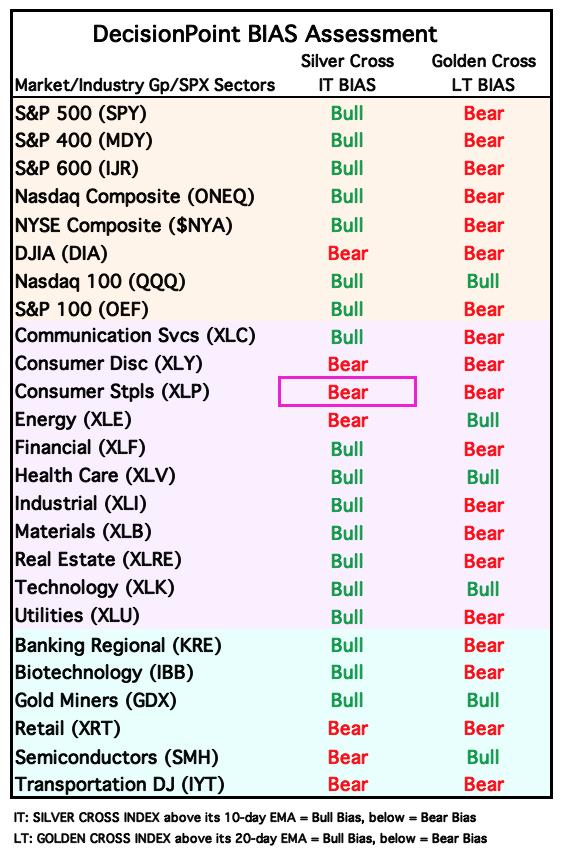
BIAS Assessment: The following table expresses the current BIAS of various price indexes based upon the relationship of the Silver Cross Index to its 10-day EMA (intermediate-term), and of the Golden Cross Index to its 20-day EMA (long-term). When the Index is above the EMA it is bullish, and it is bearish when the Index is below the EMA. The BIAS does not imply that any particular action should be taken. It is information to be used in the decision process.
The items with highlighted borders indicate that the BIAS changed today.
*****************************************************************************************************
CONCLUSION: Very short-term indicators like Stochastics and the PMO have turned back up and are rising. However, STOs and the ITBM/ITVM topped on a rally day. There is clear weakness as participation continues to back off and both the Silver Cross Index and Golden Cross Index topped today. The market continues to inch higher even as internals deteriorate. This condition won't last too much longer. Of course, mega-caps could keep the index rising, but our portfolios are likely already feeling the strain given participation is just above 50%. Keep stops in play as we see the market as very vulnerable to a decline.
Erin is 50% long, 0% short. (This is intended as information, not a recommendation.)
*****************************************************************************************************
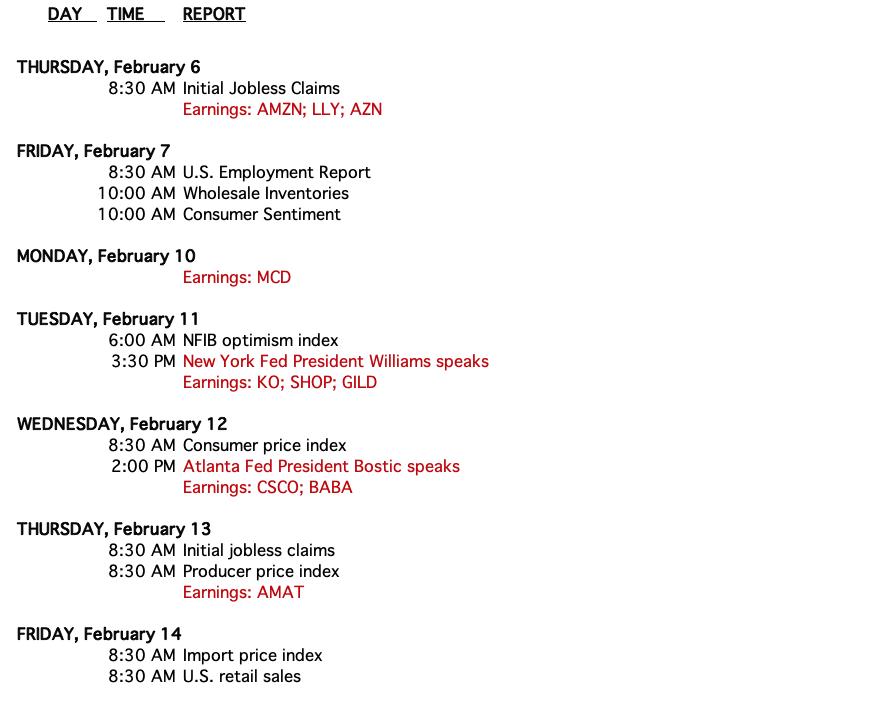
CALENDAR
Have you subscribed the DecisionPoint Diamonds yet? DP does the work for you by providing handpicked stocks/ETFs from exclusive DP scans! Add it with a discount! Contact support@decisionpoint.com for more information!
BITCOIN
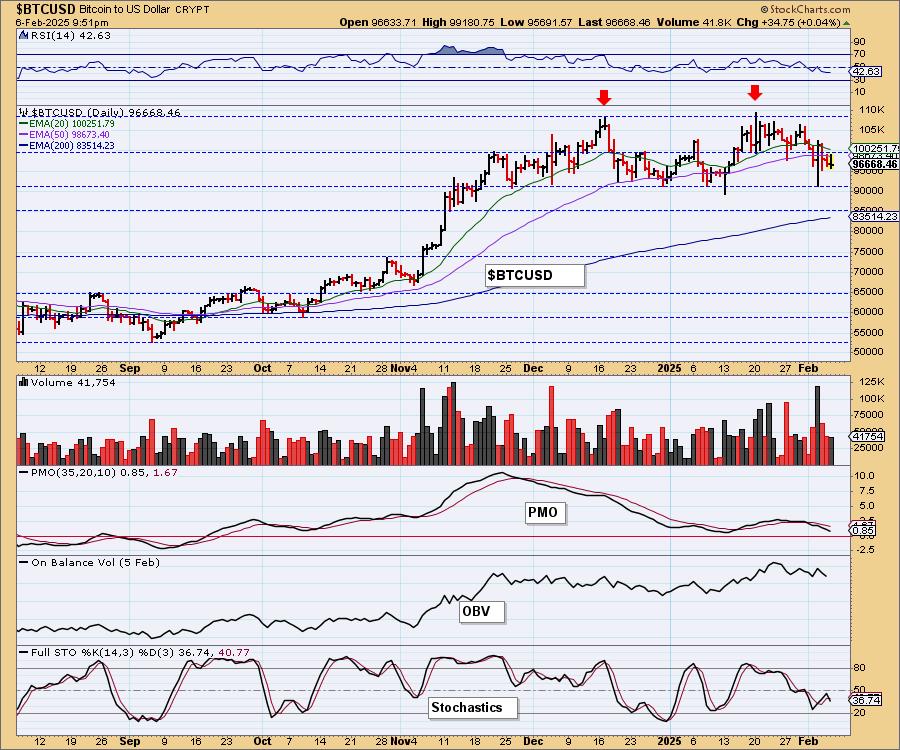
The large bearish double top worries us on Bitcoin. So far support has been holding, but the declining PMO, negative RSI and Stochastics topping in negative territory suggest to us that support will likely be broken.
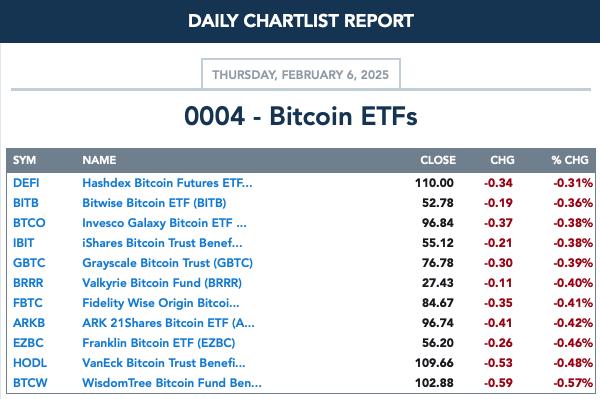
BITCOIN ETFs
INTEREST RATES
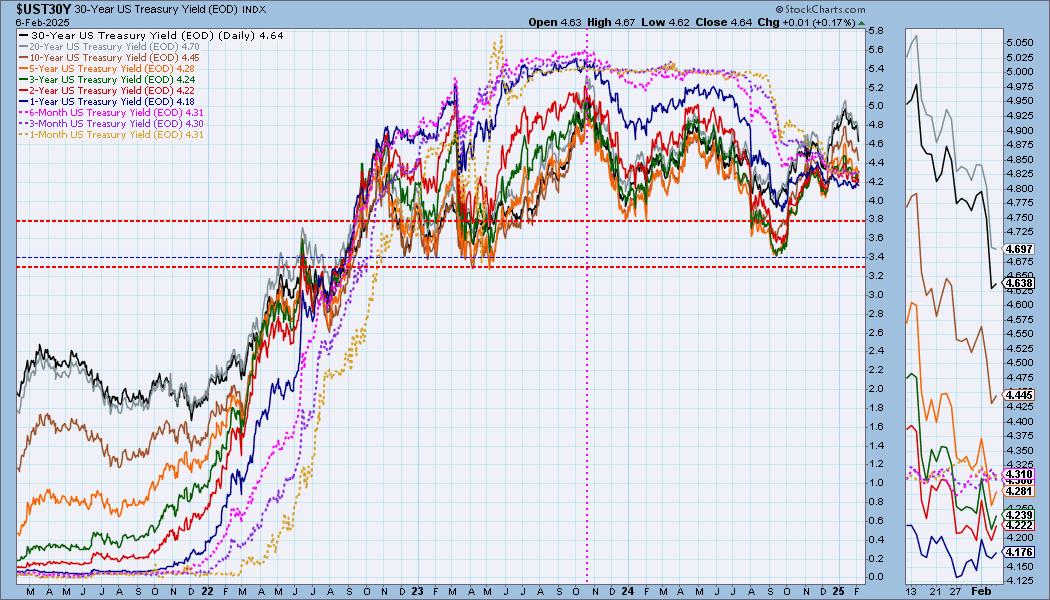
Yields tipped upward today, but remain in declining trends so we believe they have lower to go.
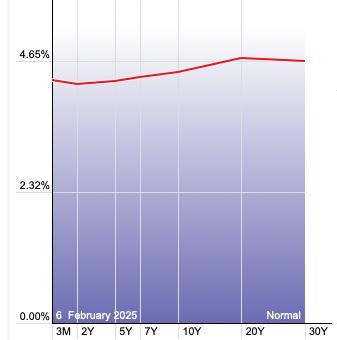
The Yield Curve Chart from StockCharts.com shows us the inversions taking place. The red line should move higher from left to right. Inversions are occurring where it moves downward.
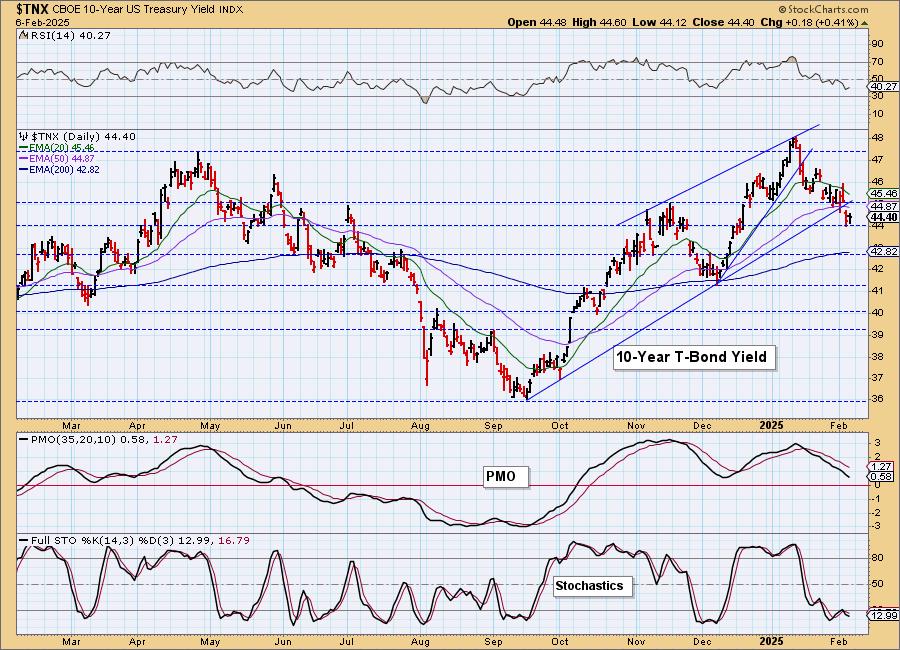
10-YEAR T-BOND YIELD
$TNX broke its rising trend yesterday but managed a small gain on support. The indicators look terrible on this chart so we are expecting the yield, all yields for that matter, to fall further. 4.3% is the next level of strong support.
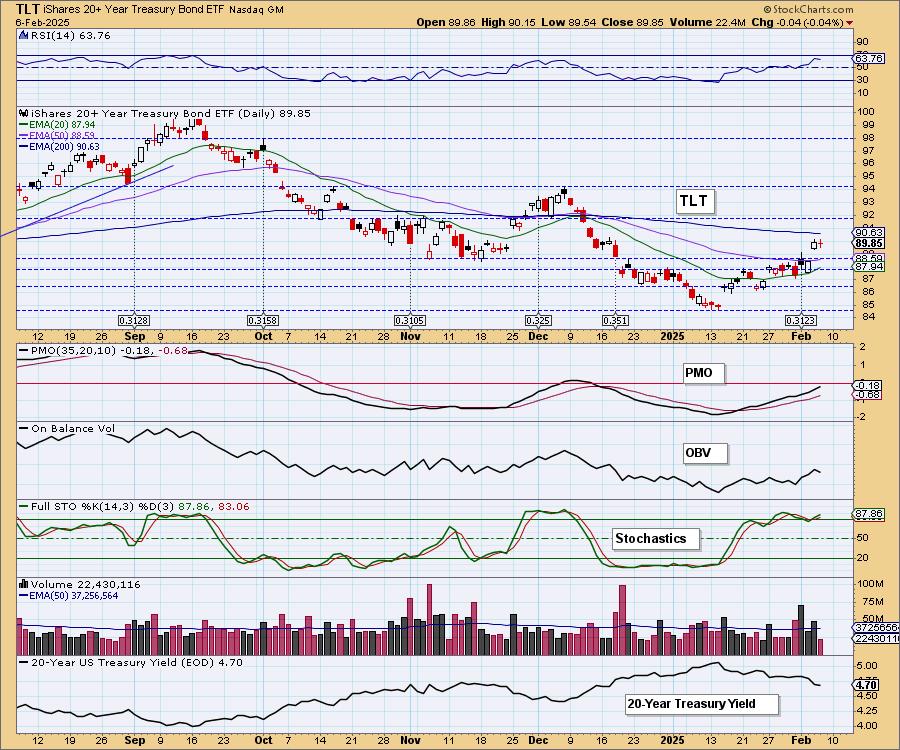
BONDS (TLT)
IT Trend Model: NEUTRAL as of 11/10/2024
LT Trend Model: SELL as of 12/13/2024
TLT Daily Chart: TLT was down slightly today. It is making its way out of a bullish reverse head and shoulders. The minimum upside target hasn't been reached. We see that target bringing price close to 92.00. The PMO and Stochastics are rising bullishly and the RSI is not overbought. We should see more upside on Bonds.
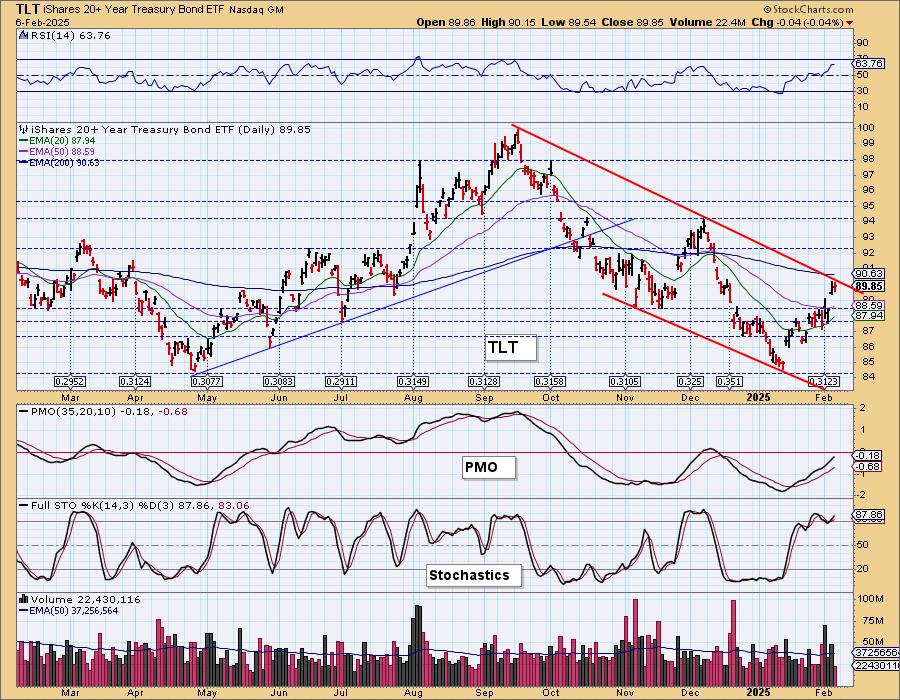
Price is still in a long-term declining trend channel and price is now up against the top. We could see a stutter step at the 200-day EMA.
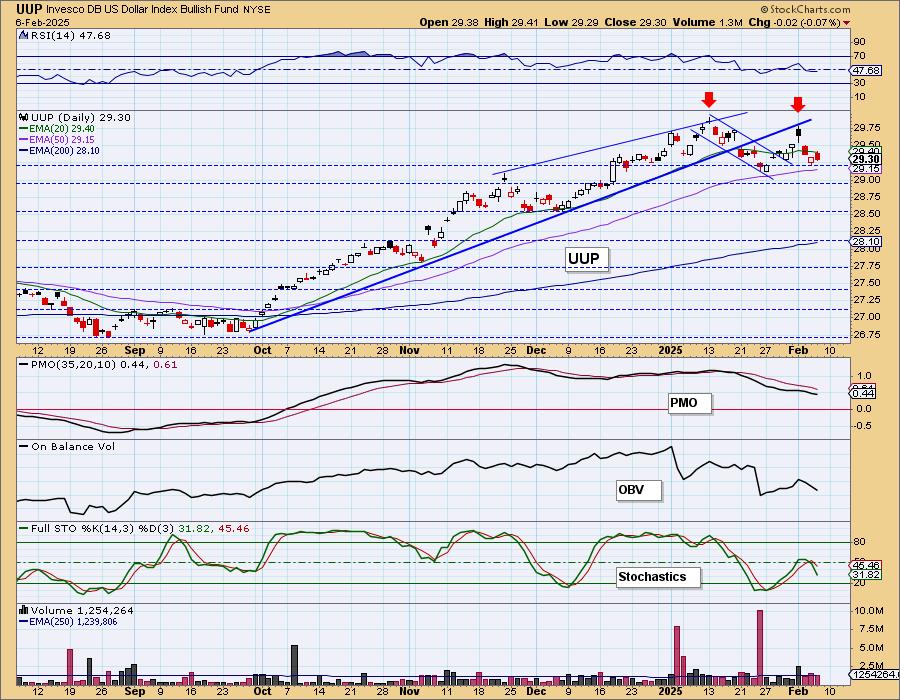
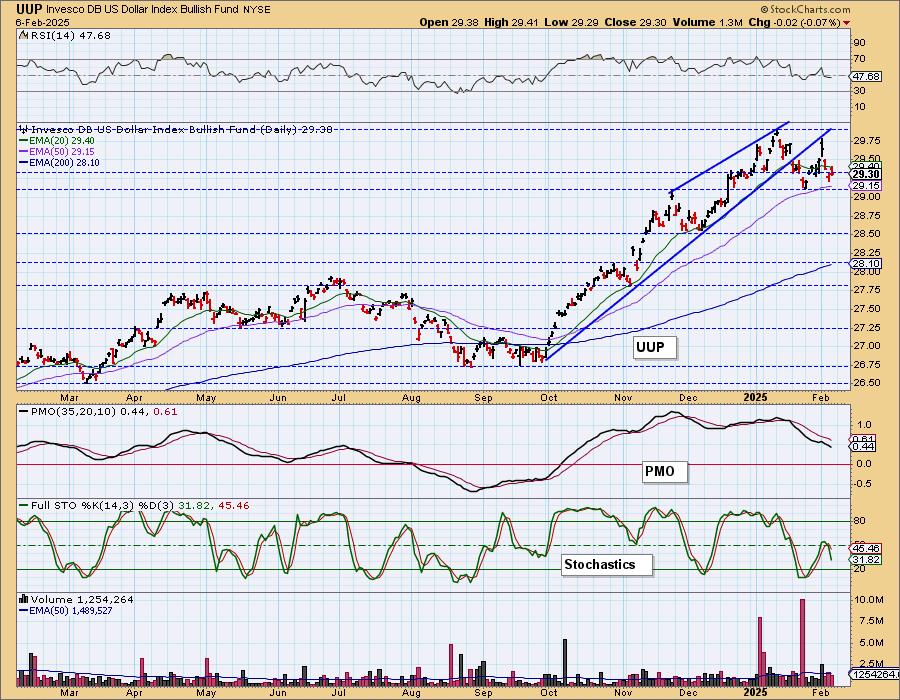
DOLLAR (UUP)
IT Trend Model: BUY as of 10/9/2024
LT Trend Model: BUY as of 5/25/2023
UUP Daily Chart: Yesterday's comments still apply:
"It appears we're not going to get any more upside out of the bull flag. We now have a loose double top formation that suggests we'll see downside, not rally. The PMO topped beneath its signal line and the RSI has moved into negative territory. Stochastics have reversed into negative territory below net neutral (50)."
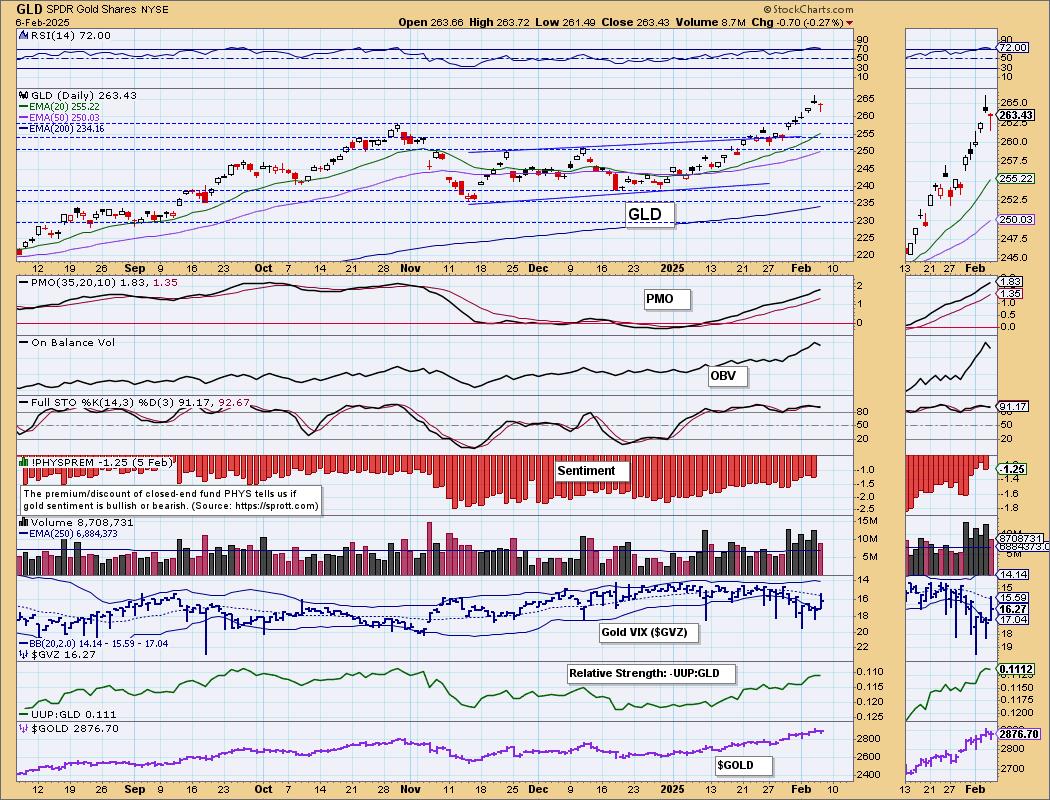
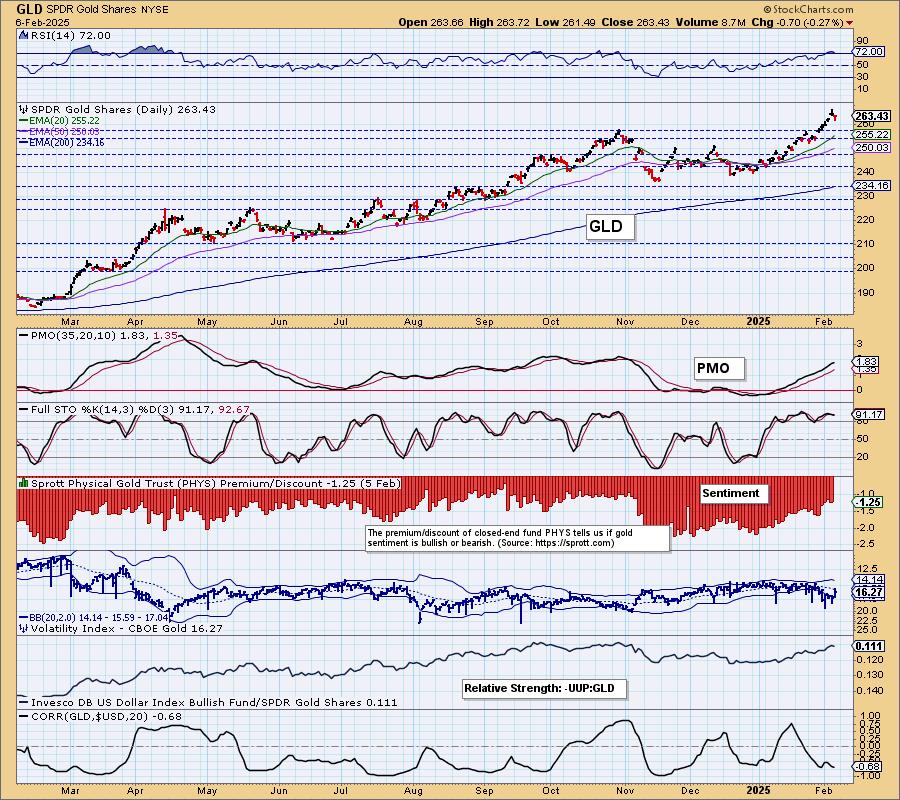
GOLD
IT Trend Model: BUY as of 1/10/2025
LT Trend Model: BUY as of 10/20/2023
GLD Daily Chart: The Dollar was down, but so was Gold. We saw more sellers that discounted the inverse relationship between Gold and the Dollar. We mentioned yesterday that it was time to see a pause in the Gold rally and this may be the beginning of that pause or possibly a small decline. The RSI is overbought and that is what is leading us to believe that the rally could stall here.
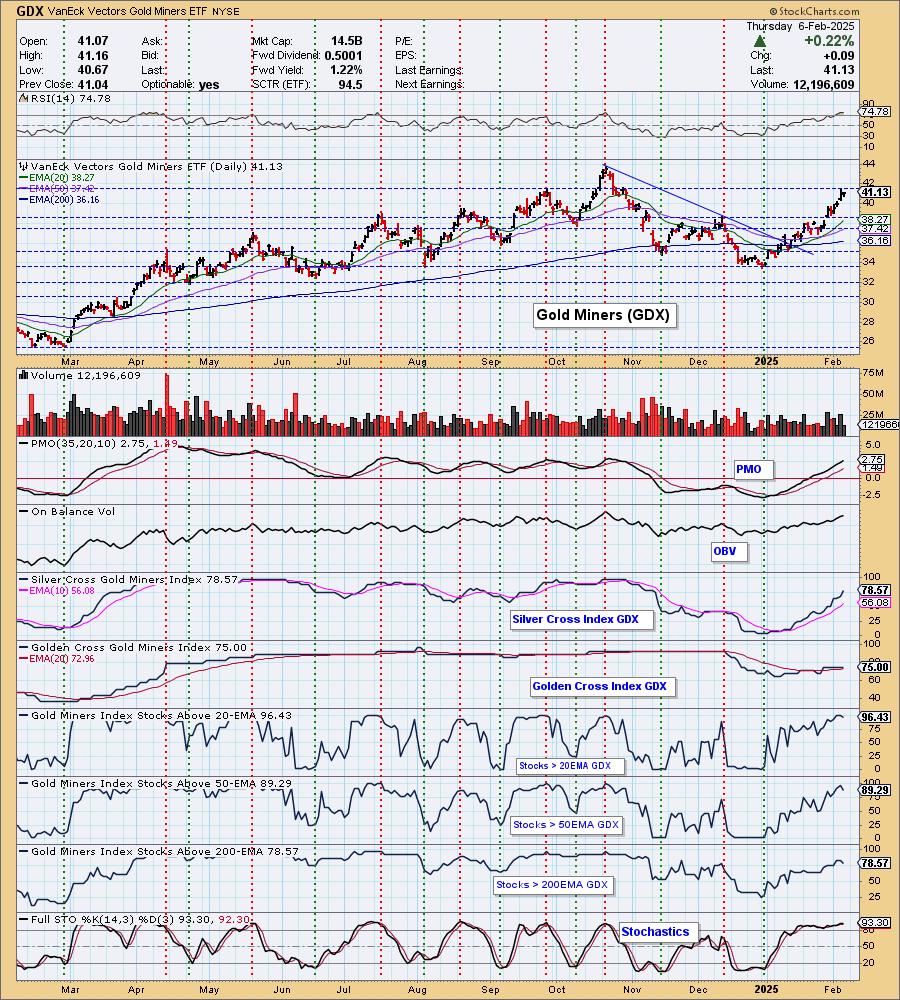
GOLD MINERS (GDX) Daily Chart: Despite a drop in Gold, Gold Miners saw a small rally. They look very bullish but we foresee Gold stalling. That will likely bring GDX back down. Participation did see a slight decline on the rally, but it is still incredibly strong right now. Look for a pause now that we've hit overhead resistance.
CRUDE OIL (USO)
IT Trend Model: BUY as of 12/24/2024
LT Trend Model: BUY as of 1/10/2025
USO Daily Chart: Yesterday's comments still apply:
"Crude is holding support at the November top and the 200-day EMA, but indicators are very negative so we don't expect this level of support to hold. Stochastics topped below 20 which is especially bearish. We could see some consolidation or possibly a small bounce off this level, but any upside isn't likely to catch hold given overall fundamentals of higher production levels on tap by this administration. There will continue to be strong downside pressure applied."
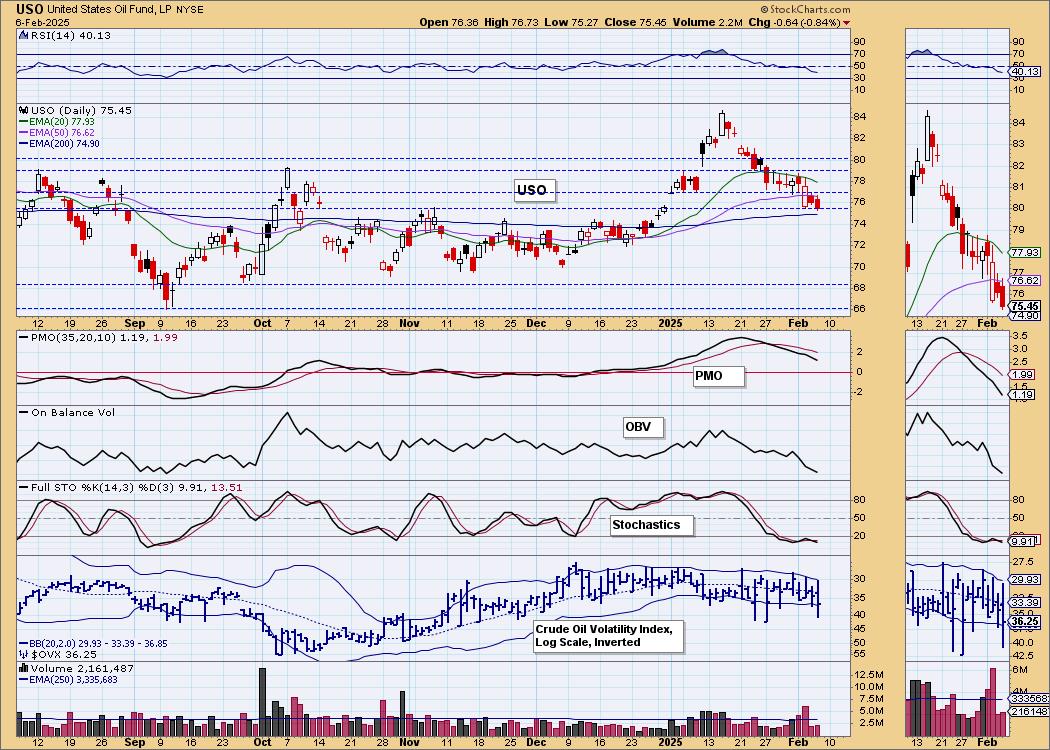
"Price hit the top of a very long-term trading range so it isn't surprising to see the correction. It's time for price to test the bottom of the range and that is where we believe it is ultimately headed."

Good Luck & Good Trading!
Erin Swenlin and Carl Swenlin
Technical Analysis is a windsock, not a crystal ball. --Carl Swenlin
(c) Copyright 2025 DecisionPoint.com
Disclaimer: This blog is for educational purposes only and should not be construed as financial advice. The ideas and strategies should never be used without first assessing your own personal and financial situation, or without consulting a financial professional. Any opinions expressed herein are solely those of the author, and do not in any way represent the views or opinions of any other person or entity.
DecisionPoint is not a registered investment advisor. Investment and trading decisions are solely your responsibility. DecisionPoint newsletters, blogs or website materials should NOT be interpreted as a recommendation or solicitation to buy or sell any security or to take any specific action.
NOTE: The signal status reported herein is based upon mechanical trading model signals, specifically, the DecisionPoint Trend Model. They define the implied bias of the price index based upon moving average relationships, but they do not necessarily call for a specific action. They are information flags that should prompt chart review. Further, they do not call for continuous buying or selling during the life of the signal. For example, a BUY signal will probably (but not necessarily) return the best results if action is taken soon after the signal is generated. Additional opportunities for buying may be found as price zigzags higher, but the trader must look for optimum entry points. Conversely, exit points to preserve gains (or minimize losses) may be evident before the model mechanically closes the signal.
Helpful DecisionPoint Links:
DecisionPoint Alert Chart List
DecisionPoint Golden Cross/Silver Cross Index Chart List
DecisionPoint Sector Chart List
Price Momentum Oscillator (PMO)