
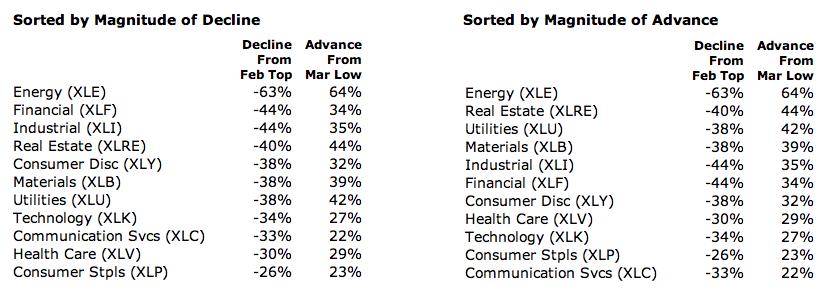
We keep a pretty close watch on sectors, and today I took a rough cut intraday of sector performance from the February tops and from the March lows.

Then I sorted the list based upon the magnitude of the decline into the March lows, and then by the advance to date from those lows. Energy, Financials, Real Estate, and Utilities stand out to me, but they all had notable moves in both directions.
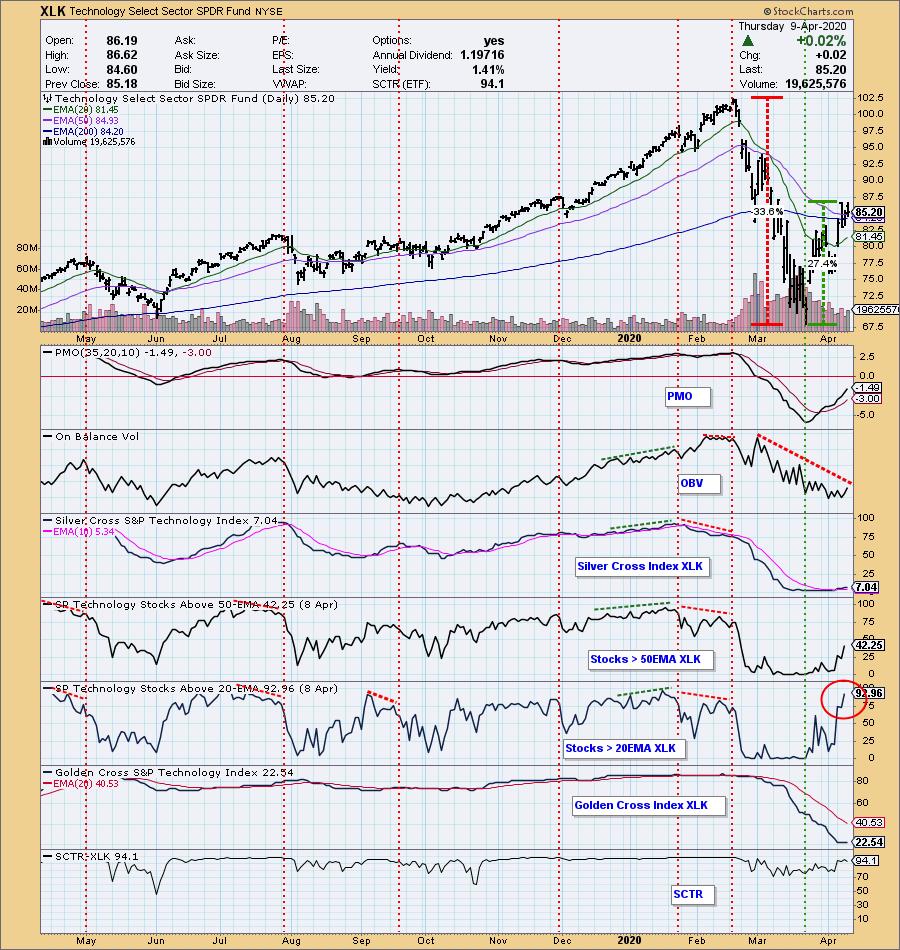
I found the Technology Sector to be particularly interesting because of the rather subdued rally from the lows. This sector has been the primary market mover for years, and it wouldn't be good for it to languish. There are two indicators that stand out to me: (1) the OBV is diverging negatively against the price advance, meaning that the the advance is not pulling in confirming volume; and (2) the percentage of stocks above their 20EMA is just about maxed out, signaling a probable price top very soon.
The DecisionPoint Alert Weekly Wrap presents an end-of-week assessment of the trend and condition of the Stock Market, the U.S. Dollar, Gold, Crude Oil, and Bonds. The DecisionPoint Alert daily report (Monday through Thursday) is abbreviated and gives updates on the Weekly Wrap assessments.
Watch the latest episode of DecisionPoint on StockCharts TV's YouTube channel here!
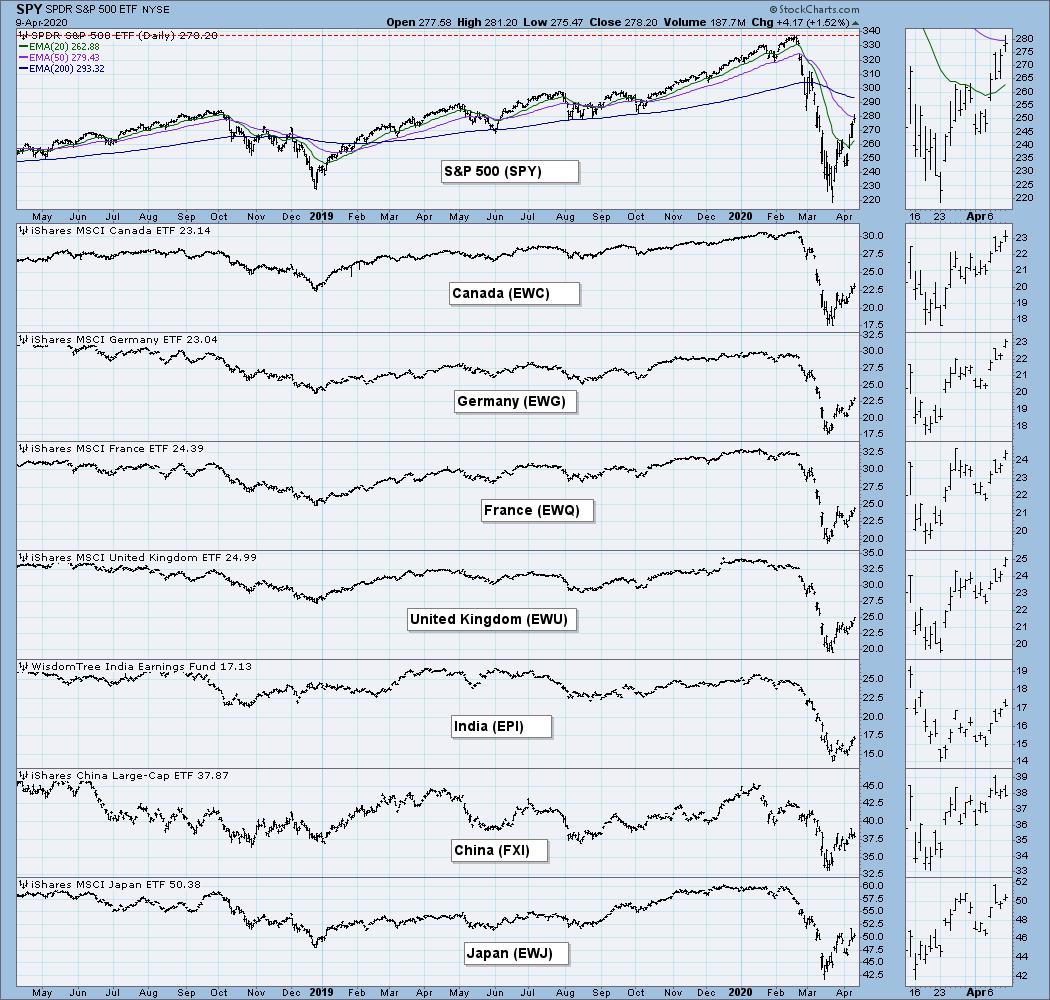
GLOBAL MARKETS
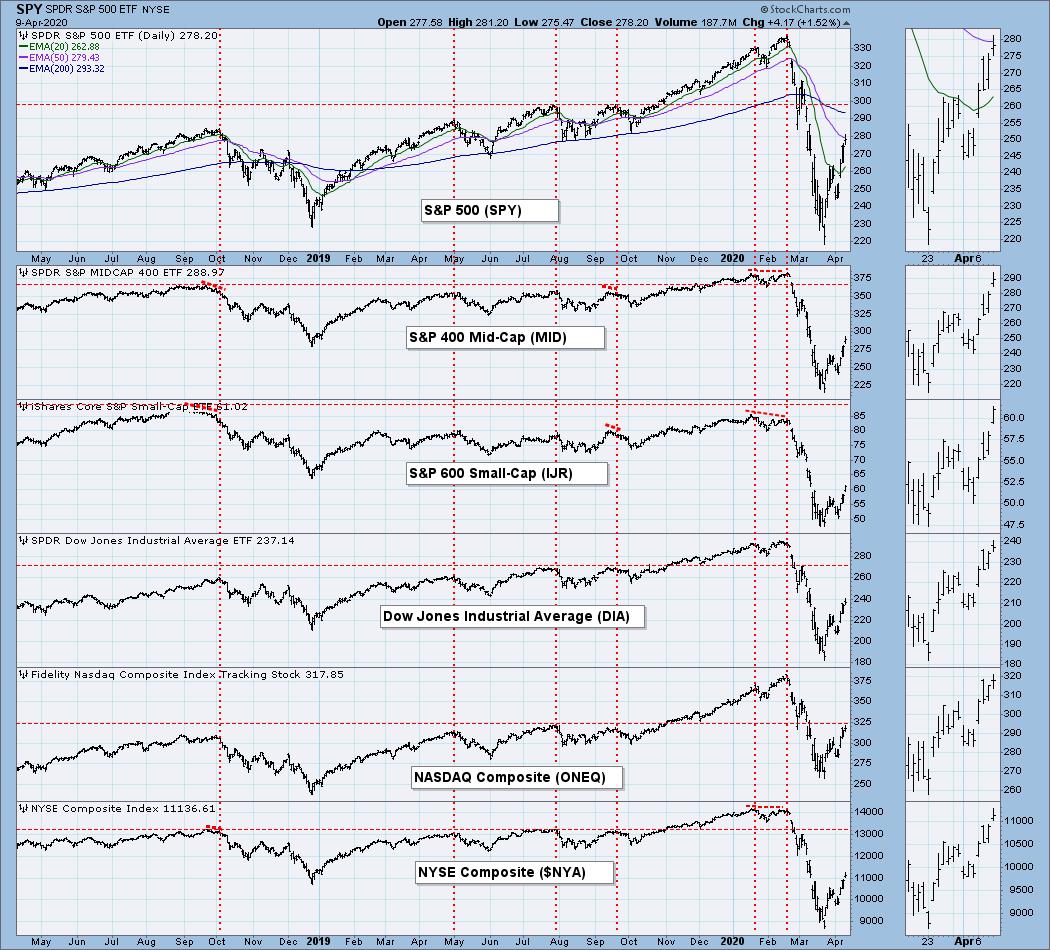
BROAD MARKET INDEXES
SECTORS
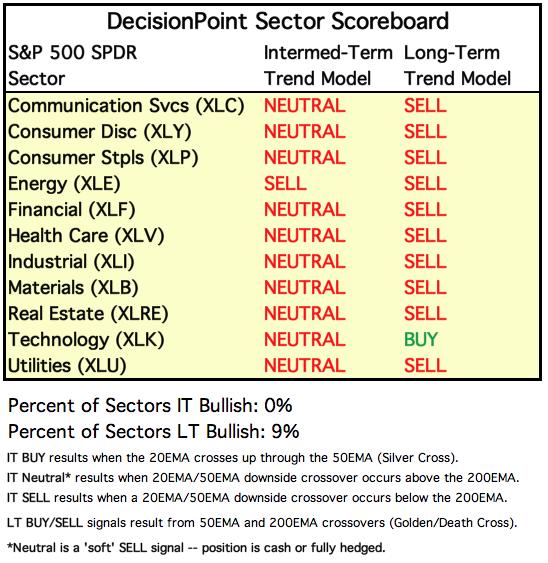
Each S&P 500 Index component stock is assigned to one, and only one, of 11 major sectors. This is a snapshot of the Intermediate-Term (Silver Cross) and Long-Term (Golden Cross) Trend Model signal status for those sectors.
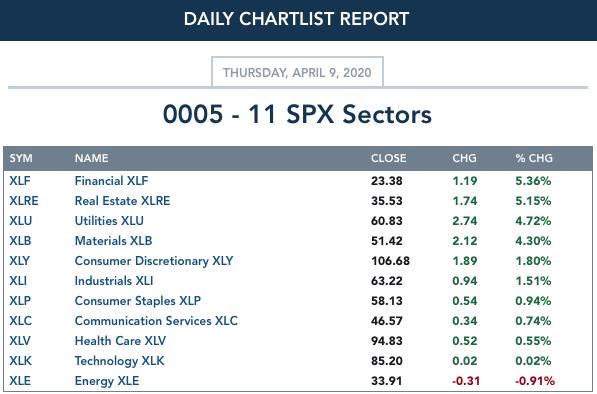
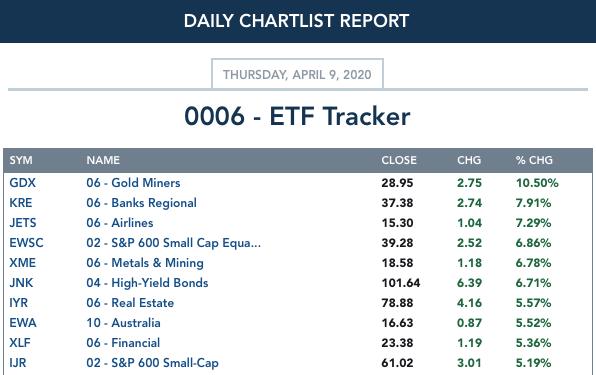
ETF TRACKER: This is a list of about 100 ETFs intended to track a wide range of U.S. market indexes, sectors, global indexes, interest rates, currencies, and commodities. StockCharts.com subscribers can acquire it in the DecisionPoint Trend and Condition ChartPack.
Top 10 . . .
. . . and bottom 10: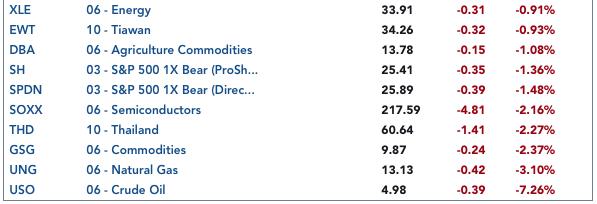
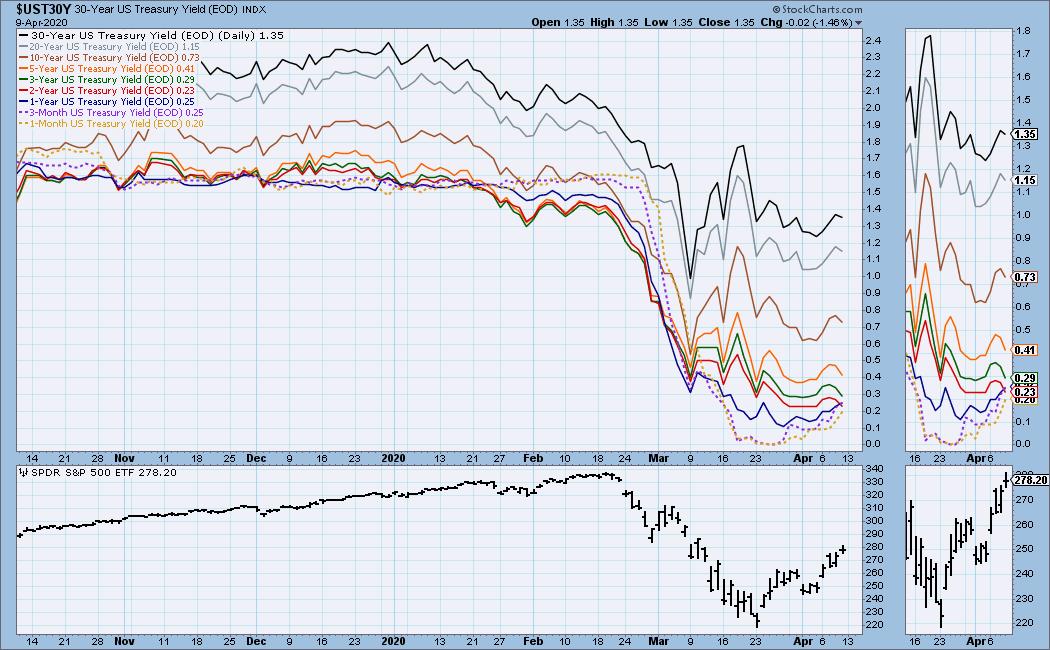
INTEREST RATES
This chart is included so we can monitor rate inversions. In normal circumstances the longer money is borrowed the higher the interest rate that must be paid. When rates are inverted, the reverse is true.
STOCKS
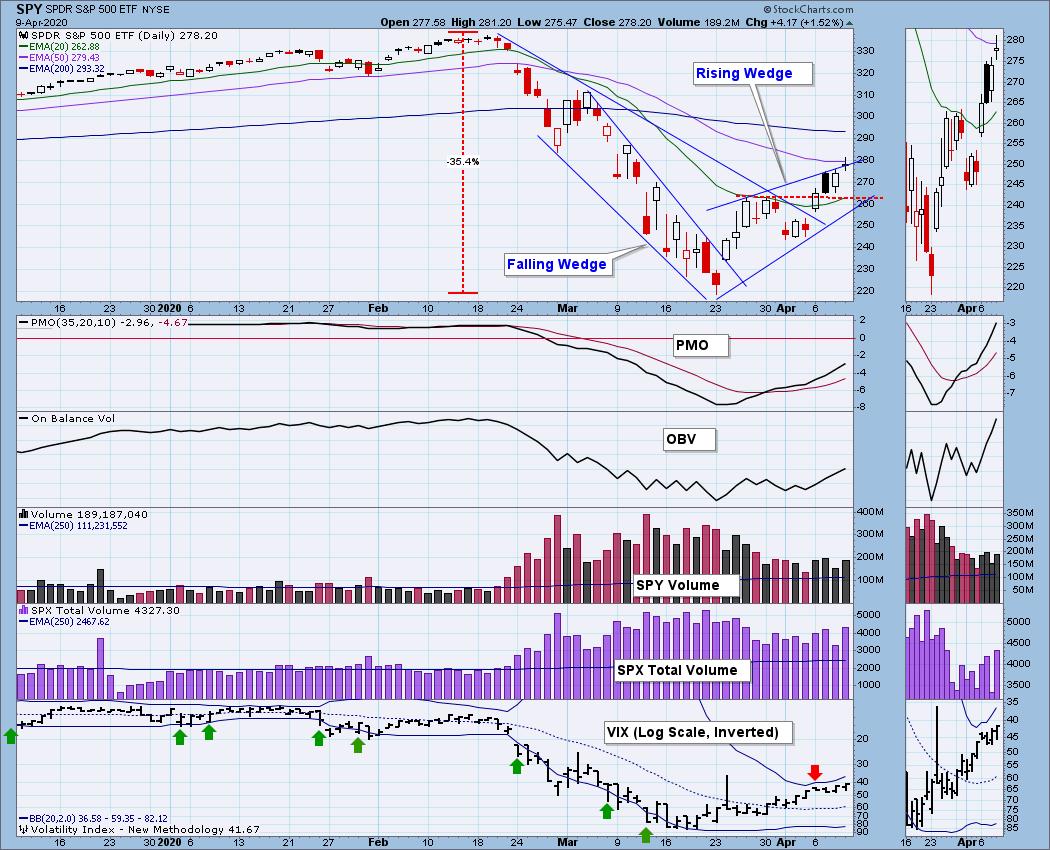
IT Trend Model: NEUTRAL as of 2/28/2020
LT Trend Model: SELL as of 3/19/2020
SPY Daily Chart: A rising wedge is supposed to break downward, but today there was almost an upside breakout. SPX Total Volume continues to be extremely high. I think that the high volume and high volatility tells us that we're still in a bear market.
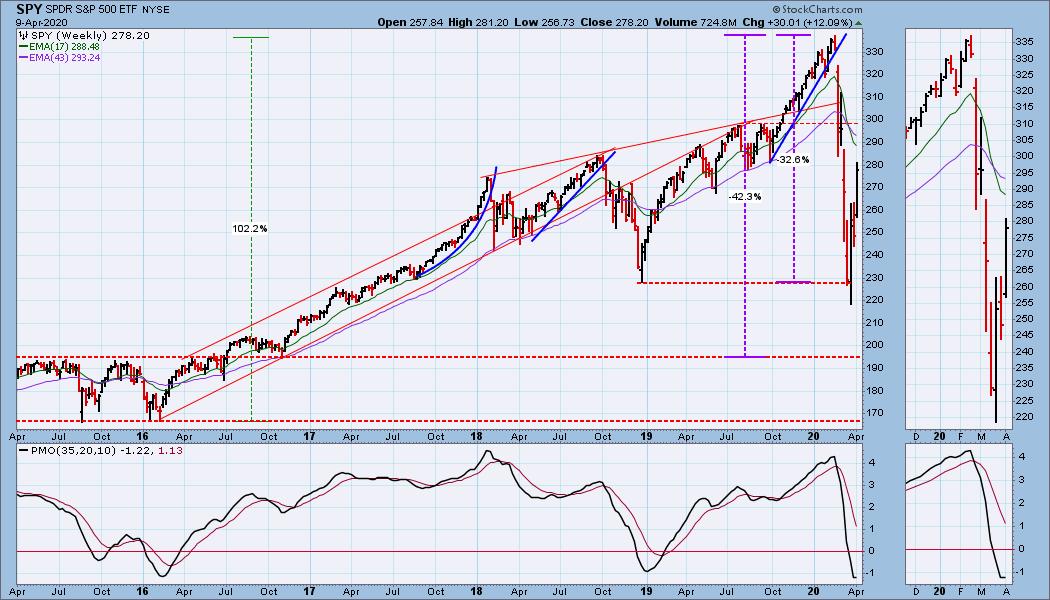
SPY Weekly Chart: SPY has so far made a 50% retracement of the bear market decline, and that positive price action has almost caused the weekly PMO to bottom at the bottom of a 10-year range.
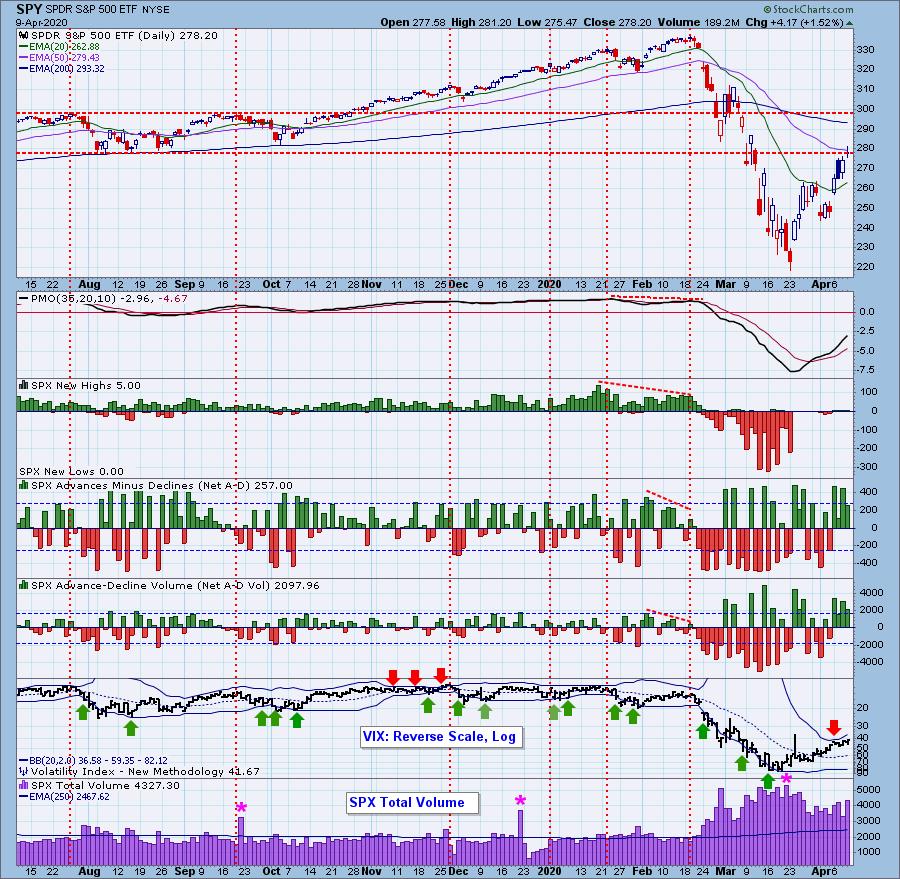
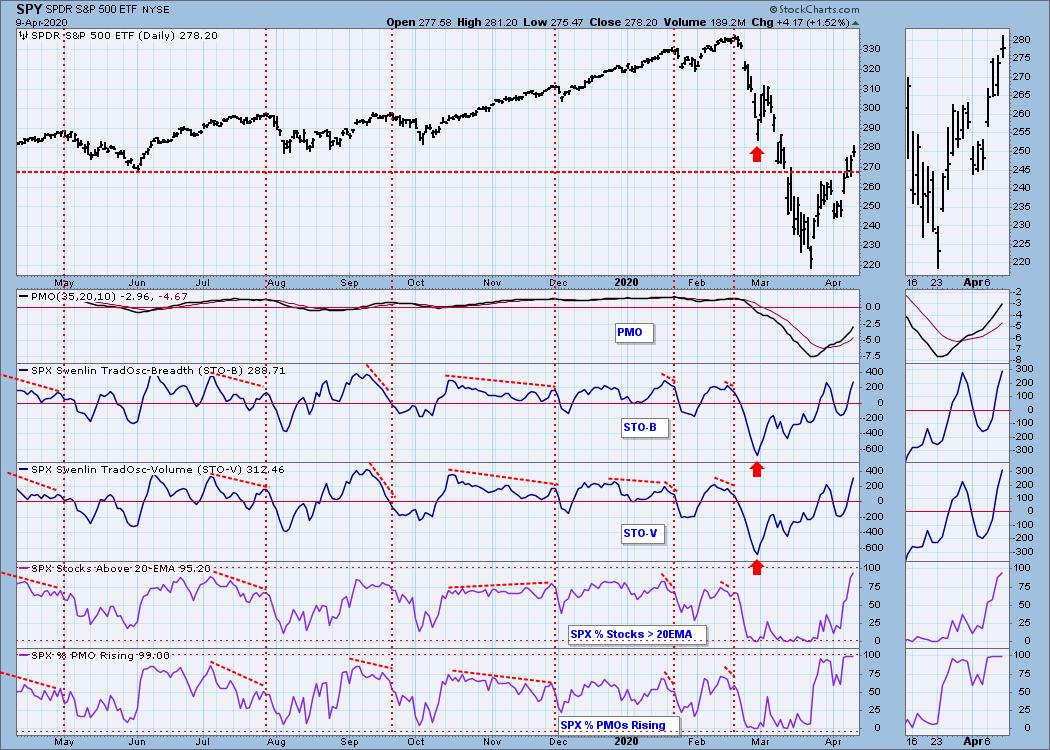
Climactic Market Indicators: There was upside climactic activity every day this week, which confirms the price movement (+12.1% this week), but makes it impossible to differentiate initiation or exhaustion activity. Note that price has hit overhead resistance.
Short-Term Market Indicators: The short-term market trend is UP and the condition is OVERBOUGHT.
Intermediate-Term Market Indicators: On our StockCharts TV show on Monday Erin and I both agreed that the rally off the bear market lows, the pullback, then rally continuation looks very bullish. Note that it is a larger version of the process of completing the 2018 bear market. The Silver/Golden Cross Indexes are very oversold and both have bottomed, which is a good bullish setup.
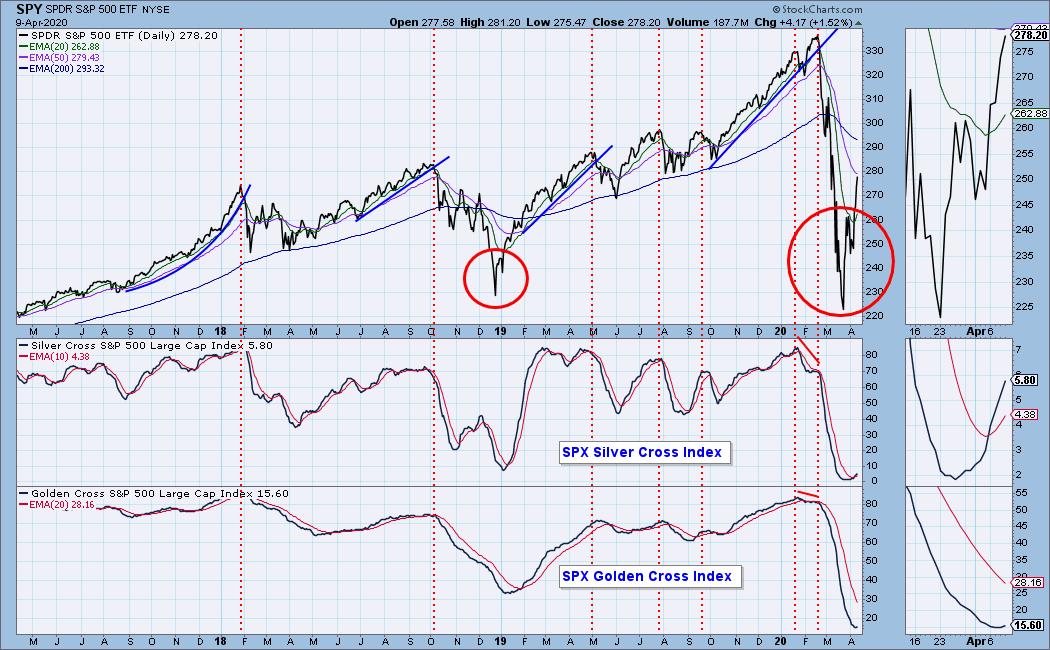
The intermediate-term market trend is UP and the condition is still OVERSOLD.
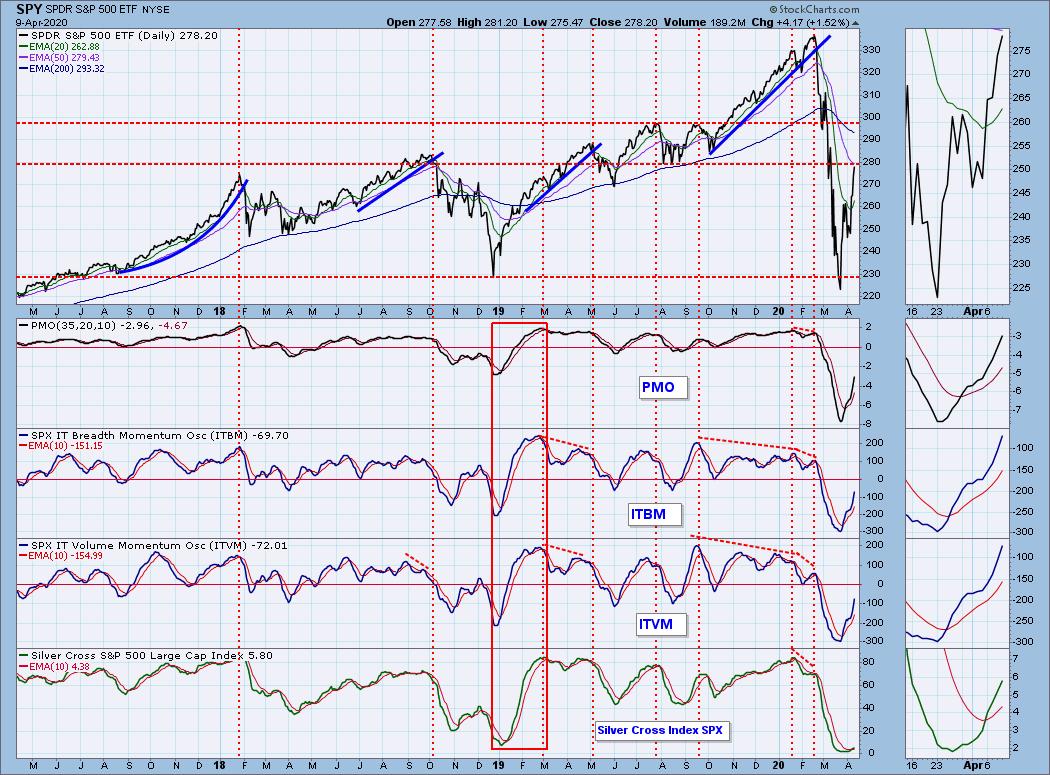
CONCLUSION: The market trend is UP and the market condition is MIXED. The extreme intermediate-term oversold condition has been relieved, but it is still oversold. The short-term condition is overbought, and we are in a bear market, so both overbought and oversold conditions present danger. I think the short-term overbought condition will be the most immediate issue with which the market will have to deal, meaning that we should see a pullback very soon. I expect that next week will be a down week.
As usual the public and Wall Street are using "single-entry accounting" regarding the rescue efforts. Free money! What could go wrong? Double-entry accounting requires that a cash infusion have an offsetting counter entry. For example, a cash deposit (asset) does not improve the balance sheet, if the cash comes from a loan (liability). And, boy, are we piling up the liabilities. This will probably have a negative effect on the dollar and give gold a boost.
Regarding COVID-19, "sheltering in place" has "flattened the curve" and bought some time to evaluate options, but by my calculations, trying to get the economy back to normal is just going to turn the curve back up. Maybe that is the only choice. We can't remain in bunkers indefinitely, and we can't save every life, a grim reality for someone in my age group. For sure, people have learned a lot about priorities, and starting now virtually everyone will have a list: "THINGS I DON'T WANT TO RUN OUT OF."
Have you subscribed the DecisionPoint Diamonds yet? DP does the work for you by providing handpicked stocks/ETFs from exclusive DP scans! Add it with a discount! Contact support@decisionpoint.com for more information!
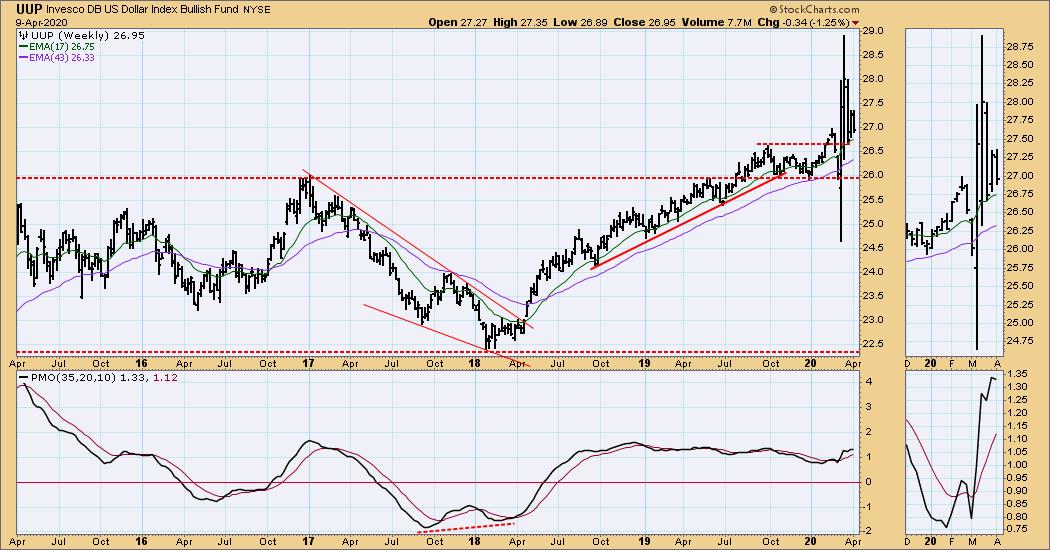
DOLLAR (UUP)
IT Trend Model: BUY as of 3/13/2020
LT Trend Model: BUY as of 5/25/2018
UUP Daily Chart: There was a lower price top this week, and the daily PMO topped below the signal line. This suggests lower prices for UUP.
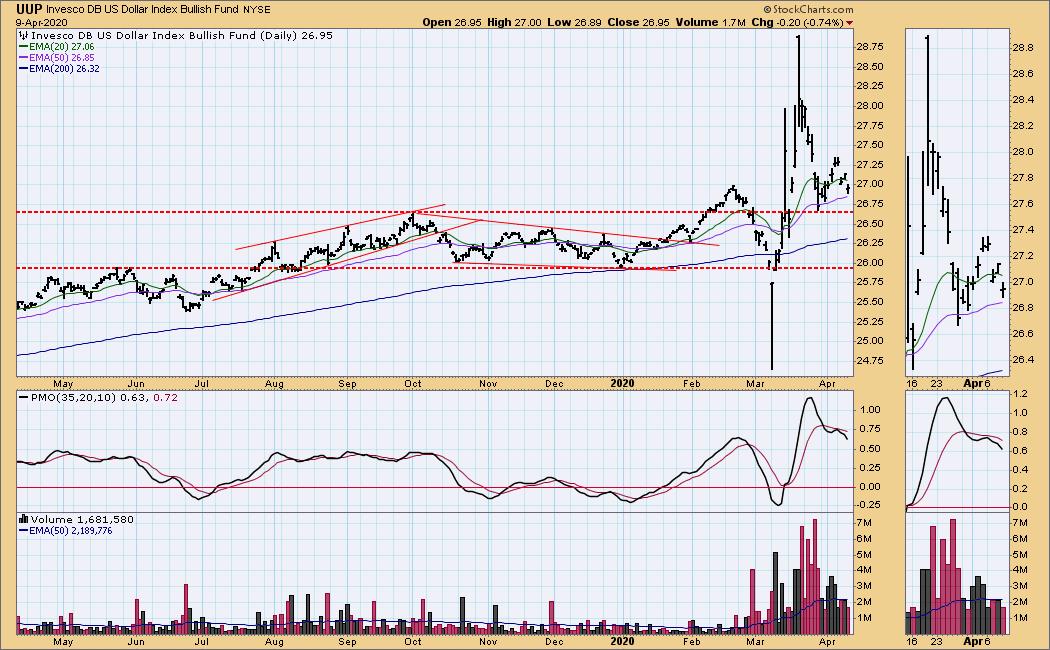
UUP Weekly Chart: The weekly PMO has topped again.
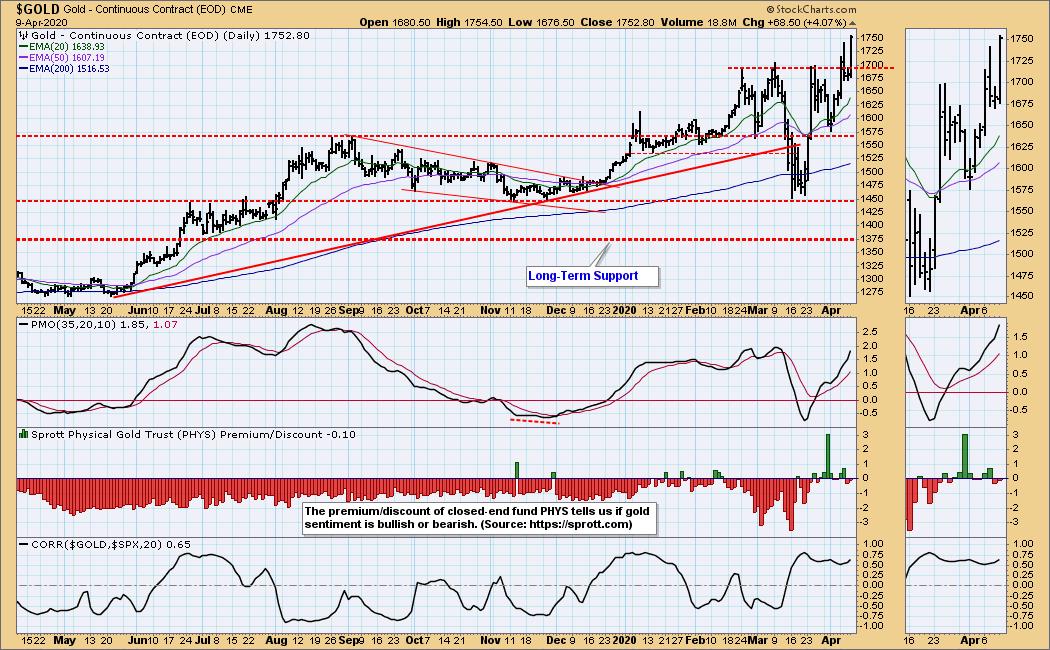
GOLD
IT Trend Model: BUY as of 12/26/2019
LT Trend Model: BUY as of 1/8/2019
GOLD Daily Chart: There were two failed breakout attempts this week, but the third time was charmed as a decisive (+3.3%) breakout was accomplished on Thursday.
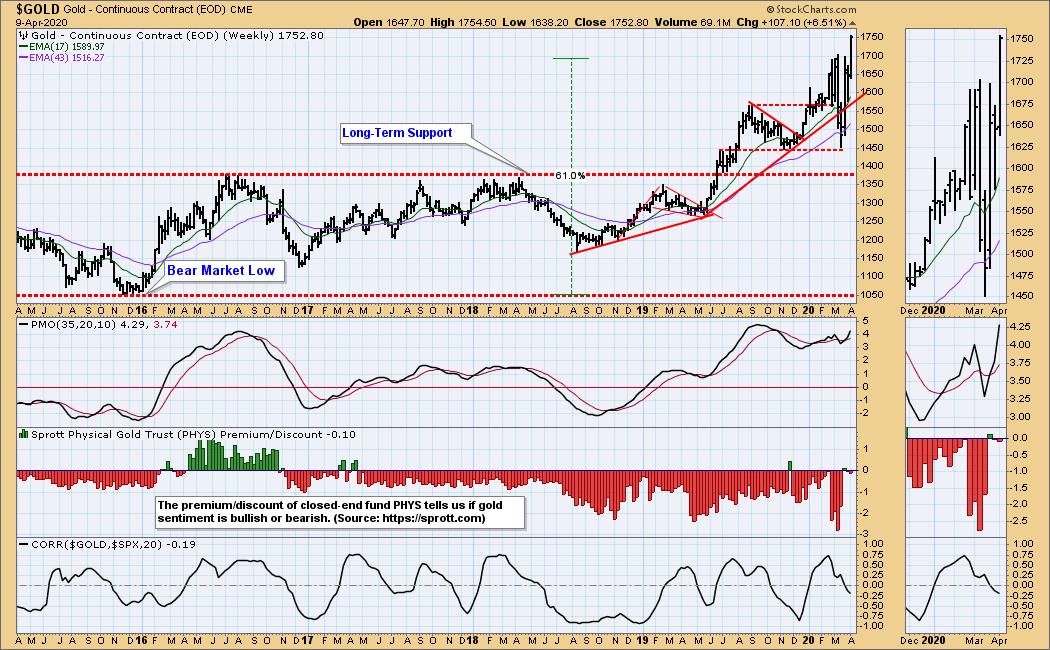
GOLD Weekly Chart: The weekly PMO has been twitchy the last few months, but the good thing is that it is positive and has been relatively flat since the middle of ast year.
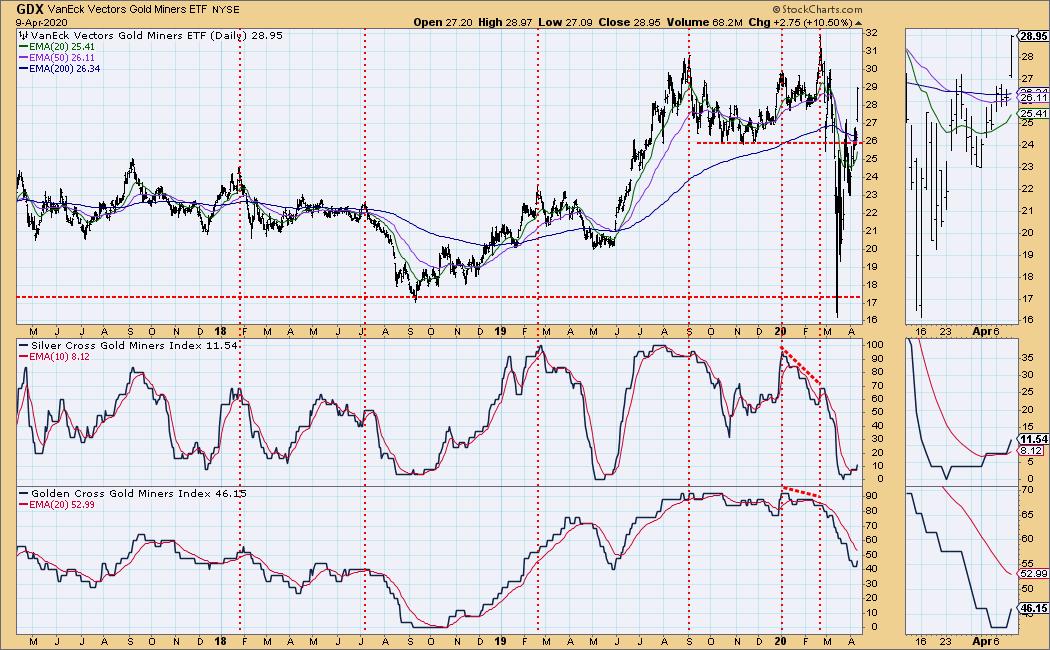
GOLD MINERS Golden and Silver Cross Indexes: Mining stocks got a big boost on Thursday. The Silver Cross Index continues to rise, and the Golden Cross Index has bottomed.
CRUDE OIL (USO)
IT Trend Model: NEUTRAL as of 1/27/2020
LT Trend Model: SELL as of 2/3/2020
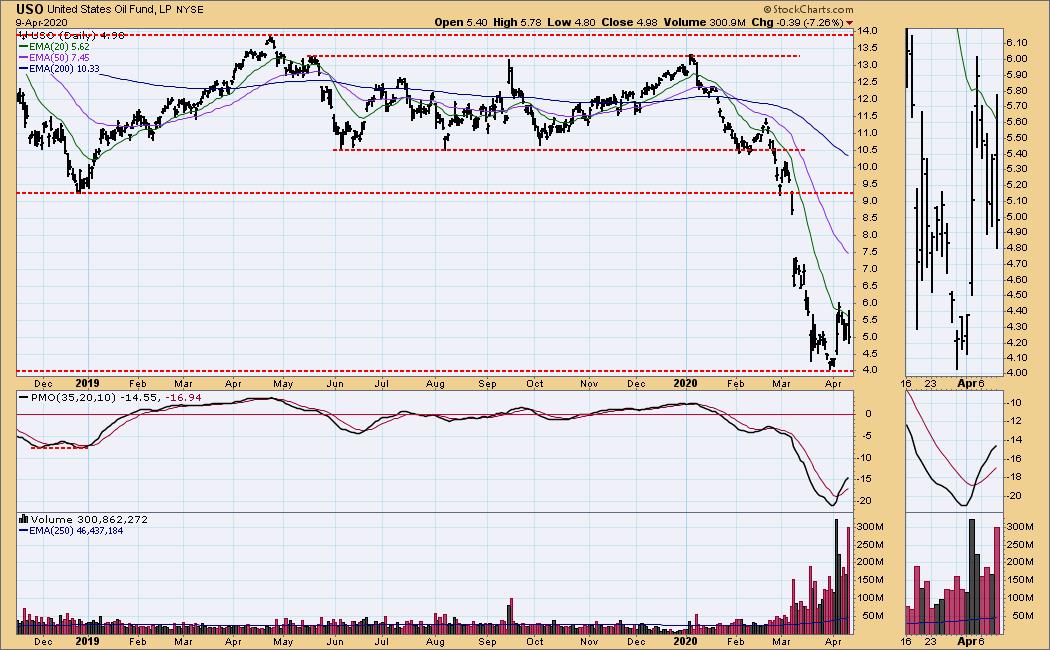
USO Daily Chart: Political machinations continue to influence crude prices, but the thing to remember is that there is a demand problem in the oil market, not a supply problem. When the economy finally gets back to normal, there will still be a demand problem.
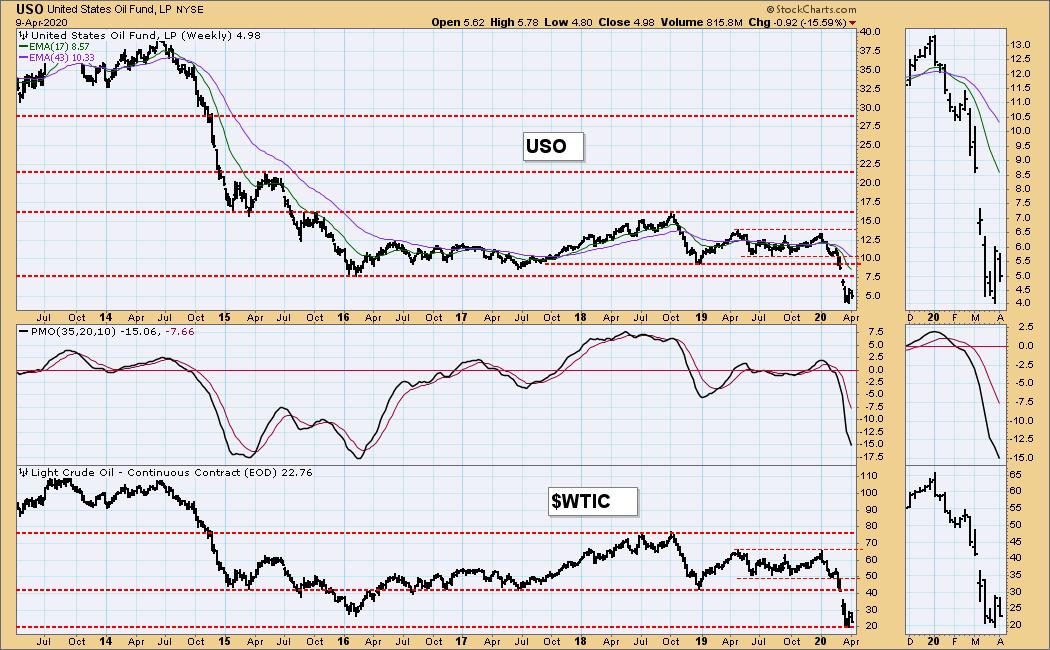
USO Weekly Chart: The most recent support for WTIC is $20. I'm not confident that is going to hold.
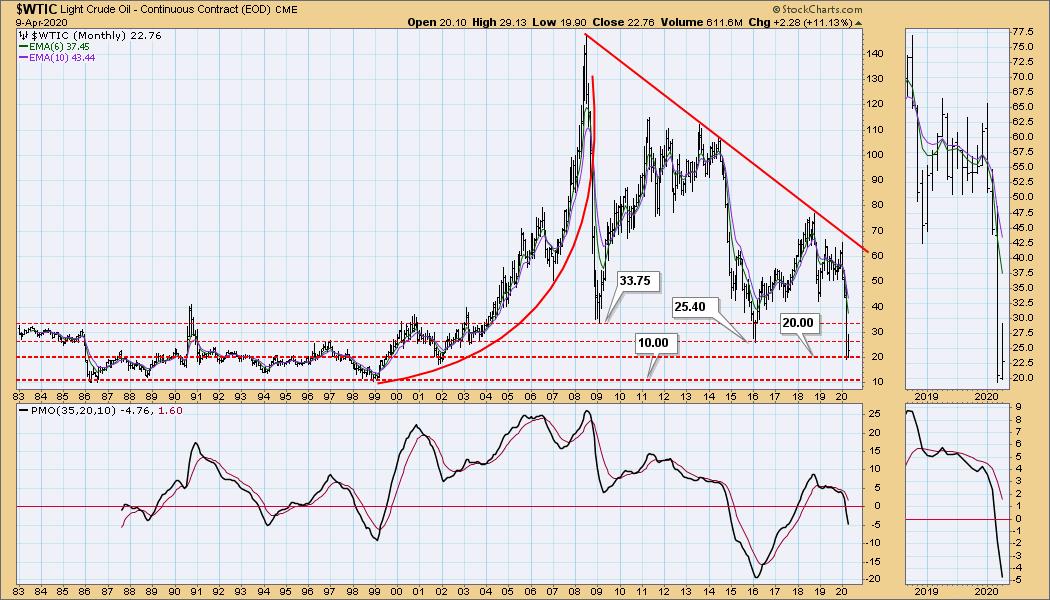
WTIC Monthly Chart: I include this monthly chart to remind us of significant long-term support and resistance.
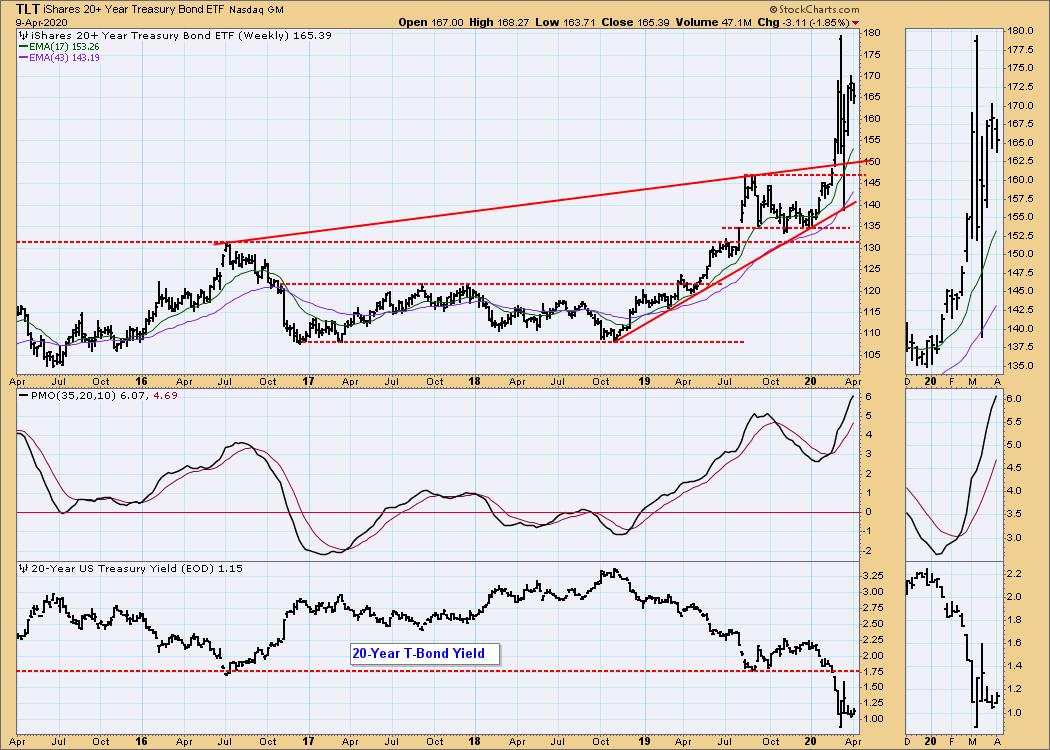
BONDS (TLT)
IT Trend Model: BUY as of 1/22/2020
LT Trend Model: BUY as of 1/2/2019
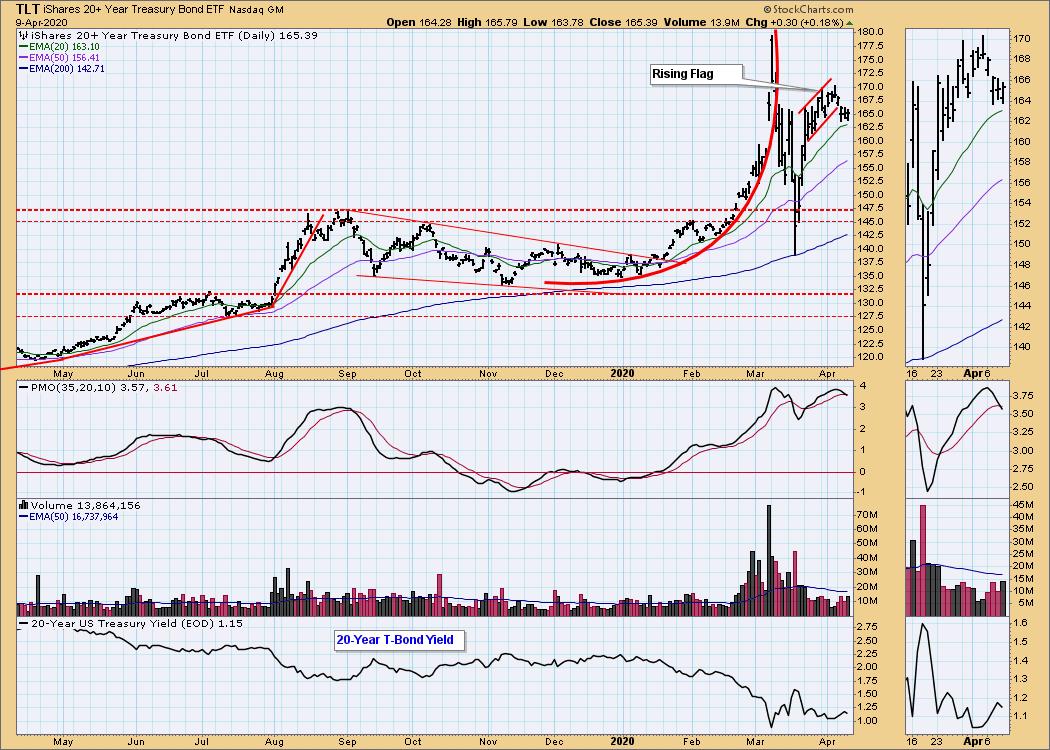
TLT Daily Chart: The rising flag broke down, and the double top on the daily PMO implies lower prices to come.
TLT Weekly Chart: Bonds are very overbought in this time frame, and some pullback is called for.
Technical Analysis is a windsock, not a crystal ball.
Happy Charting! - Carl
NOTE: The signal status reported herein is based upon mechanical trading model signals, specifically, the DecisionPoint Trend Model. They define the implied bias of the price index based upon moving average relationships, but they do not necessarily call for a specific action. They are information flags that should prompt chart review. Further, they do not call for continuous buying or selling during the life of the signal. For example, a BUY signal will probably (but not necessarily) return the best results if action is taken soon after the signal is generated. Additional opportunities for buying may be found as price zigzags higher, but the trader must look for optimum entry points. Conversely, exit points to preserve gains (or minimize losses) may be evident before the model mechanically closes the signal.
Helpful DecisionPoint Links:
DecisionPoint Alert Chart List
DecisionPoint Golden Cross/Silver Cross Index Chart List
DecisionPoint Sector Chart List
Price Momentum Oscillator (PMO)
Swenlin Trading Oscillators (STO-B and STO-V)