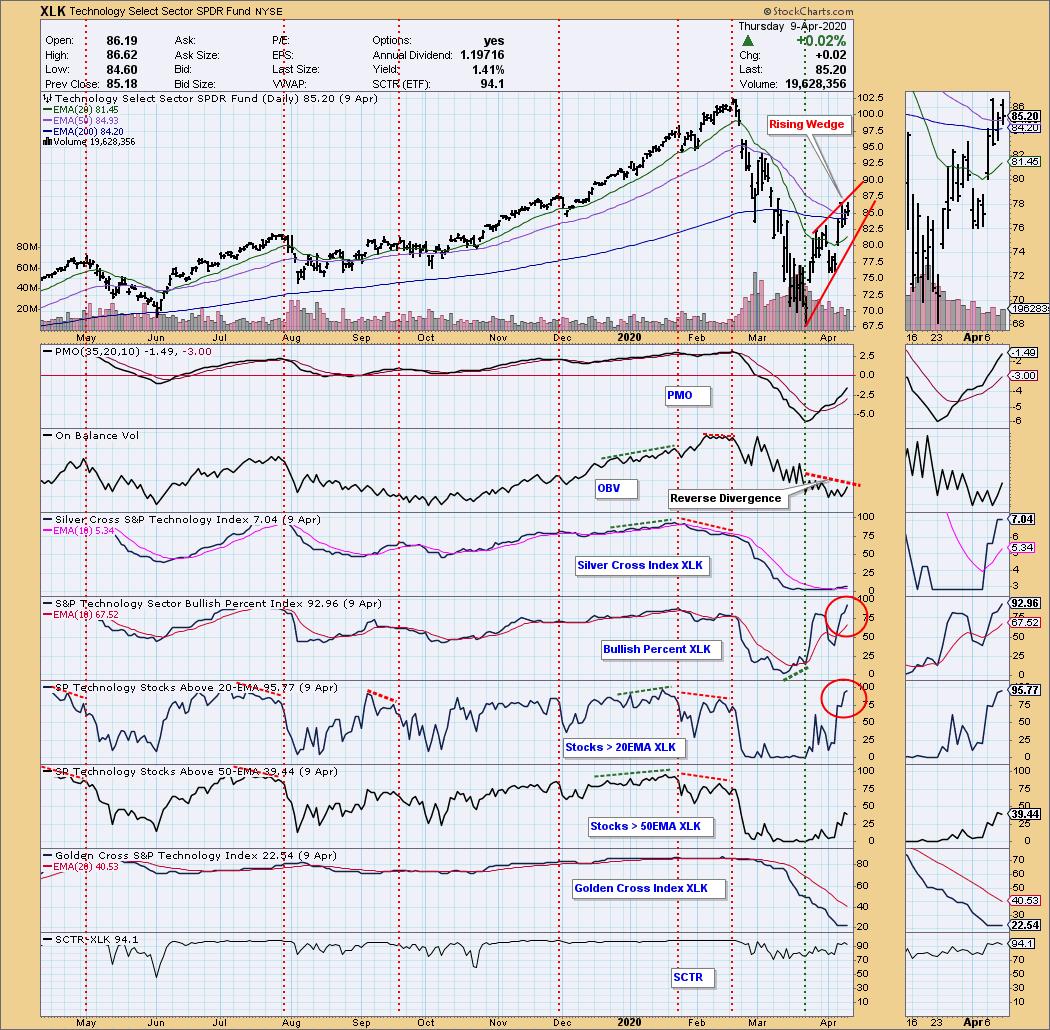
I was awakened very early this morning by the realization that in Thursday's DP Weekly Wrap I had made an error in my assessment of the Technology Sector (XLK) chart. I referred to the downward slope of OBV versus the price rally from the March low as being a negative divergence. It is actually a reverse divergence, which is a positive sign, because it shows that the negative volume flow has been unable to drag price down. Nevertheless, there are still some negative issues on the chart. Price has moved up into a bearish rising wedge, and the Bullish Percent and Silver Cross Indexes are at the top of their ranges, all of which raises the expectation of a price top.

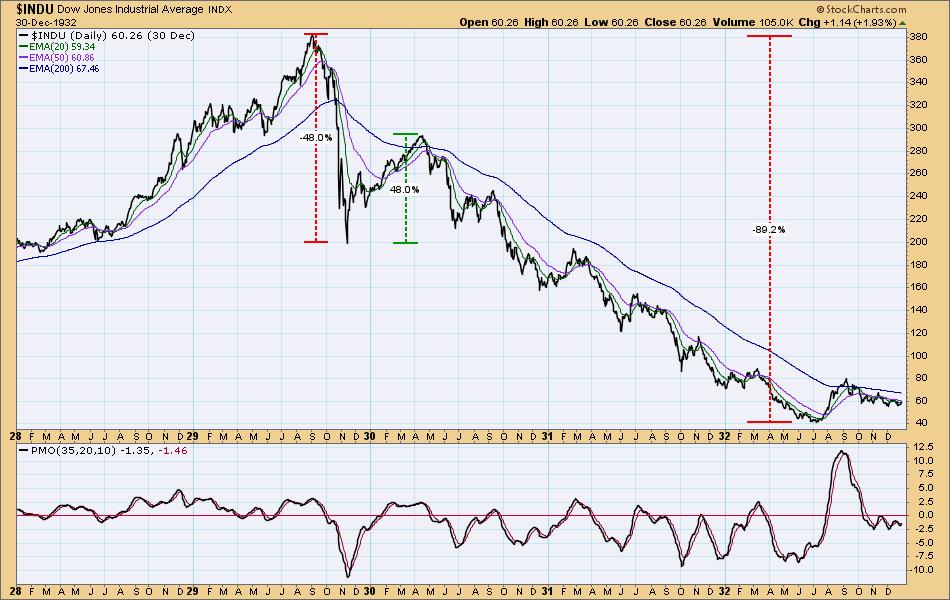
There is also the issue of whether or not we are in a bull market. The S&P 500 (SPY) has rallied +25% from the March low, and by definition that is at least a cyclical bull market. Perhaps we should be open to the possibility that, at a minimum, Bear Market Rules may not be in effect for the time being. For example, from the 1929 low, the market rallied +48%. That didn't change the ultimate outcome, but things looked pretty good for a while.

CONCLUSION: While my original bearish OBV assessment for XLK should have been bullish, I have identified other bearish signs that leave the overall message of the chart no less negative. Conversely, the size of the current rally puts us in the realm of a bull market, so perhaps we should dial back our expectations of negative outcomes just a bit.
Technical Analysis is a windsock, not a crystal ball.
Helpful DecisionPoint Links:
DecisionPoint Alert Chart List
DecisionPoint Golden Cross/Silver Cross Index Chart List
DecisionPoint Sector Chart List
Price Momentum Oscillator (PMO)
Swenlin Trading Oscillators (STO-B and STO-V)