
One of the charts I review before writing the DPA is the one below of the broad market price charts. It was very bullish to see both the S&P 400 and S&P 600 breaking out of their declining trends to join the large-caps' rallies. They began topping a few days before the SPY. This is one of those 'under the surface' issues you should be aware of.
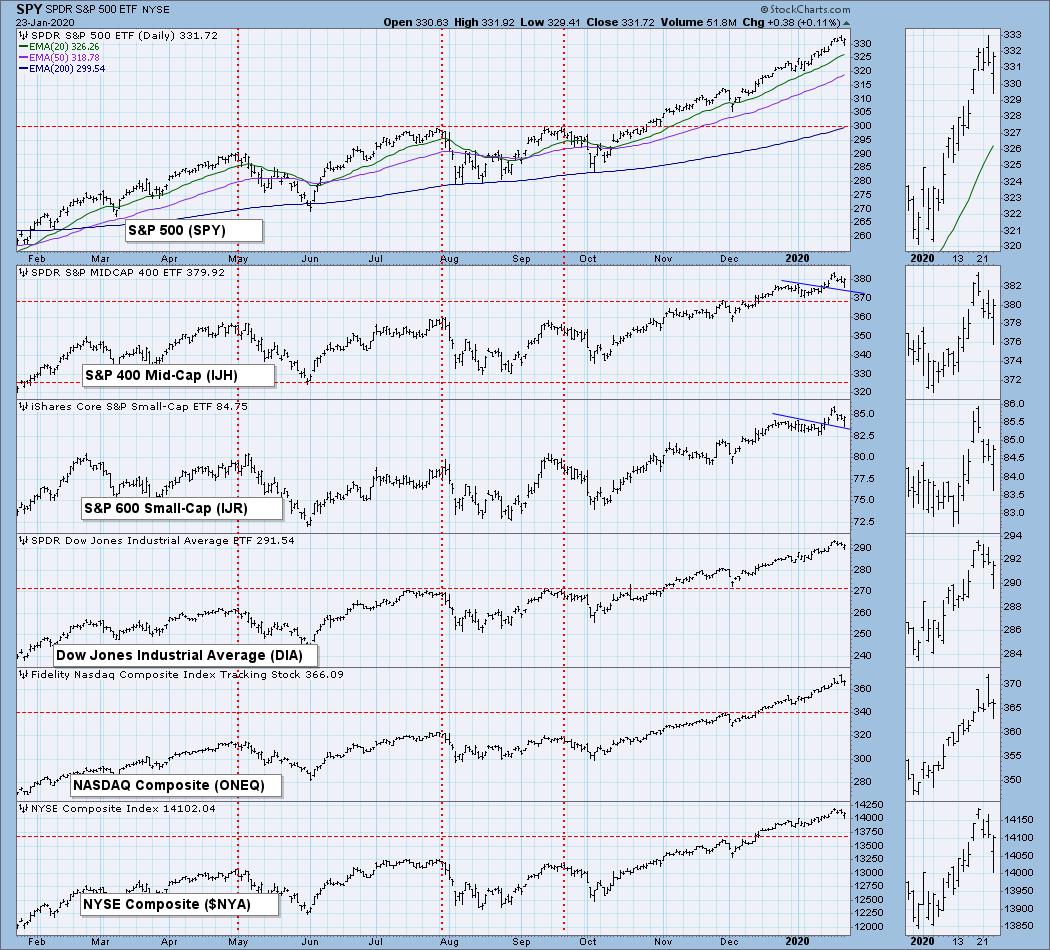
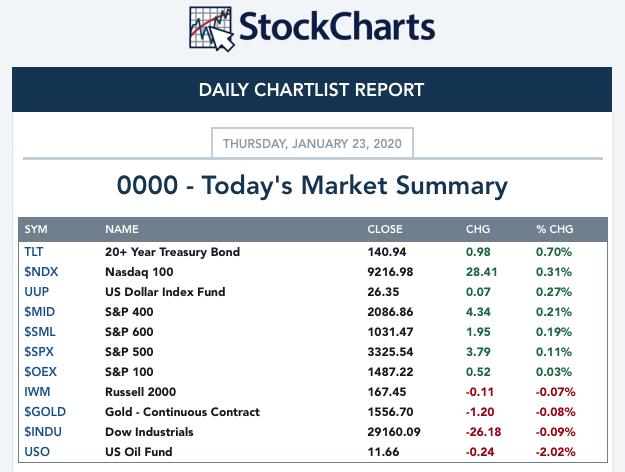
TODAY'S Broad Market Action:
The DecisionPoint Alert Weekly Wrap presents an end-of-week assessment of the trend and condition of the stock market (S&P 500), the U.S. Dollar, Gold, Crude Oil, and Bonds. Monday through Thursday the DecisionPoint Alert daily report is abbreviated and covers changes for the day.
Watch the latest episode of DecisionPoint on StockCharts TV's YouTube channel here!
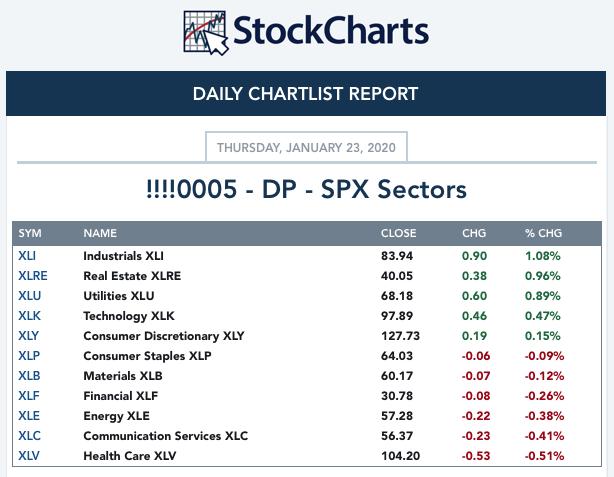
SECTORS
SIGNALS:
Each S&P 500 Index component stock is assigned to one, and only one, of 11 major sectors. This is a snapshot of the Intermediate-Term (Silver Cross) and Long-Term (Golden Cross) Trend Model signal status for those sectors.
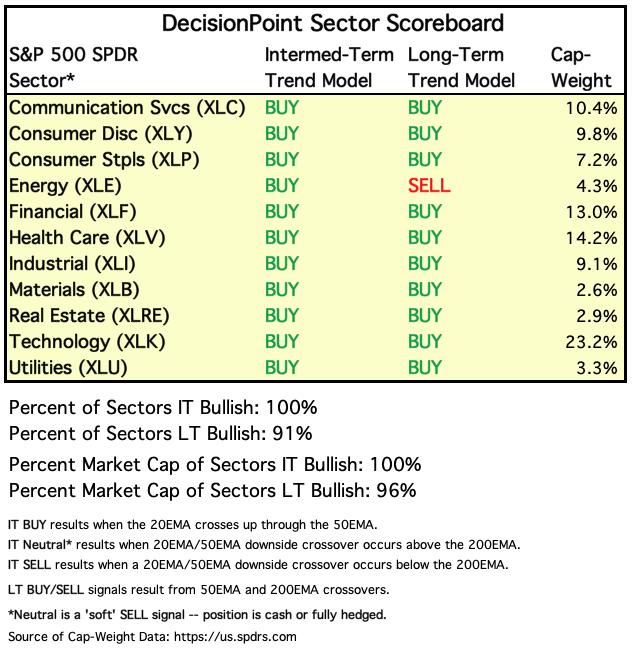
TODAY'S RESULTS:
STOCKS
IT Trend Model: BUY as of 9/6/2019
LT Trend Model: BUY as of 2/26/2019
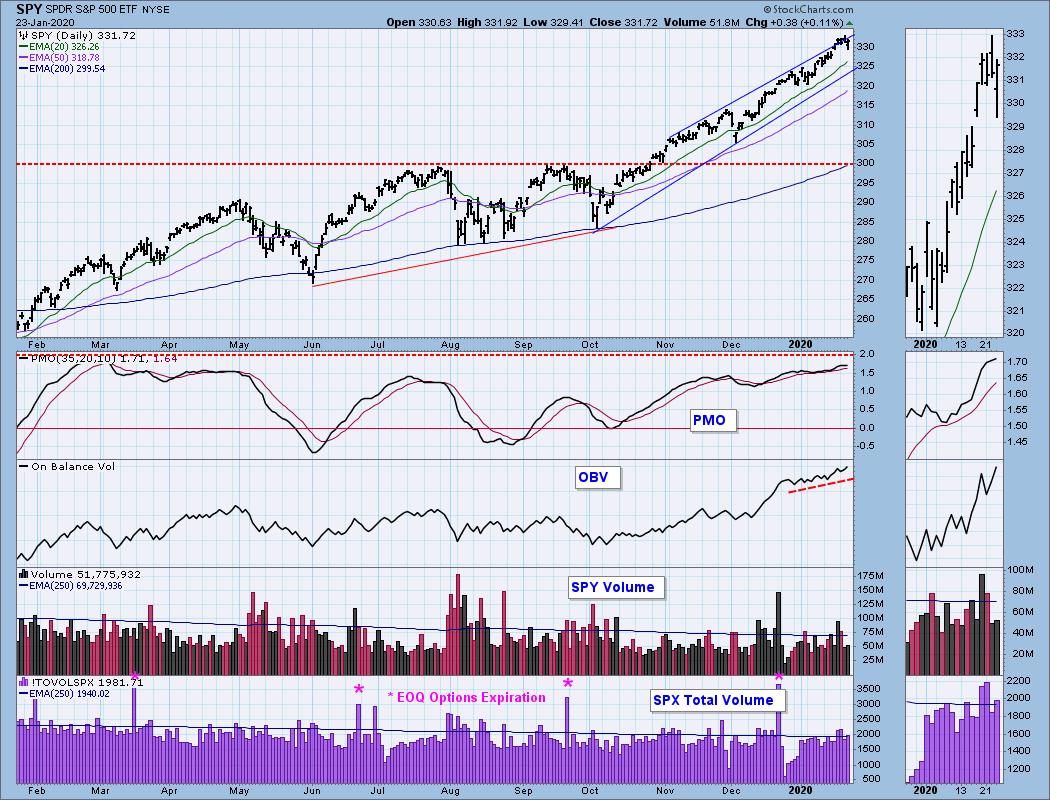
SPY Daily Chart: It appeared we may be forming a rising trend channel versus the bearish rising wedge, but when I did the "click and drag" on the rising bottoms trendline, it didn't match up. For now I'm keeping the original wedge. The PMO is decelerating and we have what could be a reverse island formation. These are typically short-term chart patterns that suggest a closure of the original gap. However, we've see those gaps pose as support. The OBV set a higher high today so the decrease in volume isn't damaging those technicals.
Climactic Market Indicators: New Highs are pulling back which is not bullish for the market. The other readings aren't telling us anything. The VIX is in the middle of a squeeze in the Bollinger Bands. It won't be useful until we see those bands expand, which unfortunately comes with wild moves on the inverted VIX. Readings are so low on the VIX, I would expect the volatility in the Band to move expand downward. Higher VIX readings mean scared money that generally sits on the sidelines or is moved to the sidelines. Either way, not positive for the market.
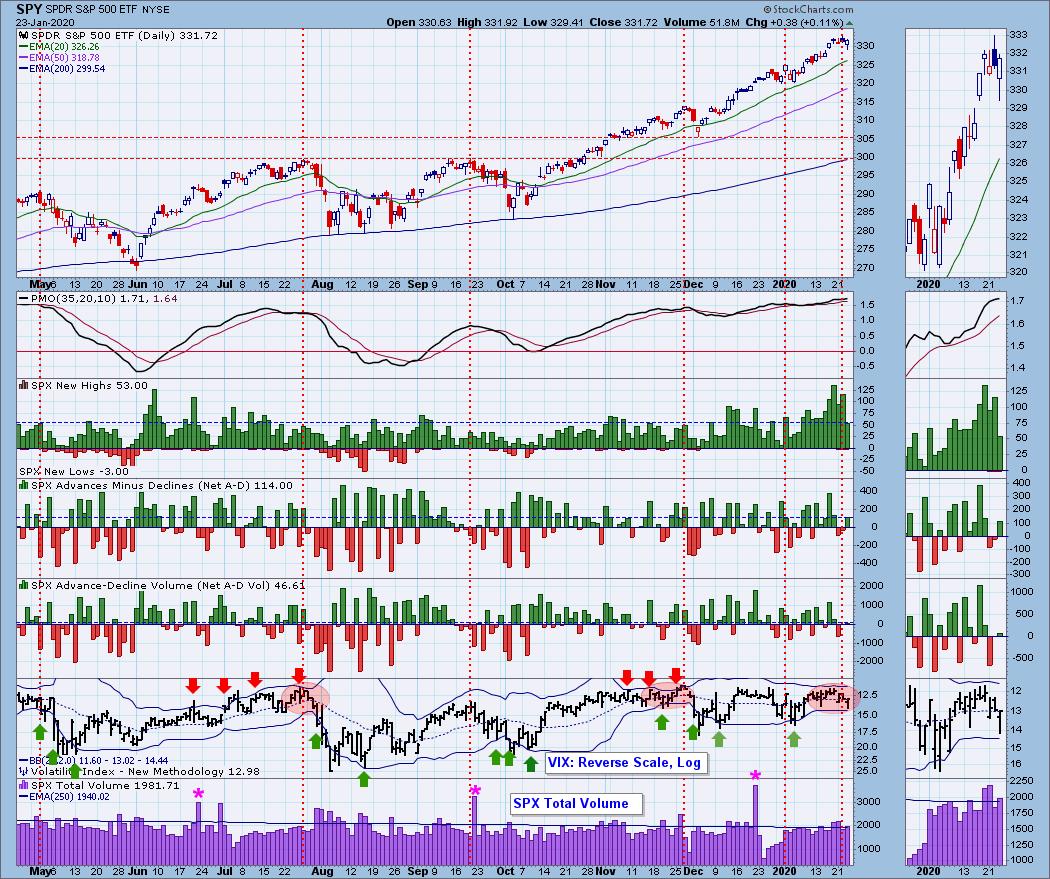
Short-Term Market Indicators: They are declining and except for the STO-B, are in a negative divergence with price tops.

Intermediate-Term Market Indicators: The continued divergence between the ITBM and ITVM is very unusual. I've been trying to look back and see when they completely traveled for any length of time in opposite directions. The closest I came was in the divergence before the 2018 correction. I'm saying we will see a drop of that proportion, but it certainly puts a negative spin on this chart.
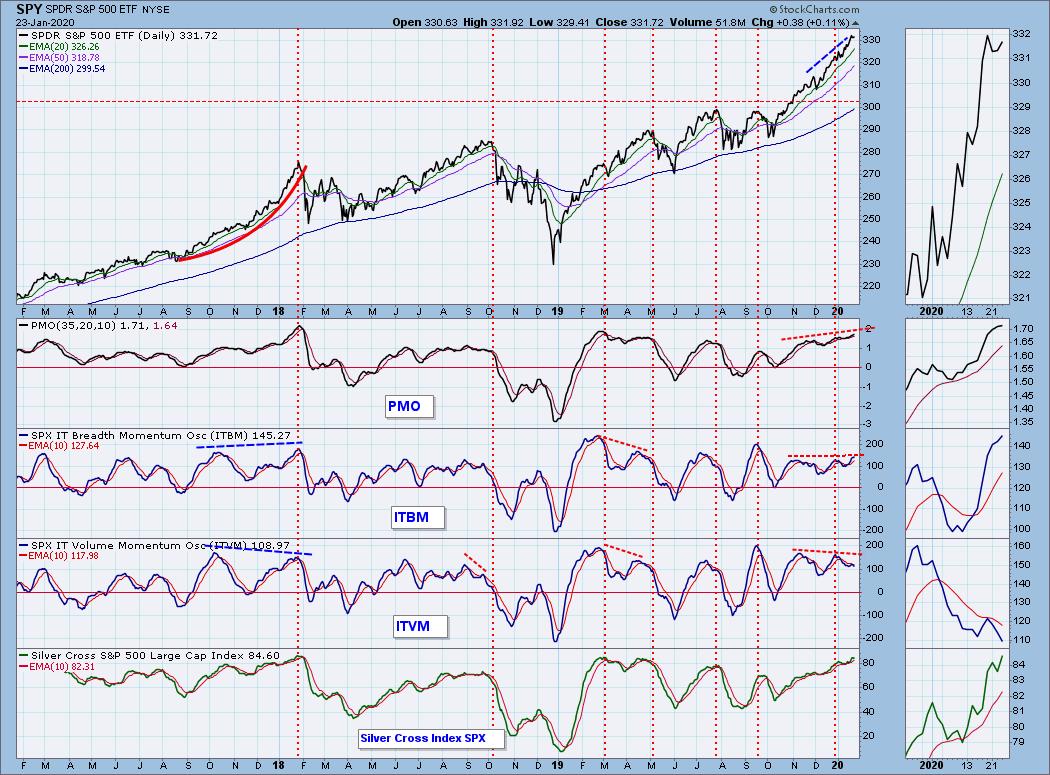
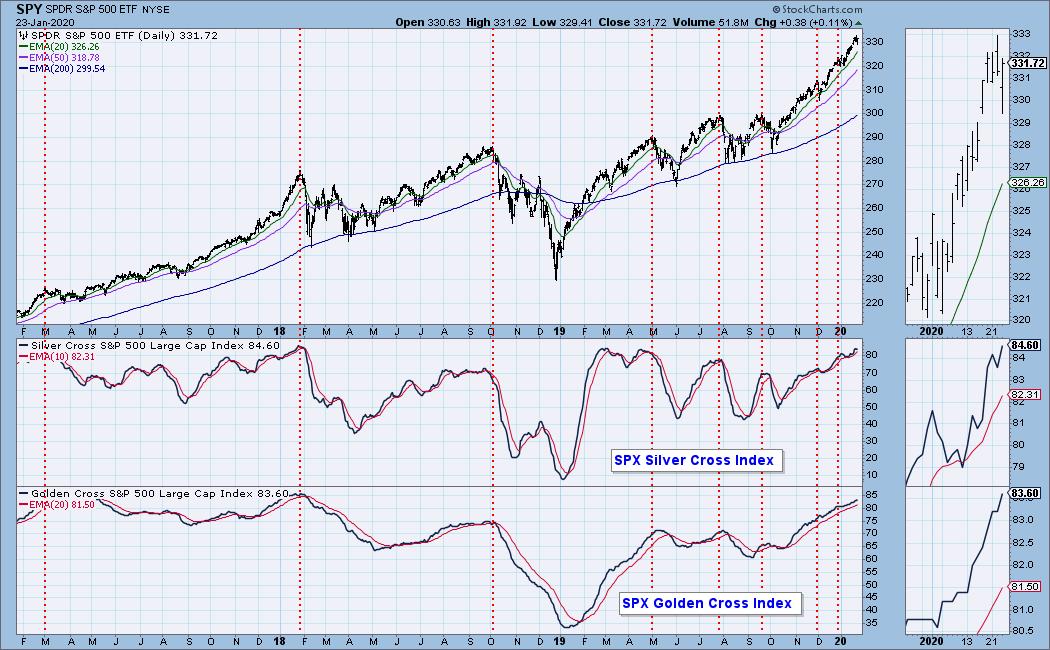
The Golden Cross and Silver Cross Indexes are rising and bullish. They are overbought.
CONCLUSION: The trend of the market is up and the condition is overbought. I'm not liking the negative divergences that are becoming more clear. I would say the market is vulnerable given those divergences and how overbought it is.
(Not a Diamonds subscriber? Add it to your DP Alert subscription and get a discount! Contact support@decisionpoint.com for your limited time coupon code!)
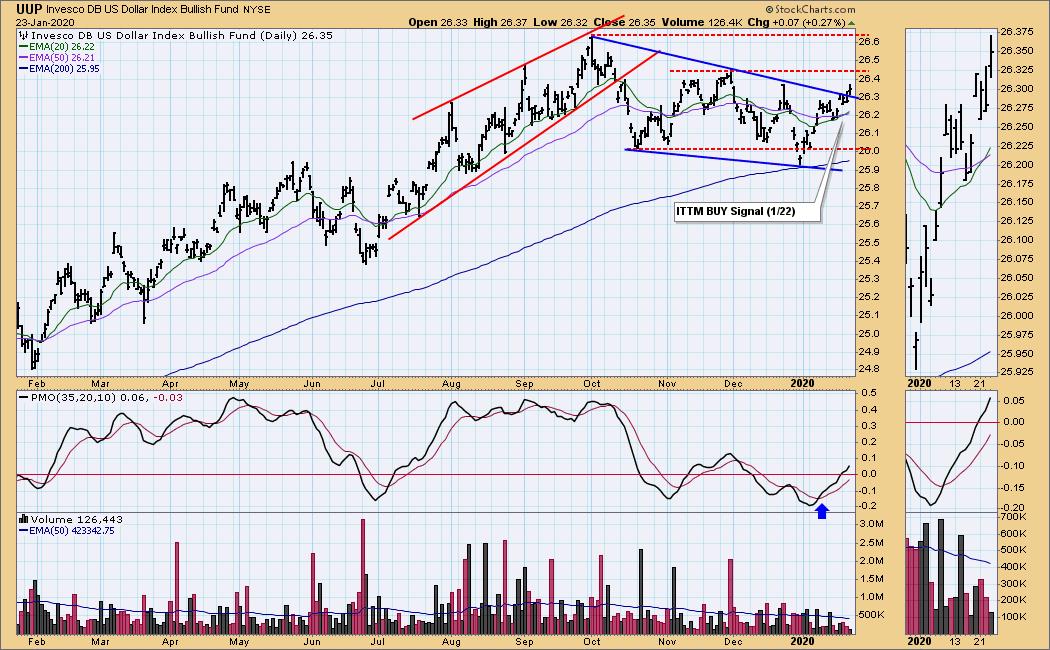
DOLLAR (UUP)
IT Trend Model: BUY as of 1/22/2020
LT Trend Model: BUY as of 5/25/2018
UUP Daily Chart: UUP is executing this bullish falling wedge as quickly as molasses in January as we used to say. It's doing what it is supposed to and the PMO suggests the rally should continue.
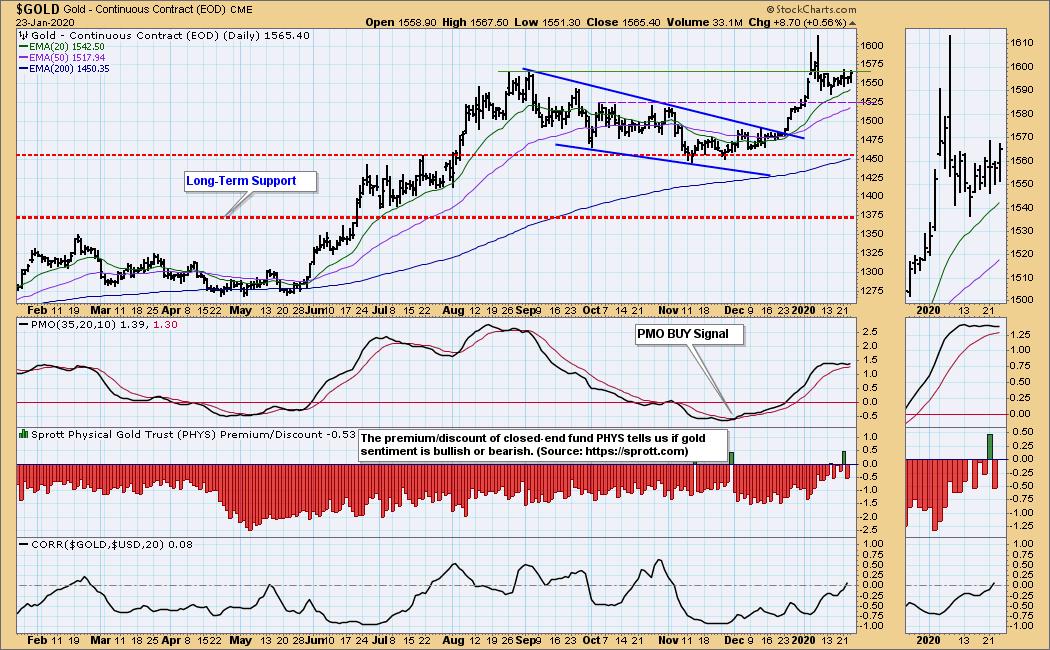
GOLD
IT Trend Model: BUY as of 12/26/2019
LT Trend Model: BUY as of 1/8/2019
GOLD Daily Chart: Gold remains in its short-term trading range. The PMO is flat but trending lower. I suspect we will see more movement sideways within this trading range. The Dollar doesn't seem to be putting pressure on Gold right now.
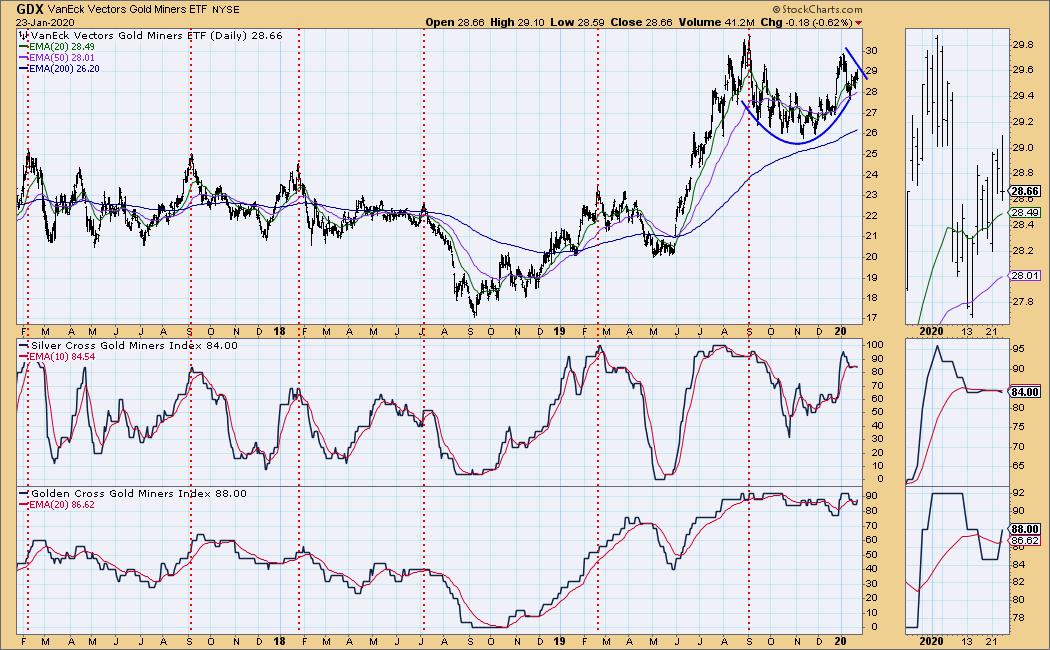
GOLD MINERS Golden and Silver Cross Indexes: I'll be writing about Gold Miners in my ChartWatchers free article on StockCharts.com, but you'll be notified when it publishes in case you aren't on that mailing list. They look great right now as they break from the declining trend. GCI and SCI are confirming.
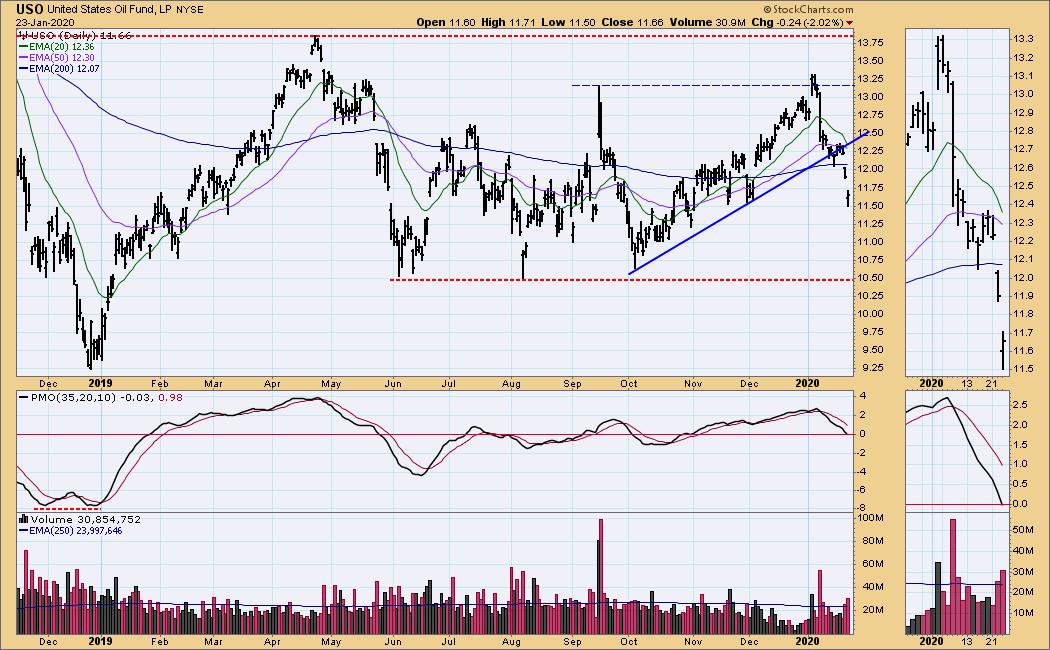
CRUDE OIL (USO)
IT Trend Model: BUY as of 11/6/2019
LT Trend Model: BUY as of 12/16/2019
USO Daily Chart: Well Oil had another big drop on its way down to test the bottom of this longer-term trading range. I don't see any positives here, so I'd expect more downside.
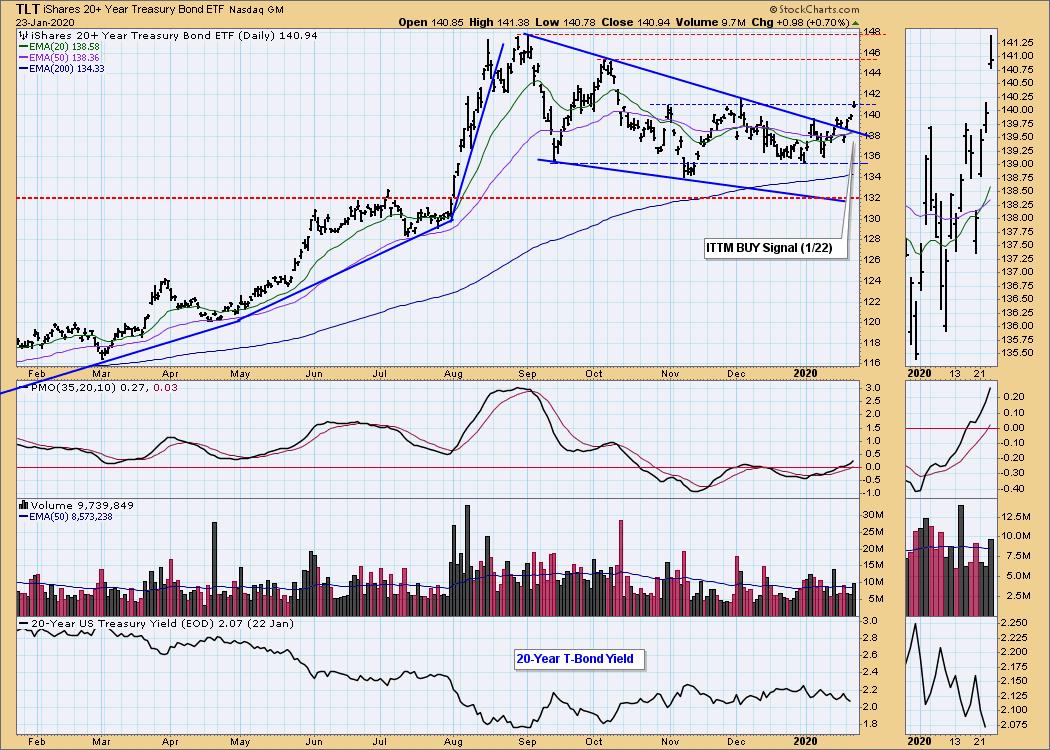
BONDS (TLT)
IT Trend Model: BUY as of 1/22/2020
LT Trend Model: BUY as of 1/2/2019
TLT Daily Chart: Unlike UUP, TLT is being a bit more snappy about executing its bullish falling wedge. Yields continue to fall which means rising bond prices. The PMO looks great, we will see if it can leapfrog over resistance at the December top before pulling back.
Have you subscribed the DecisionPoint Diamonds yet? You can add it at a discount! Contact support@decisionpoint.com for information on how to save on Diamonds!
Technical Analysis is a windsock, not a crystal ball.
Happy Charting! - Erin
Email: erin@decisionpoint.com

Erin Swenlin will be presenting at the The MoneyShow Las Vegas May 11-13, 2020! You'll have an opportunity to meet Erin and discuss the latest DecisionPoint news and Diamond Scans. The conference is free to attend or view online!
NOTE: The signal status reported herein is based upon mechanical trading model signals, specifically, the DecisionPoint Trend Model. They define the implied bias of the price index based upon moving average relationships, but they do not necessarily call for a specific action. They are information flags that should prompt chart review. Further, they do not call for continuous buying or selling during the life of the signal. For example, a BUY signal will probably (but not necessarily) return the best results if action is taken soon after the signal is generated. Additional opportunities for buying may be found as price zigzags higher, but the trader must look for optimum entry points. Conversely, exit points to preserve gains (or minimize losses) may be evident before the model mechanically closes the signal.
Helpful DecisionPoint Links (Can Be Found on DecisionPoint.com Links Page):
DecisionPoint Shared ChartList and DecisionPoint Chart Gallery
Price Momentum Oscillator (PMO)
Swenlin Trading Oscillators (STO-B and STO-V)