
We had two new Intermediate-Term Trend Model (ITTM) BUY signals trigger today. The Dollar (UUP) and Bonds (TLT) both saw 20-EMAs cross above 50-EMAs which is what generated the new signals. I'll talk more about this in their respective sections below.
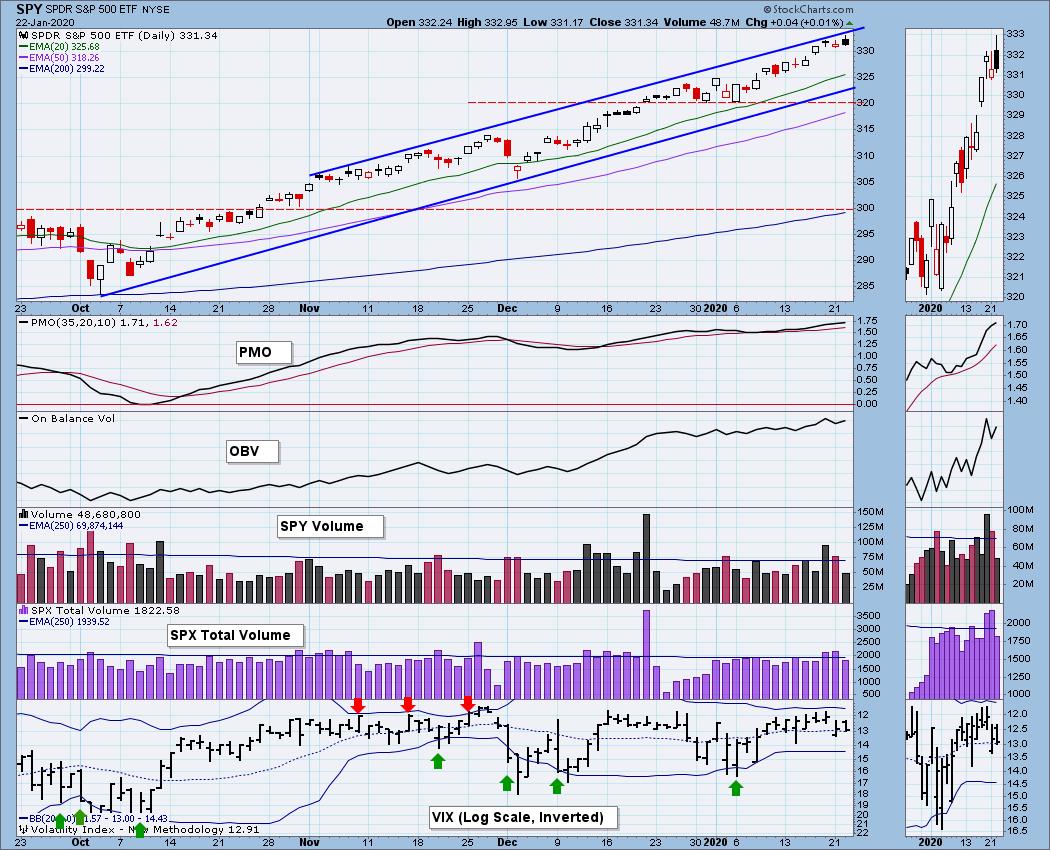
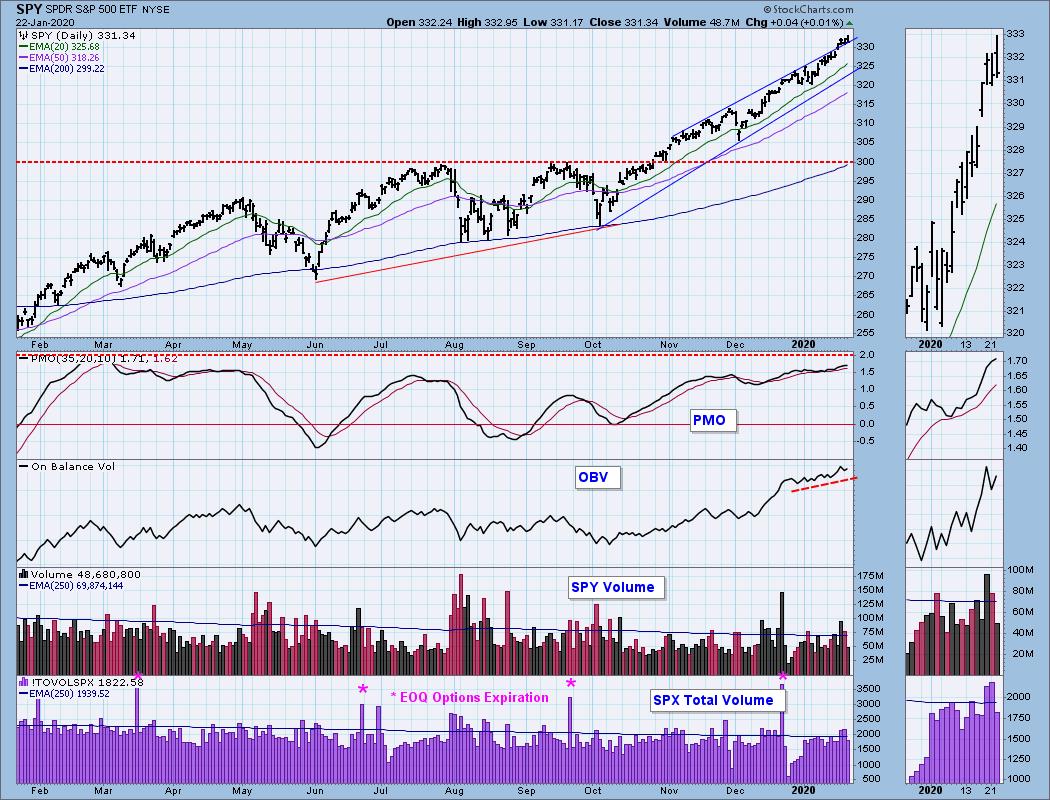
The 4-month candlestick chart shows the solid rising trend. The bearish rising wedge is still there, albeit less visible on a 4-month chart. Volume could've been better today, I'm looking at it as a pause for the market.
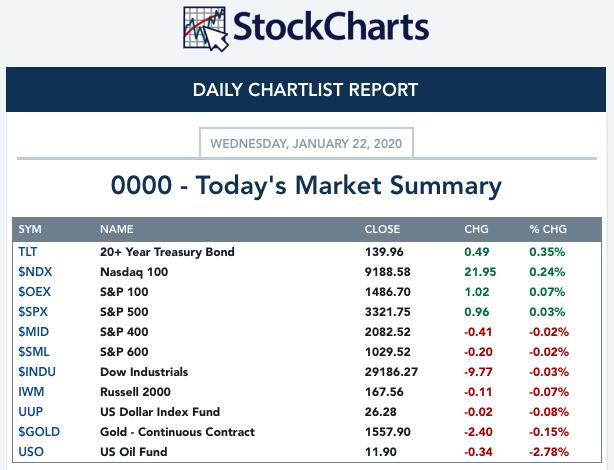
TODAY'S Broad Market Action:
The DecisionPoint Alert Weekly Wrap presents an end-of-week assessment of the trend and condition of the stock market (S&P 500), the U.S. Dollar, Gold, Crude Oil, and Bonds. Monday through Thursday the DecisionPoint Alert daily report is abbreviated and covers changes for the day.
Watch the latest episode of DecisionPoint on StockCharts TV's YouTube channel here!
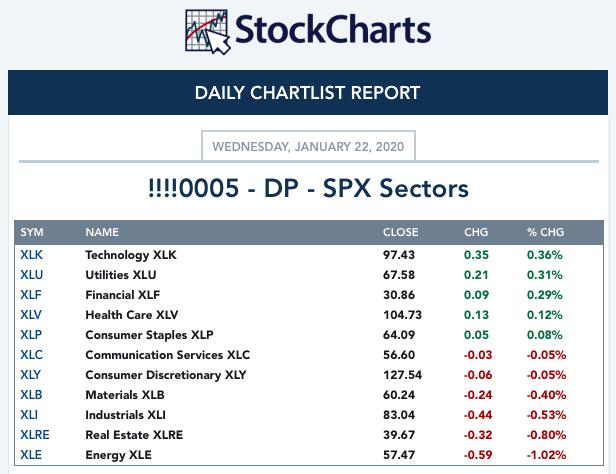
SECTORS
SIGNALS:
Each S&P 500 Index component stock is assigned to one, and only one, of 11 major sectors. This is a snapshot of the Intermediate-Term (Silver Cross) and Long-Term (Golden Cross) Trend Model signal status for those sectors.
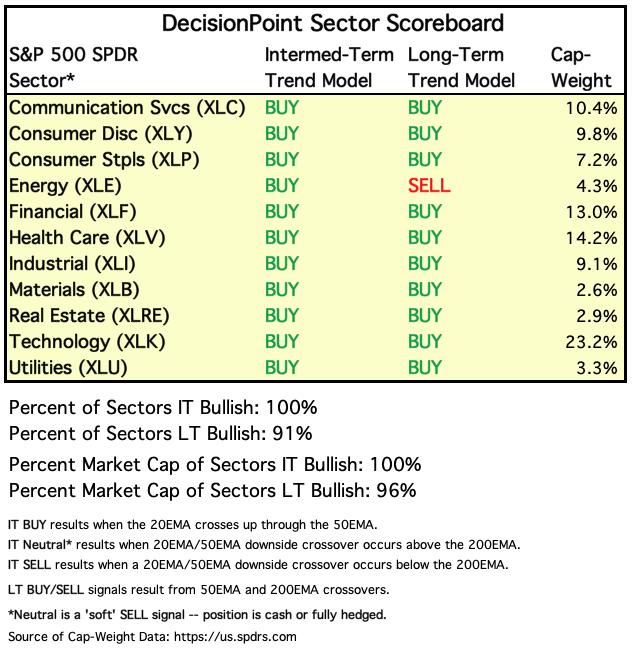
TODAY'S RESULTS:
STOCKS
IT Trend Model: BUY as of 9/6/2019
LT Trend Model: BUY as of 2/26/2019
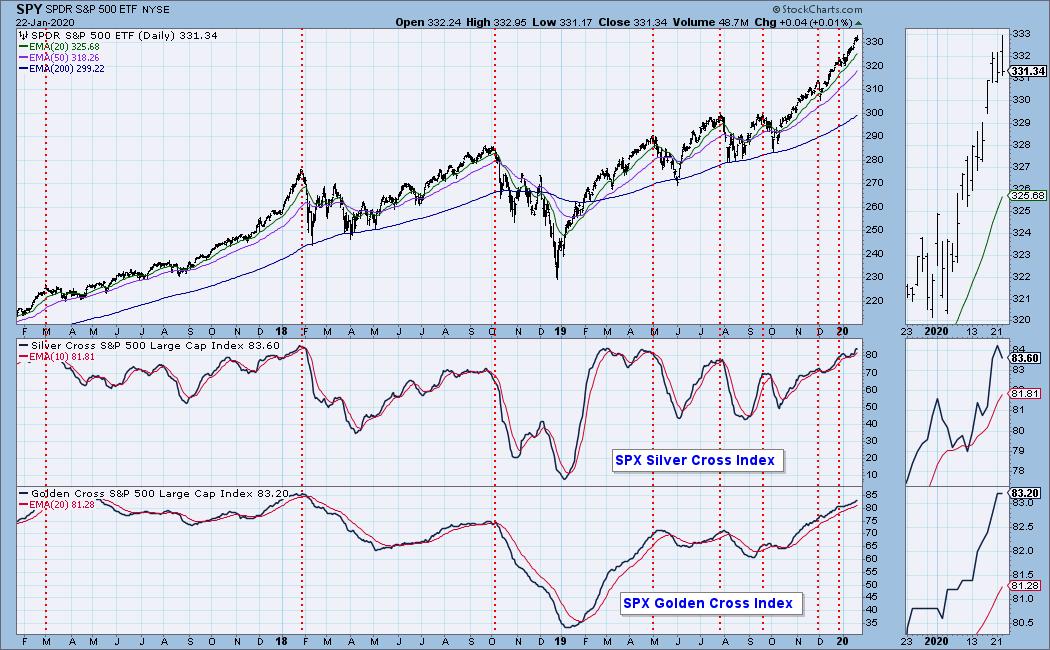
SPY Daily Chart: As noted above, volume was lower today, but overall it wasn't 'especially' low. A new all-time intraday high was logged, but price closed near the bottom of today's bar. This isn't bullish, but as I mentioned earlier, I think this is a pause in the action. The OBV continues to confirm the rally.
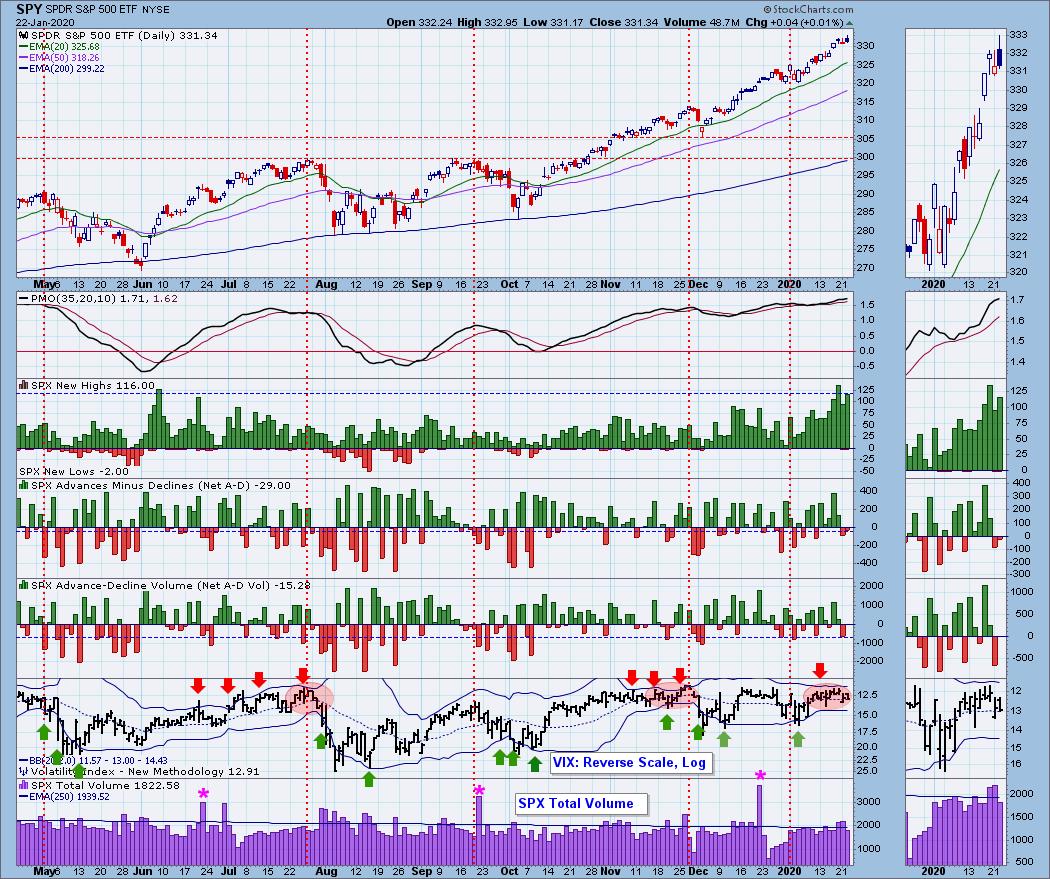
Climactic Market Indicators: New Highs remain climactic and rose today which confirms the rising trend. No other climactic readings.
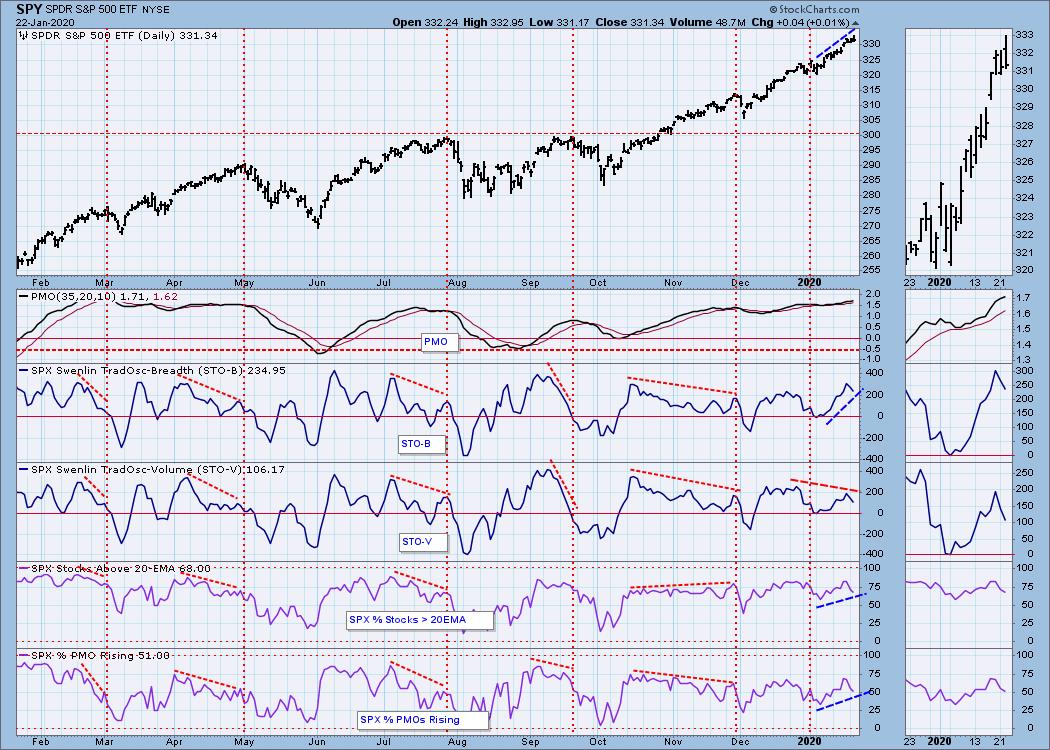
Short-Term Market Indicators: The STOs topped yesterday and I don't like that they are continuing to fall. I am concerned that only half of the SPX components are showing rising PMOs (momentum). We are also losing stocks with price above their 20-EMAs.
Intermediate-Term Market Indicators: The divergence between the ITBM and ITVM continue to bother me.
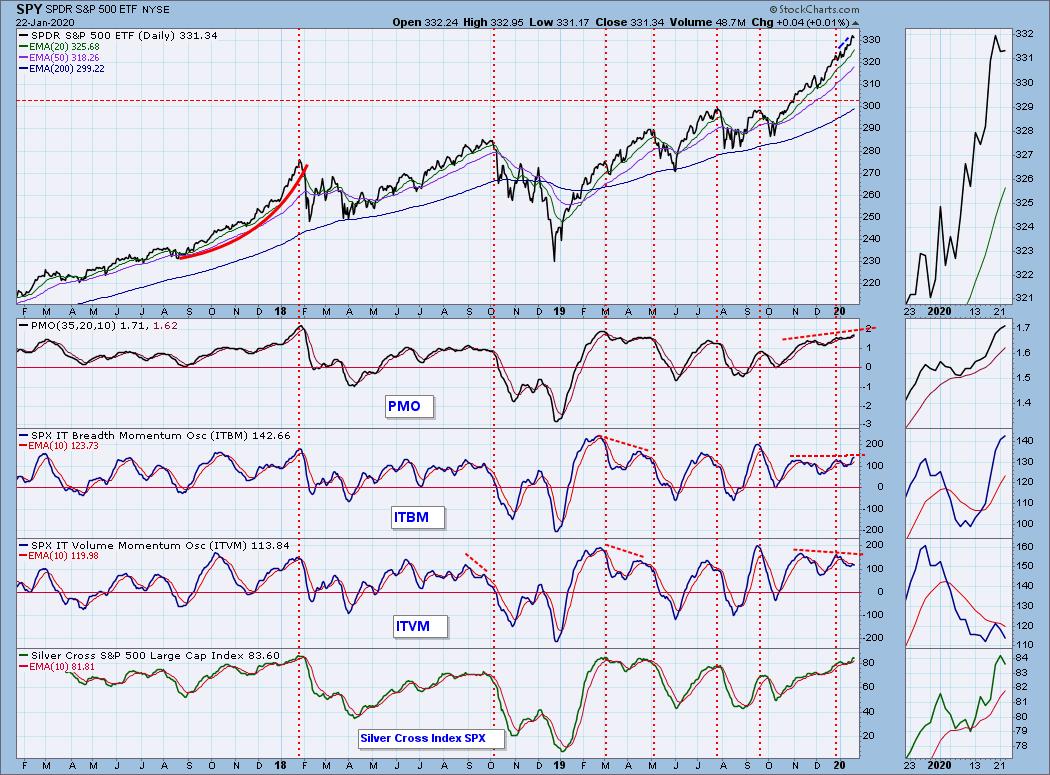
The Golden Cross and Silver Cross Indexes are holding up, but looking at the chart above, we know that weakness is beginning to show with only 51% of the SPX have rising PMOs.
CONCLUSION: My comments from yesterday are about the same for today. The trend of the market is up and the condition is overbought. Overall I feel like the indicators are behind this rally. I don't like the negative divergences on some of the volume indicators. Full disclosure that I give my Diamonds readers is that currently I am 35% cash.
(Not a Diamonds subscriber? Add it to your DP Alert subscription and get a discount! Contact support@decisionpoint.com for your limited time coupon code!)
DOLLAR (UUP)
IT Trend Model: BUY as of 1/22/2020
LT Trend Model: BUY as of 5/25/2018
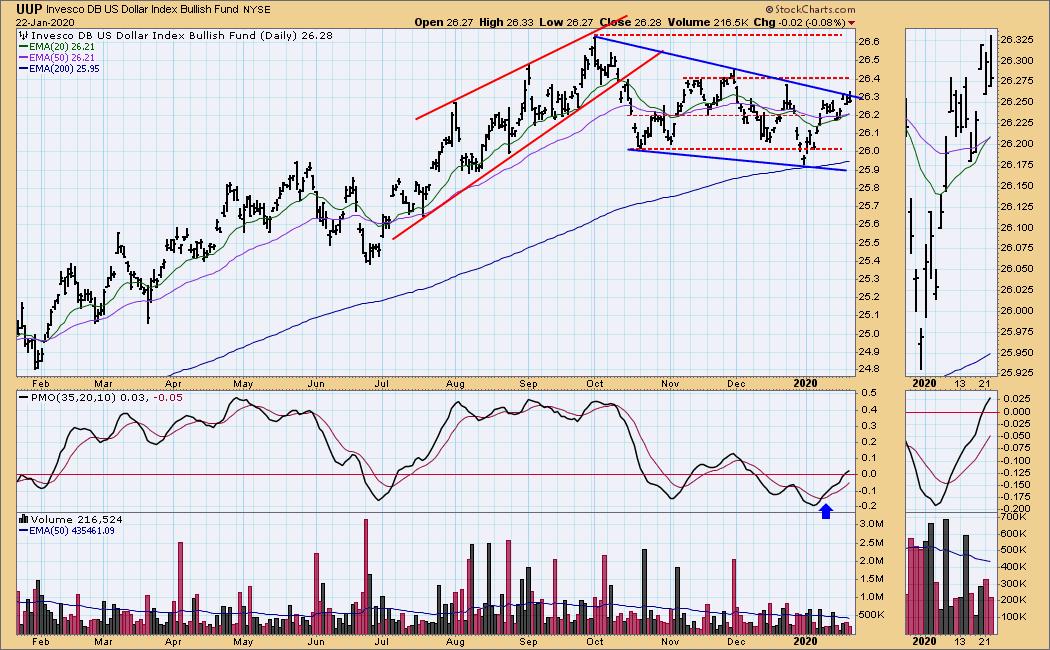
UUP Daily Chart: As noted in today's headline, the 20/50-EMAs had a positive crossover and generated a new ITTM BUY signal. Everything is lining up and the Dollar should be reacting to the upside, but it is still SO hesitant. Patience apparently is needed to see the breakout from the bullish falling wedge.
GOLD
IT Trend Model: BUY as of 12/26/2019
LT Trend Model: BUY as of 1/8/2019
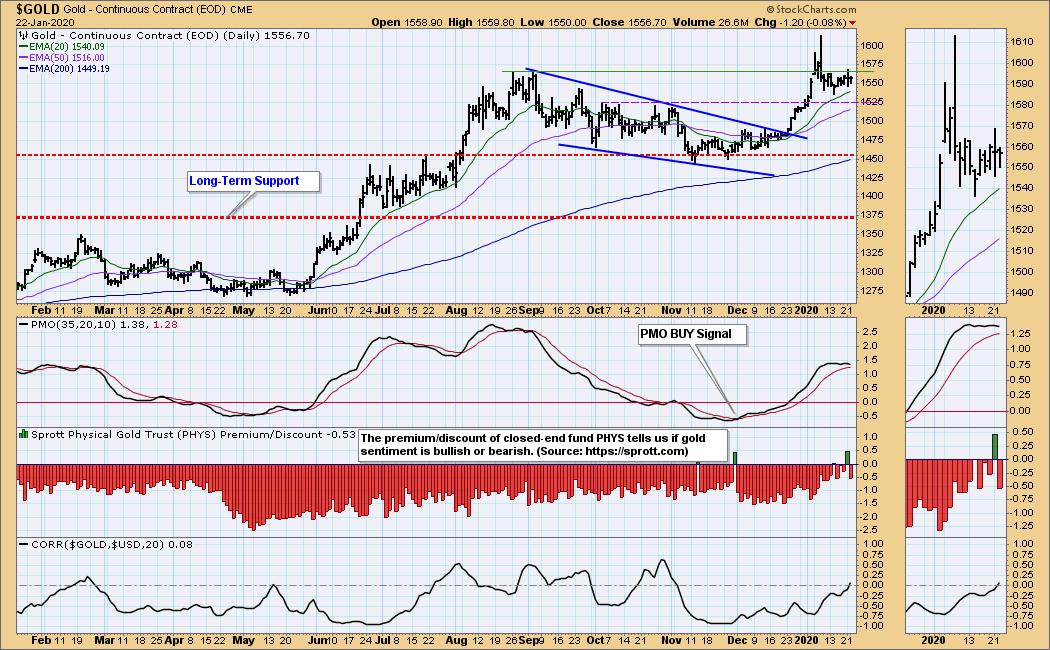
GOLD Daily Chart: Gold remains in the short-term trading range. The PMO hasn't deteriorated too much and with zero correlation right now to the Dollar, I would look for more of the same consolidation in this trading range.
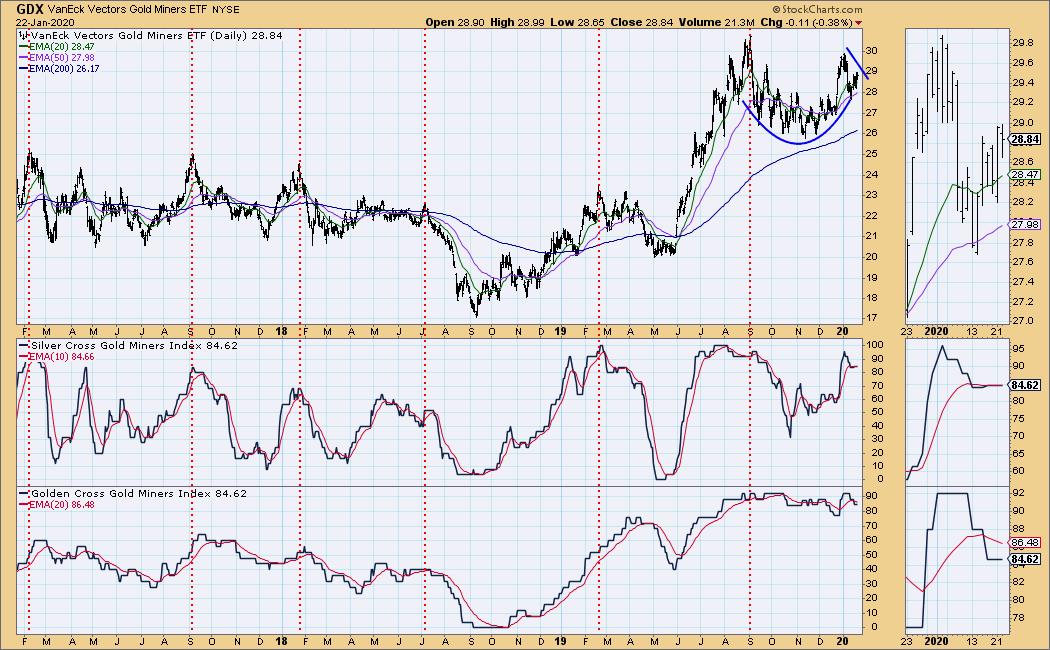
GOLD MINERS Golden and Silver Cross Indexes: The cup and handle on Gold Miners is executing as expected. You can see the breakout from the handle in the thumbnail. This group is continuing to look very bullish and it has the numbers on the SCI and GCI to support a rally.
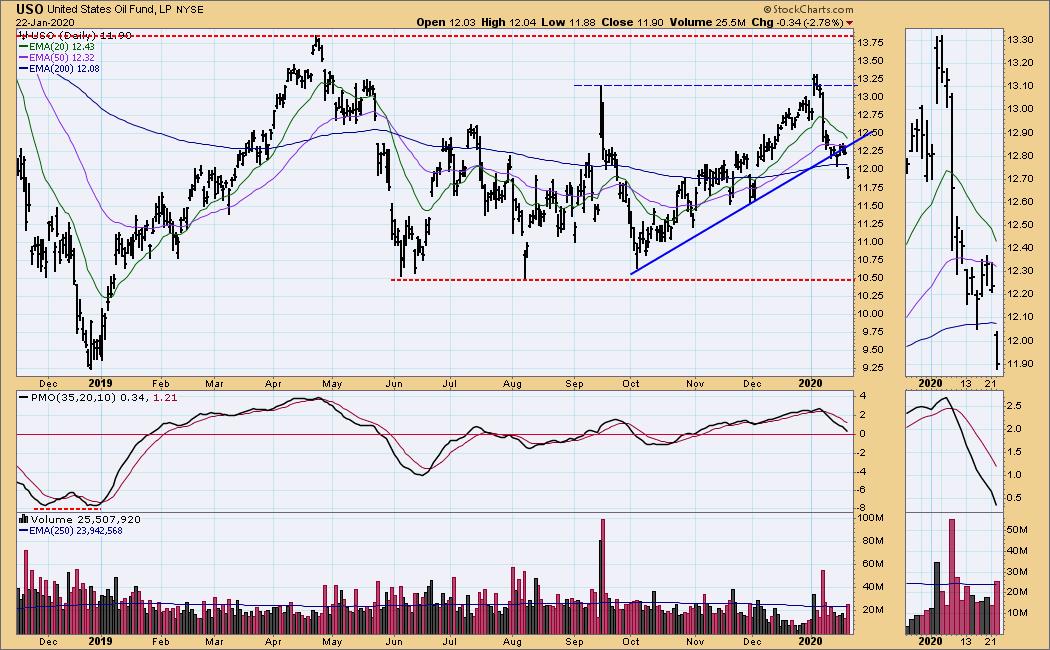
CRUDE OIL (USO)
IT Trend Model: BUY as of 11/6/2019
LT Trend Model: BUY as of 12/16/2019
USO Daily Chart: Finally we see the break down of the rising trend that began last October. Not only was the rising trendline breached, but price gapped down below the 200-EMA. I'd look for more downside with possible support at the November/December lows at $11.50.
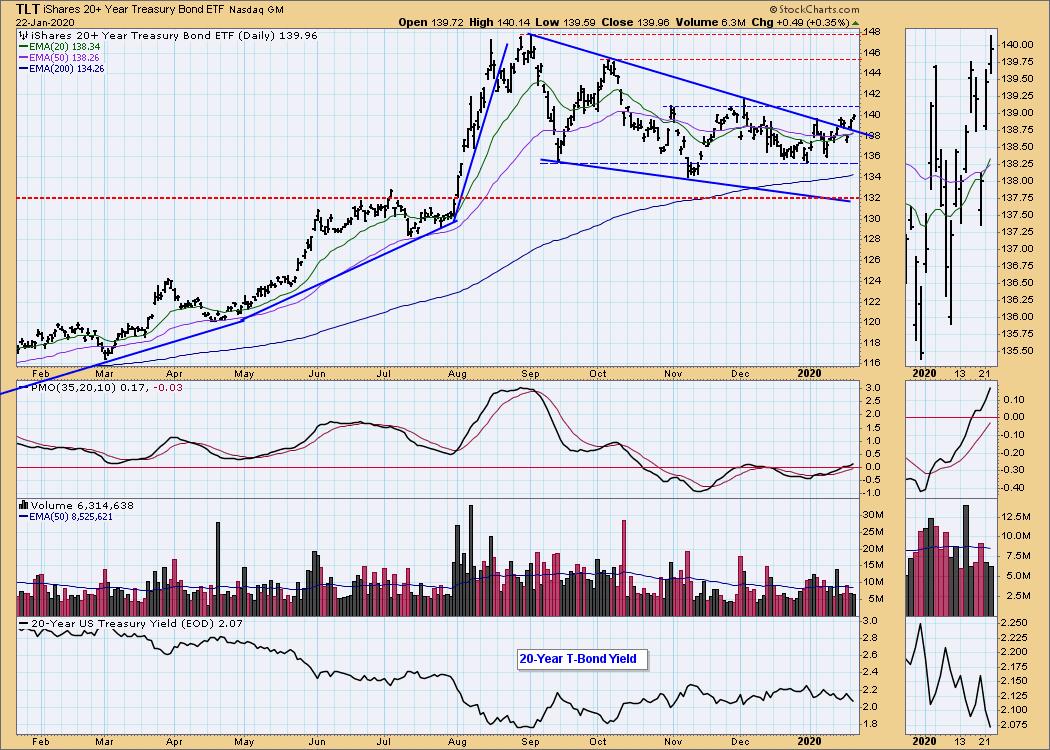
BONDS (TLT)
IT Trend Model: BUY as of 1/22/2020
LT Trend Model: BUY as of 1/2/2019
TLT Daily Chart: An ITTM BUY signal was generated with the positive 20/50-EMA crossover. The breakout is finally occurring from the bullish falling wedge. Unfortunately, it hasn't broken from the trading channel of the last two months. Given the PMO and the bullish chart pattern, I am expecting to see a breakout from that channel soon.
Have you subscribed the DecisionPoint Diamonds yet? You can add it at a discount! Contact support@decisionpoint.com for information on how to save on Diamonds!
Technical Analysis is a windsock, not a crystal ball.
Happy Charting! - Erin
Email: erin@decisionpoint.com

Erin Swenlin will be presenting at the The MoneyShow Las Vegas May 11-13, 2020! You'll have an opportunity to meet Erin and discuss the latest DecisionPoint news and Diamond Scans. The conference is free to attend or view online!
NOTE: The signal status reported herein is based upon mechanical trading model signals, specifically, the DecisionPoint Trend Model. They define the implied bias of the price index based upon moving average relationships, but they do not necessarily call for a specific action. They are information flags that should prompt chart review. Further, they do not call for continuous buying or selling during the life of the signal. For example, a BUY signal will probably (but not necessarily) return the best results if action is taken soon after the signal is generated. Additional opportunities for buying may be found as price zigzags higher, but the trader must look for optimum entry points. Conversely, exit points to preserve gains (or minimize losses) may be evident before the model mechanically closes the signal.
Helpful DecisionPoint Links (Can Be Found on DecisionPoint.com Links Page):
DecisionPoint Shared ChartList and DecisionPoint Chart Gallery
Price Momentum Oscillator (PMO)
Swenlin Trading Oscillators (STO-B and STO-V)