
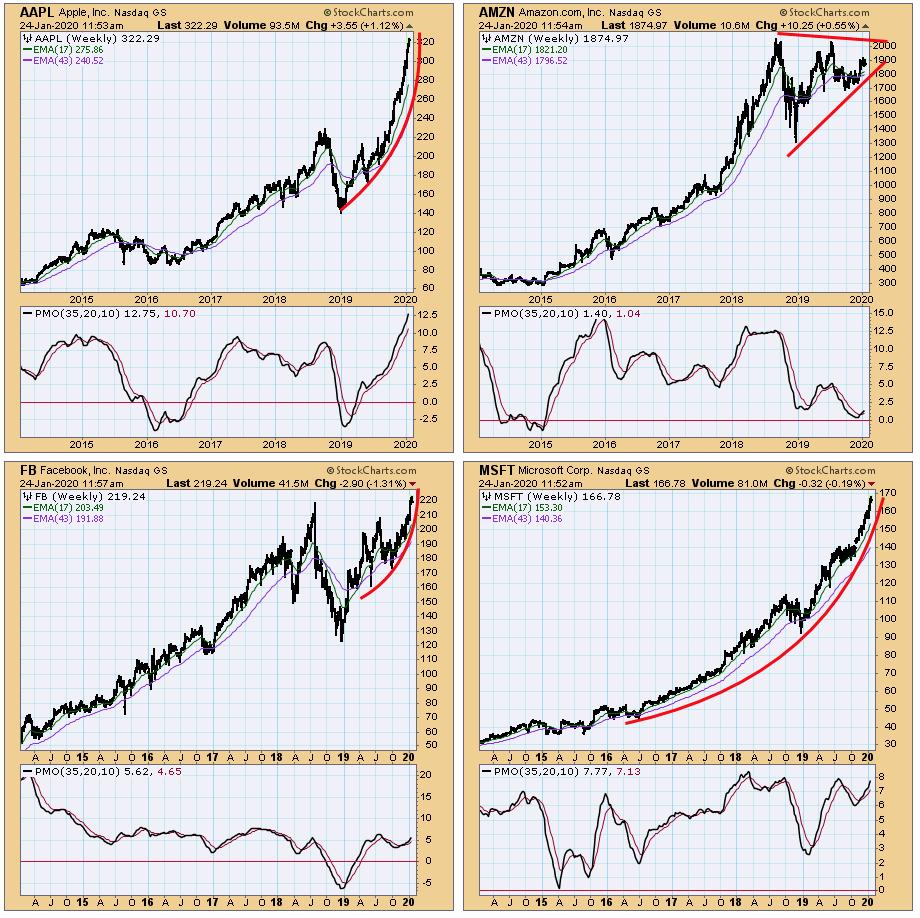
I used to track the S&P 500 constituents, and learned that the top 50 stocks (10% of the index) accounted for about 50% of the total S&P 500 market cap. The other day I was rather shocked to hear that AAPL, AMZN, FB, and MSFT currently constitute eighteen percent of the S&P 500 Index market cap. This is a lot of eggs in one basket. Below I have a cluster of charts for those four stocks. Amazon is about -10% off its all-time highs and sports a triangle formation -- technical expectation is an upside resolution. The other three are blasting into all-time high territory, and they are in the vertical stage of parabolic advances. They may very well go higher, much higher, but parabolics ultimately break, and furious declines normally ensue. This concentration of market cap is not a healthy situation, and the chart patterns aren't helping my outlook.
The DecisionPoint Alert Weekly Wrap presents an end-of-week assessment of the trend and condition of the Stock Market, the U.S. Dollar, Gold, Crude Oil, and Bonds. The DecisionPoint Alert daily report (Monday through Thursday) is abbreviated and gives updates on the Weekly Wrap assessments.
Watch the latest episode of DecisionPoint on StockCharts TV's YouTube channel here!
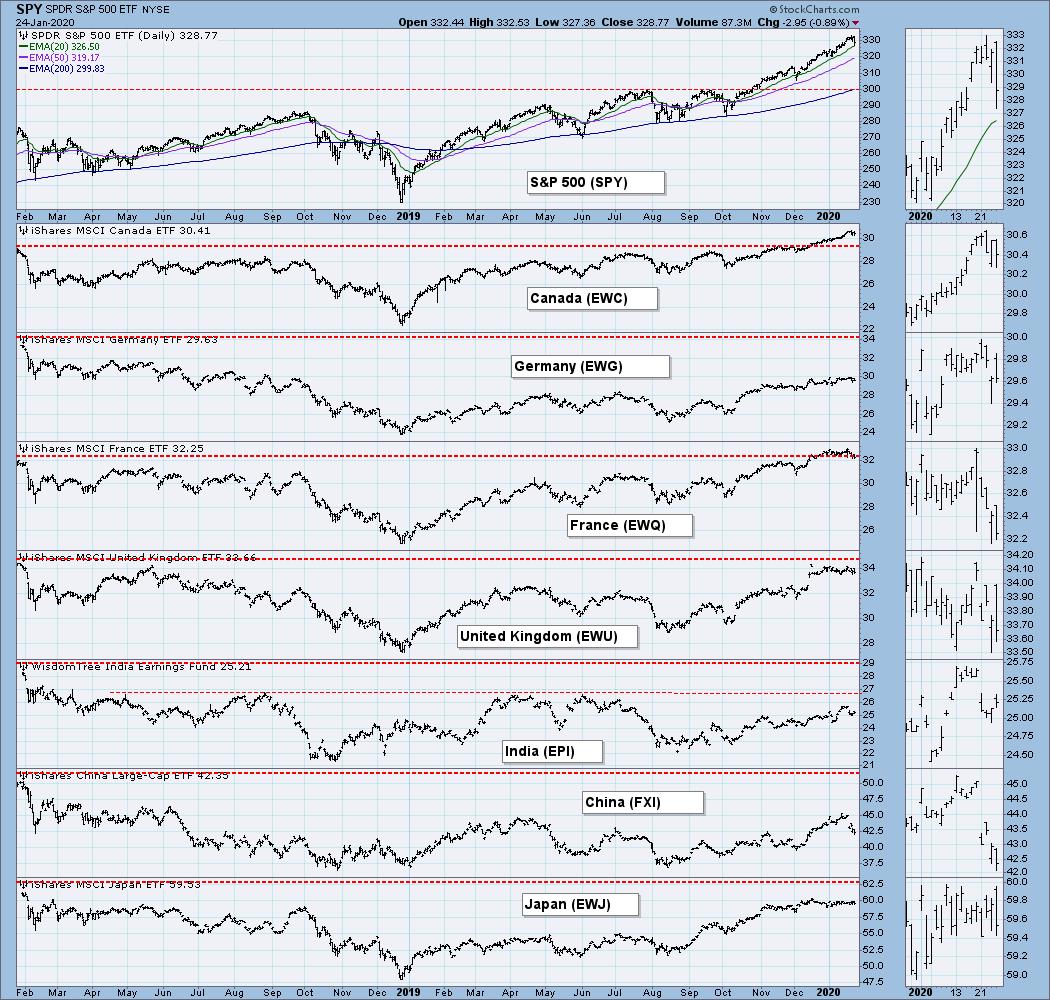
GLOBAL MARKETS
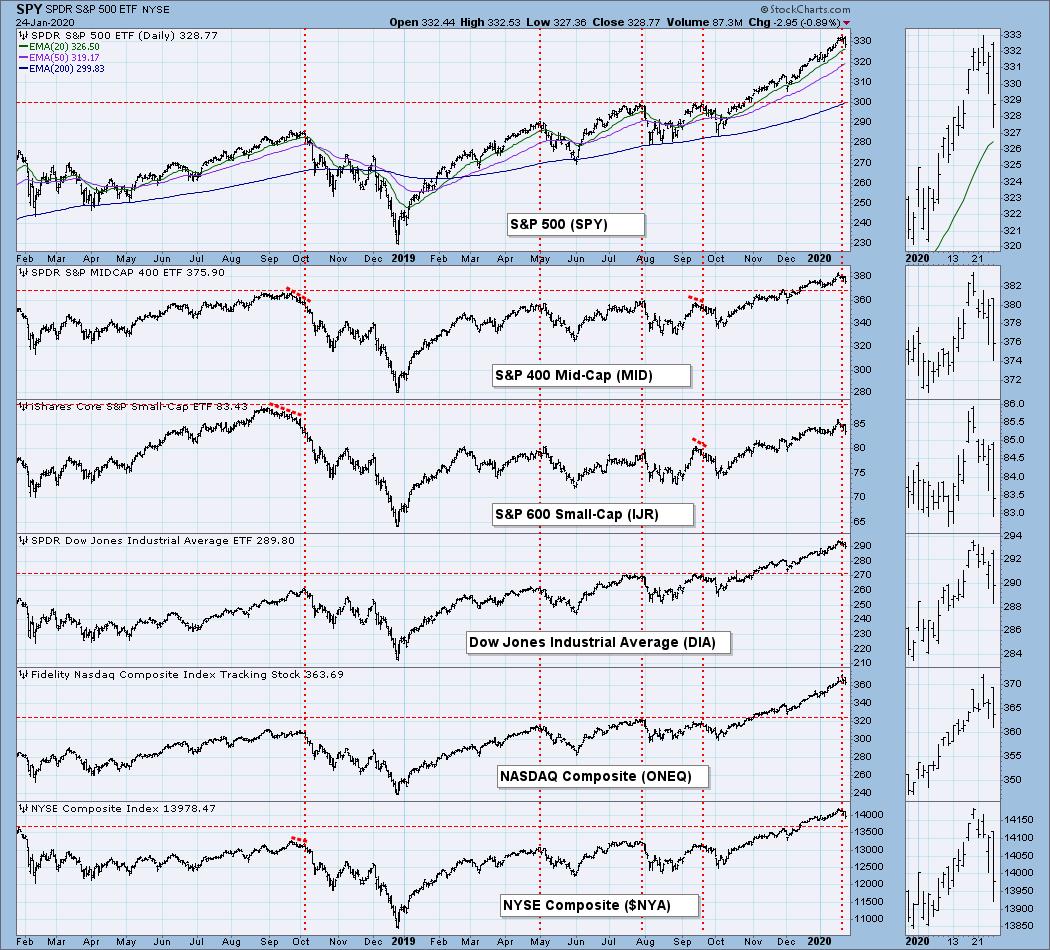
BROAD MARKET INDEXES
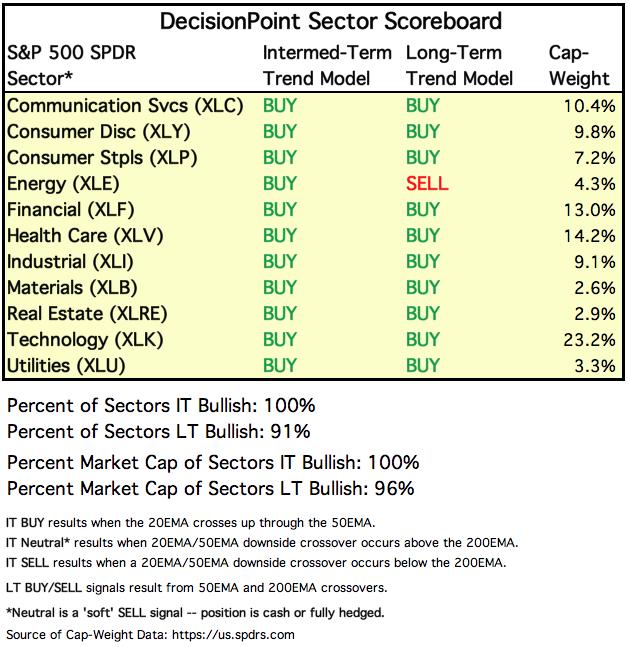
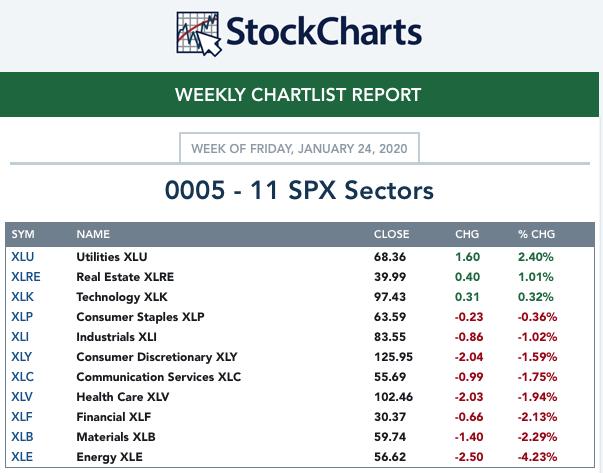
SECTORS
Each S&P 500 Index component stock is assigned to one, and only one, of 11 major sectors. This is a snapshot of the Intermediate-Term (Silver Cross) and Long-Term (Golden Cross) Trend Model signal status for those sectors.
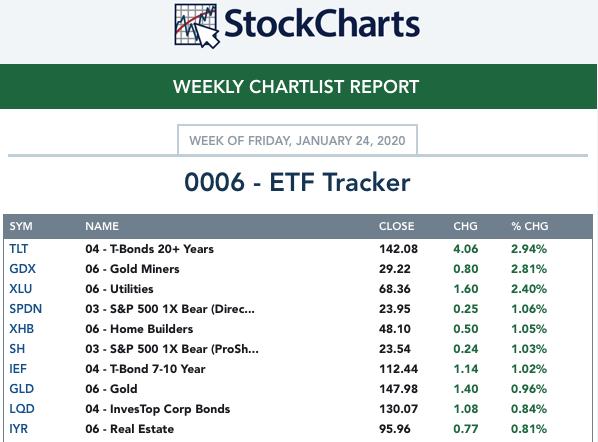
THIS WEEK'S RESULTS:
Here are the top 10 from my ETF Tracker list . . .
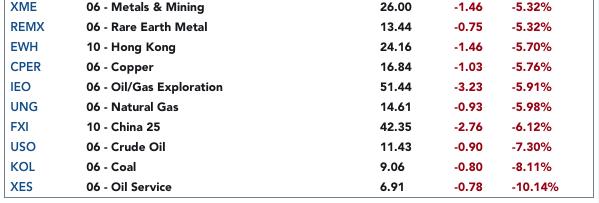
. . . and the bottom 10.
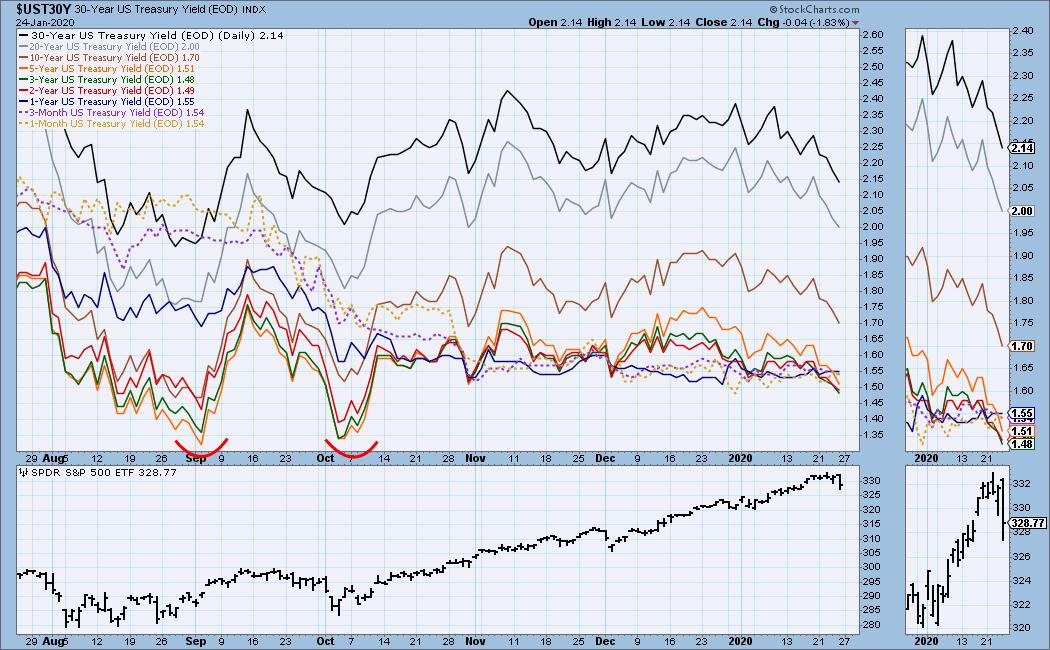
INTEREST RATES
The 5-Year and shorter durations are bunched together, and there will probably be inversions from time to time.
STOCKS
IT Trend Model: BUY as of 9/6/2019
LT Trend Model: BUY as of 2/26/2019
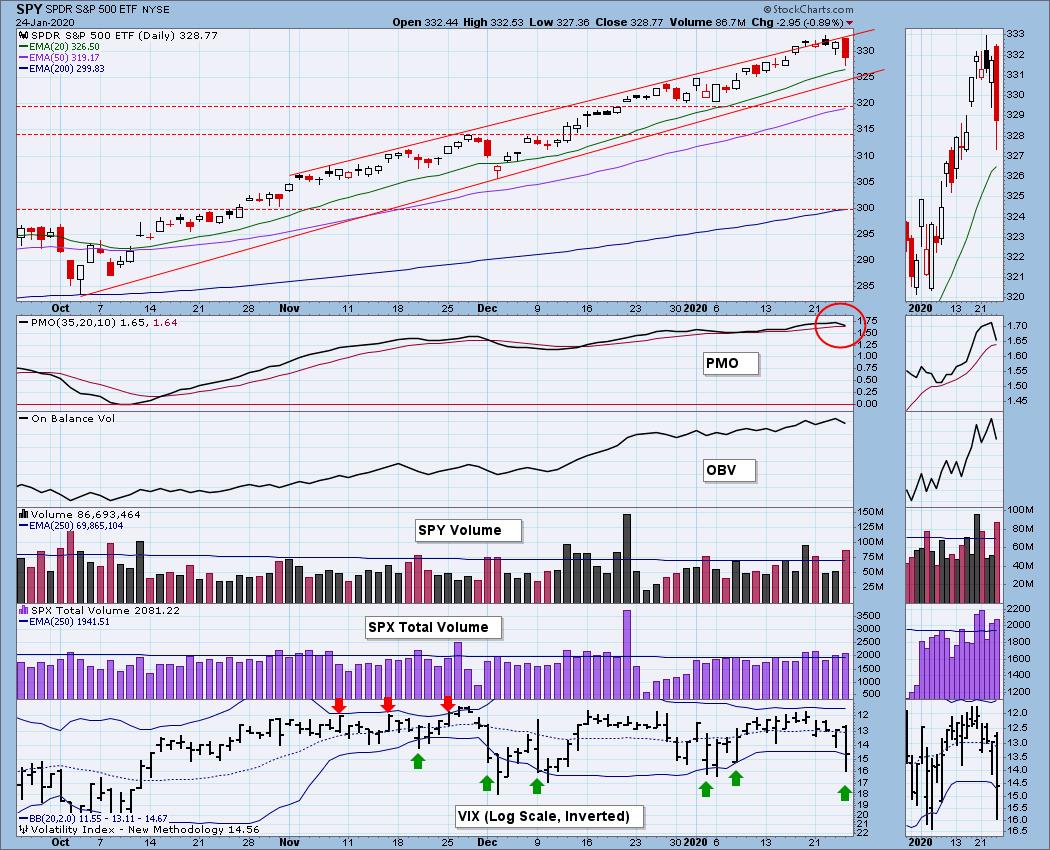
SPY Daily Chart: I normally use bar charts, but it is hard to beat candlesticks when you want to emphasize a down move.
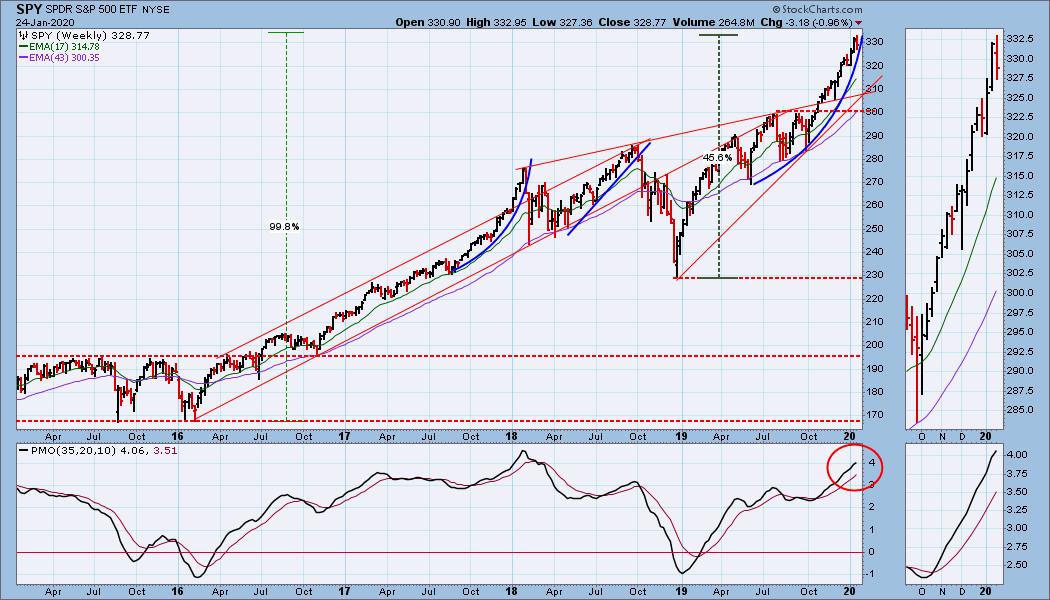
SPY Weekly Chart: The current parabolic arc remains intact, but the weekly PMO is very overbought. In fact, it is nearly as high as it was in early-2018 when that parabolic arc was about to be broken.
Climactic Market Indicators: I think today qualifies as a climax day. Since price just came off a top, I'll have to call it a downside initiation climax. The VIX penetrated the lower Bollinger Band, which, in this context, probably seconds the downside initiation climax.
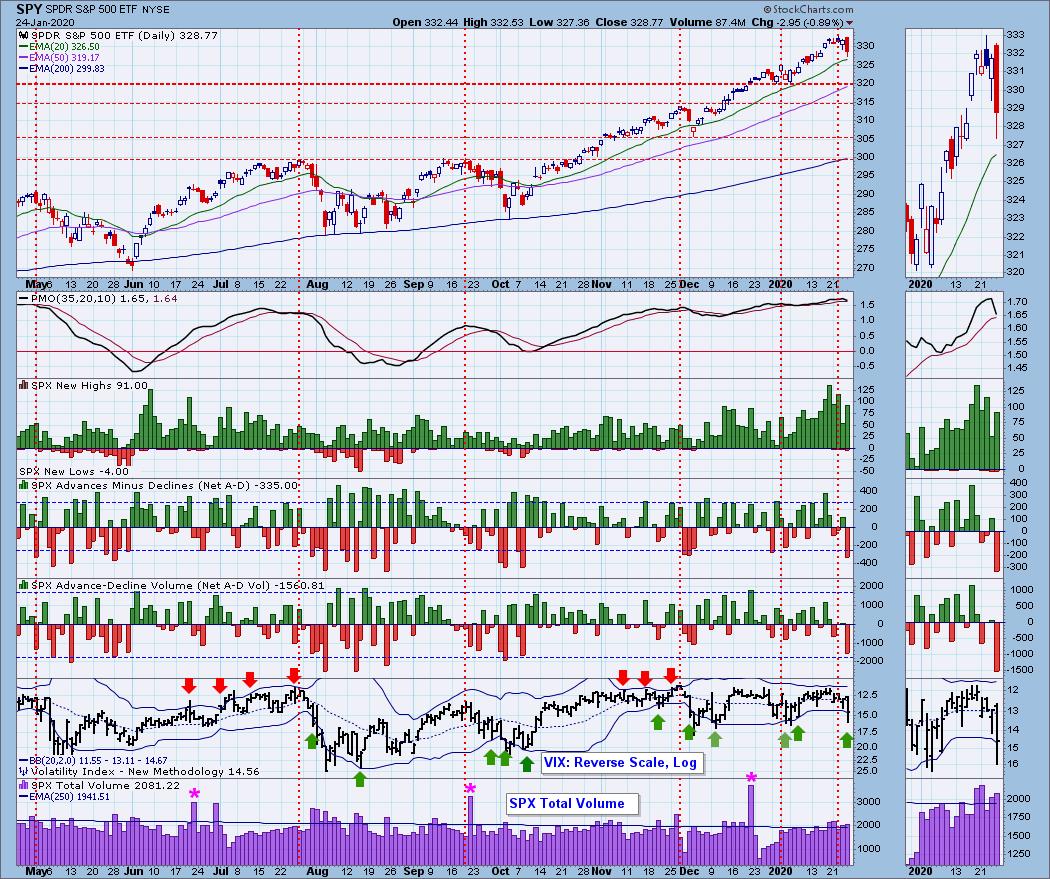
Short-Term Market Indicators: Notice that all these indicators turned down a few days ahead of this week's price top. Not a lot of warning, but better than no warning at all.
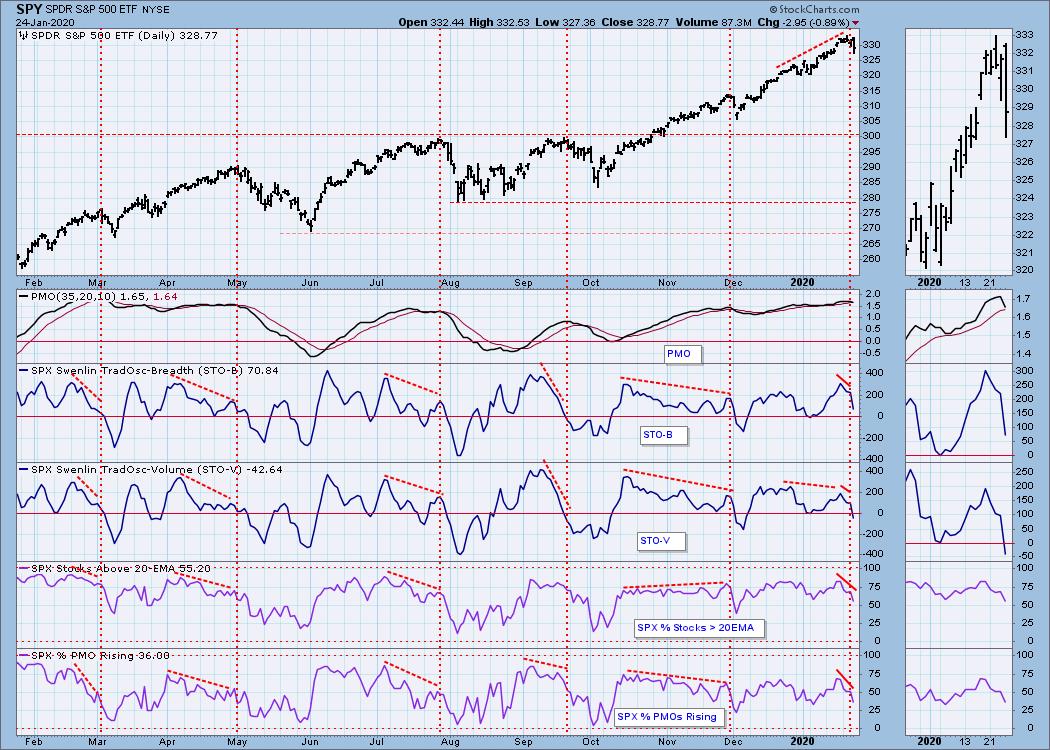
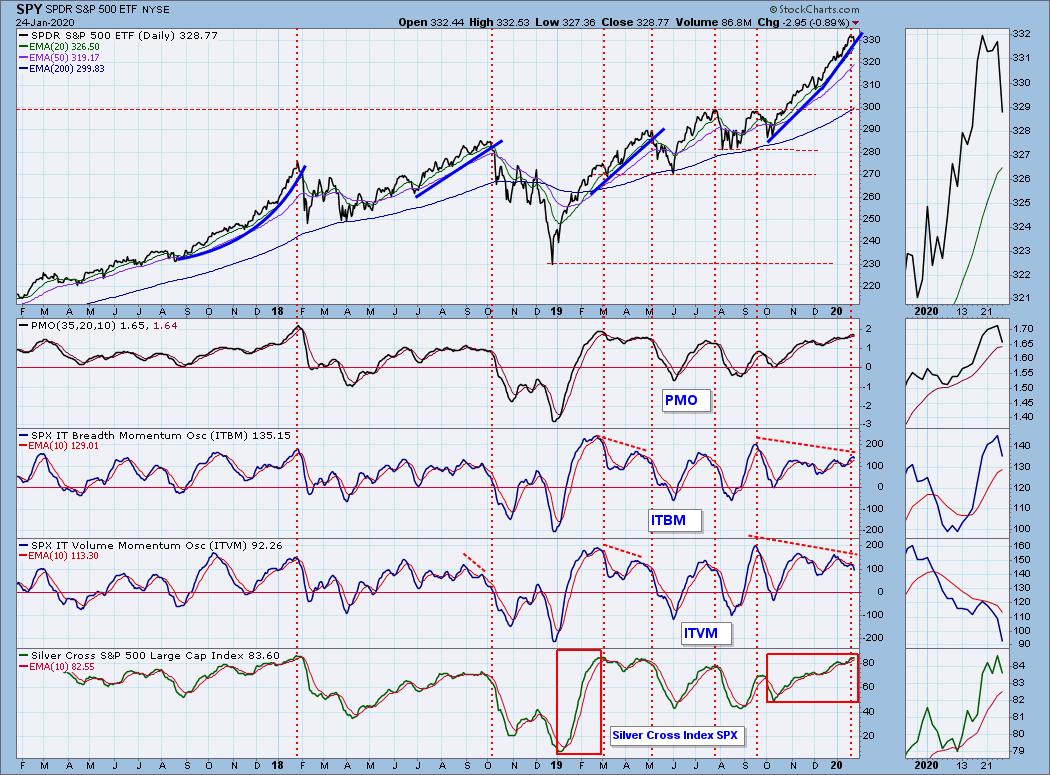
Intermediate-Term Market Indicators: These indicators are near the top of their range, a condition that doesn't persist for long.
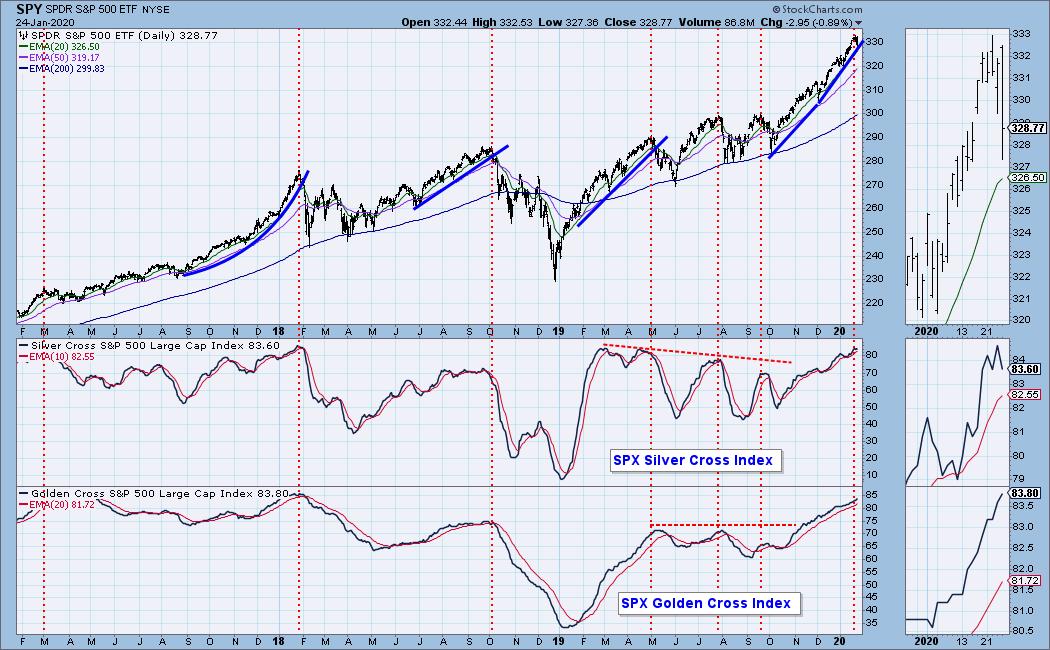
The PMO and Silver Cross Index have turned down from very overbought levels. The ITBM and ITVM have also turned down, but from lower levels, creating strong negative divergences.
CONCLUSION: The trend is UP and the market condition is OVERBOUGHT. The theme I have been following is that the market is in a parabolic advance, and that it is doomed to break down and correct eventually. As for when it will happen, we currently have an excellent setup for putting in an important top. We got a downside initiation climax today, and the intermediate-term indicators are overbought and topping. As for how it will play out, I think that the early-2018 event is a good example the kind of thing I expect.
NOTE: There is a Fed announcement due on Wednesday of next week. No Fed action is expected.
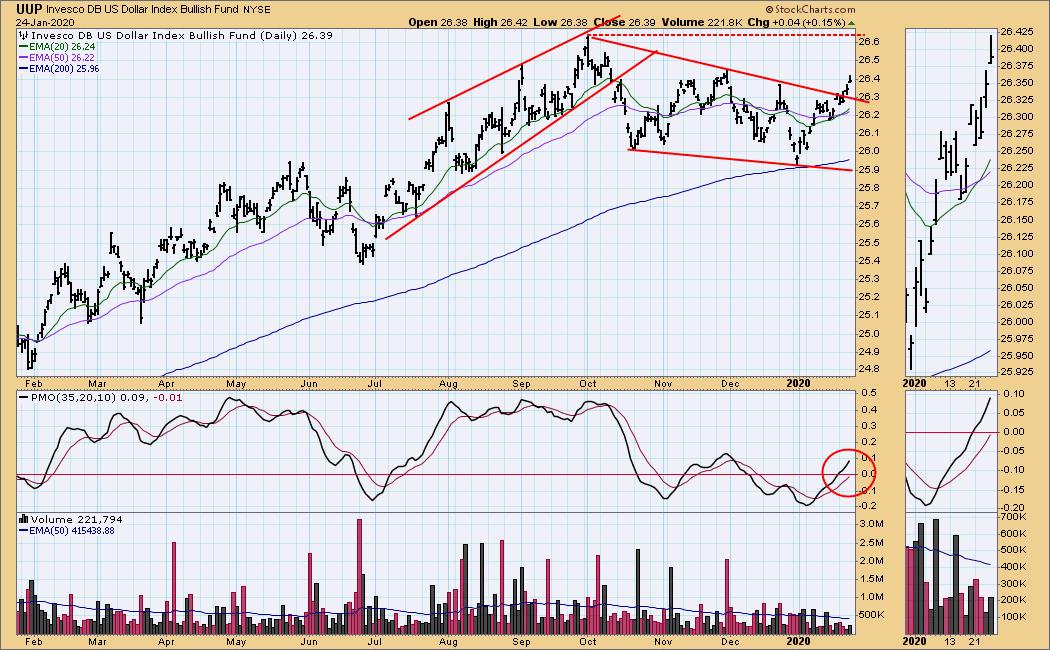
DOLLAR (UUP)
IT Trend Model: BUY as of 1/22/2020
LT Trend Model: BUY as of 5/25/2018
UUP Daily Chart: UUP has broken out of the falling wedge formation, but at this point I'm assuming that overhead resistance drawn from the October price top will prevail.
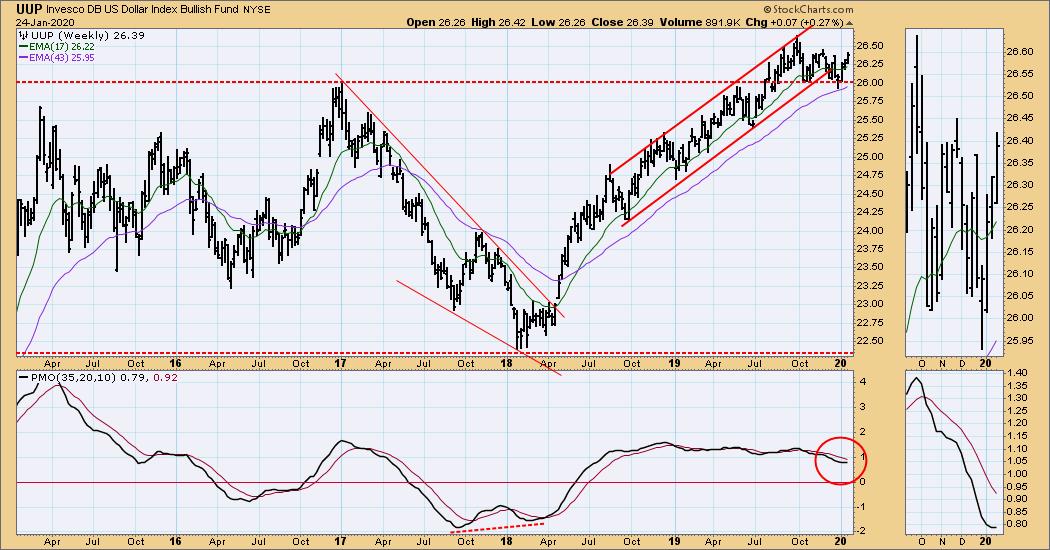
UUP Weekly Chart: Long-term horizontal support has held, and the weekly PMO is trying to turn up.
GOLD
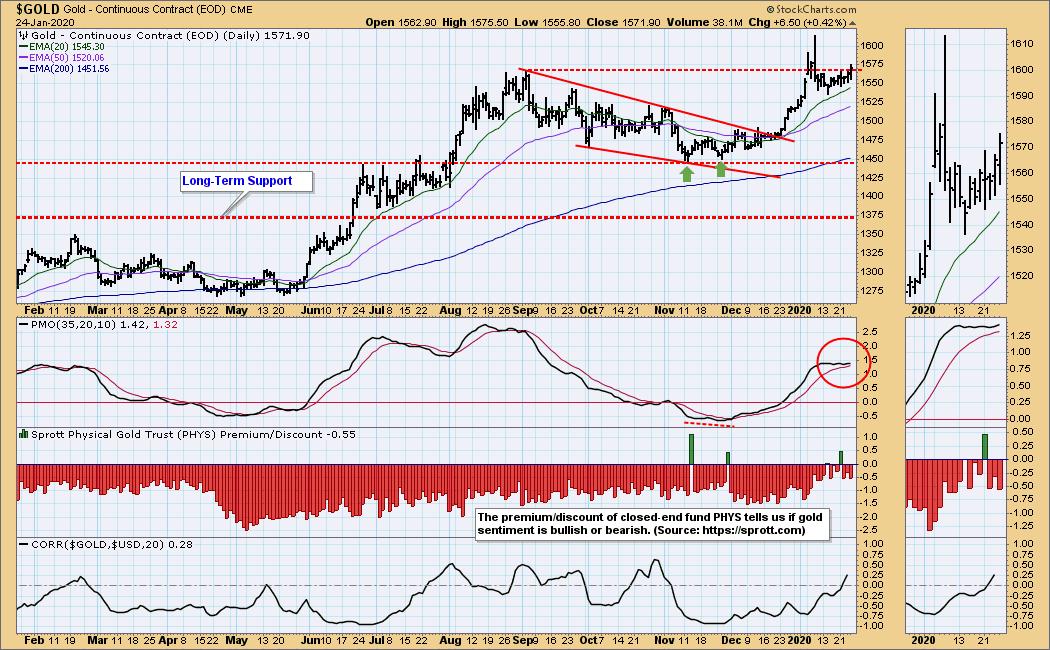
IT Trend Model: BUY as of 12/26/2019
LT Trend Model: BUY as of 1/8/2019
GOLD Daily Chart: Gold has squeaked just above the line of resistance drawn from the September top. The weekly PMO is not overbought yet, so a move higher doesn't strain the technicals. I note that sentiment continues to improve.
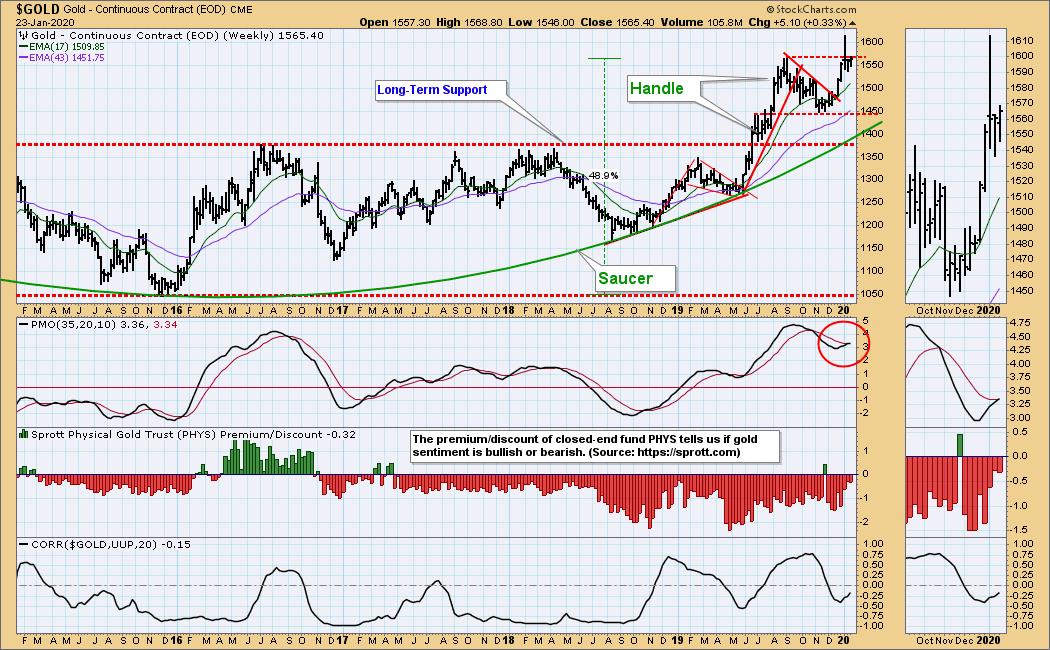
GOLD Weekly Chart: The saucer with handle formation has been a bullish sign for months. The breakout from the declining tops line drawn from the mid-year price top marks the end of the formation and signals a continuation of the rally. the weekly PMO has just crossed up through the signal line.
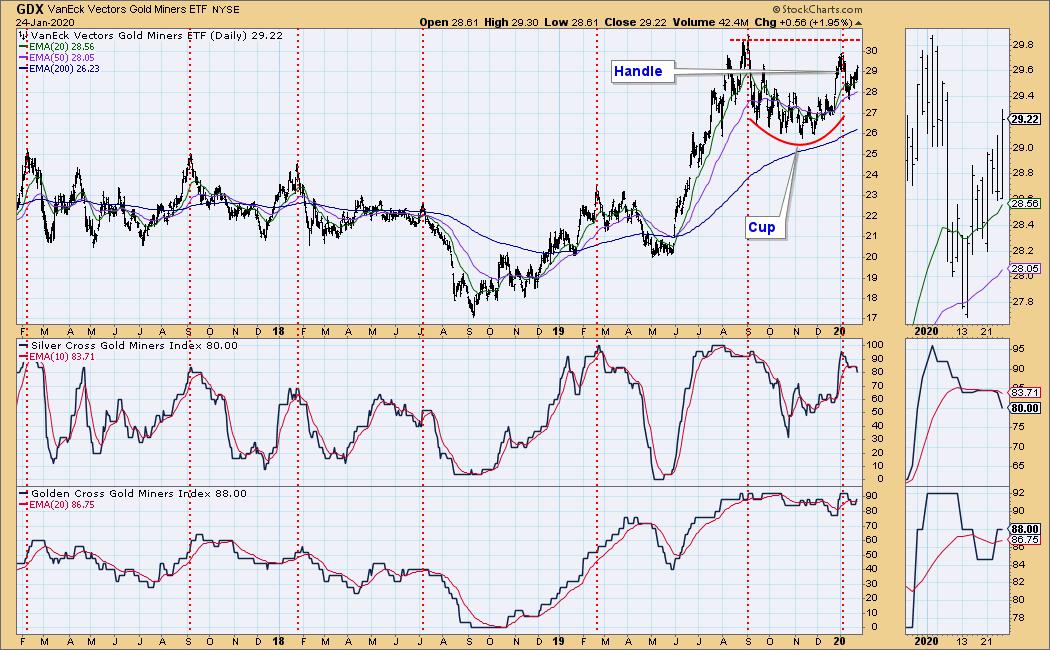
GOLD MINERS Golden and Silver Cross Indexes: Movement of these indicators tends to be volatile; however, a sustained price rally could change that.
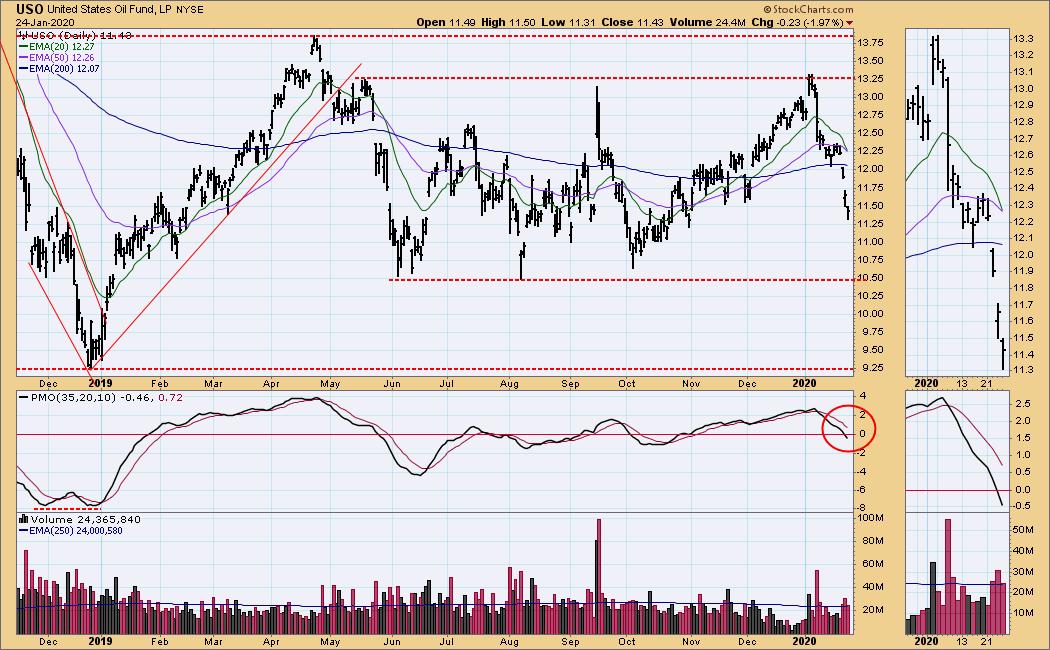
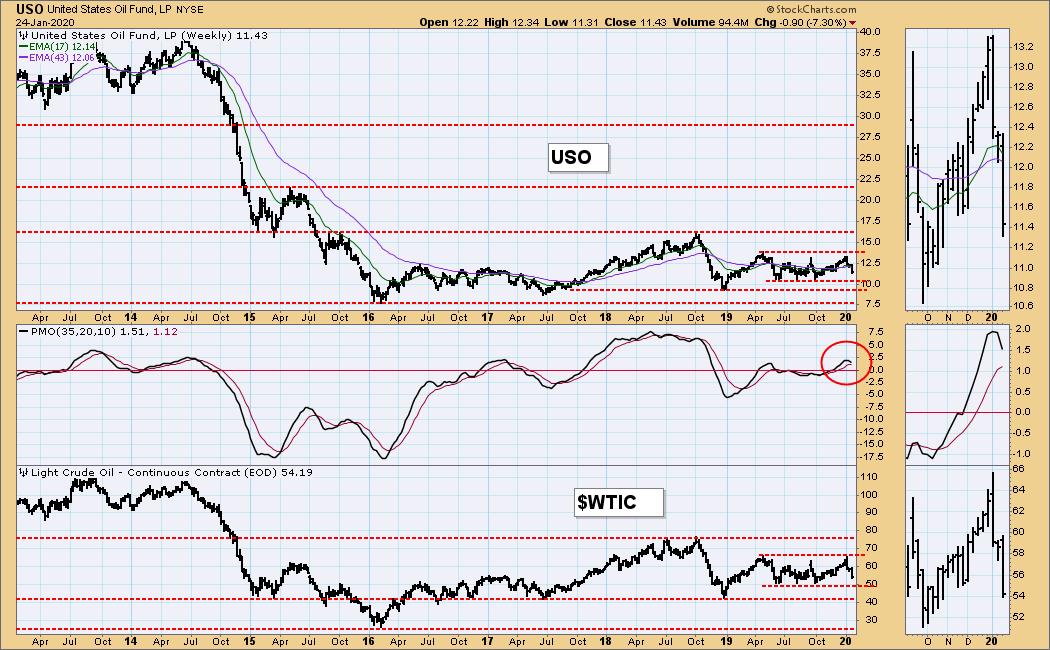
CRUDE OIL (USO)
IT Trend Model: NEUTRAL as of 1/24/2020
LT Trend Model: BUY as of 12/16/2019
USO Daily Chart: The USO 20EMA is just 0.01 above the 50EMA, so theoretically still a BUY; however, price is well below those two EMAs, and the 20EMA is virtually guaranteed to cross down through the 50EMA on Monday, so I am going to call it as a change to NEUTRAL effective today.
USO Weekly Chart: The price range for WTIC since the beginning of 2019 has been 51 to 66. Events could cause that range to be broken, but for now I look for it to hold.
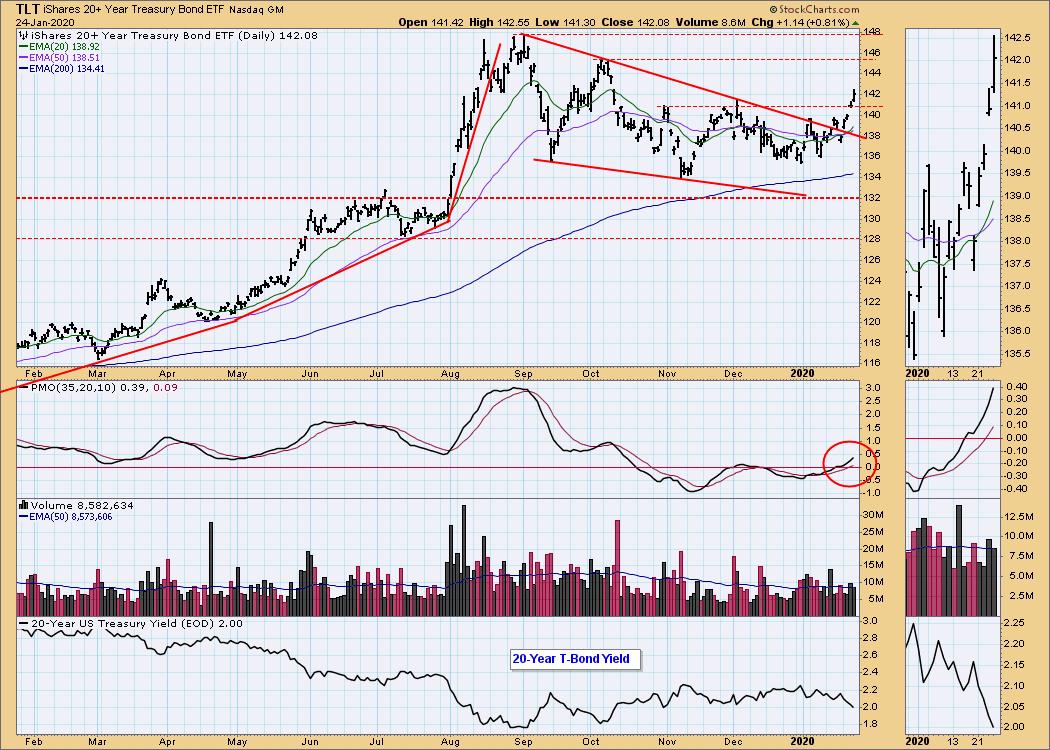
BONDS (TLT)
IT Trend Model: BUY as of 1/22/2020
LT Trend Model: BUY as of 1/2/2019
TLT Daily Chart: Last week's breakout failed on Monday, but TLT finished the week strong.
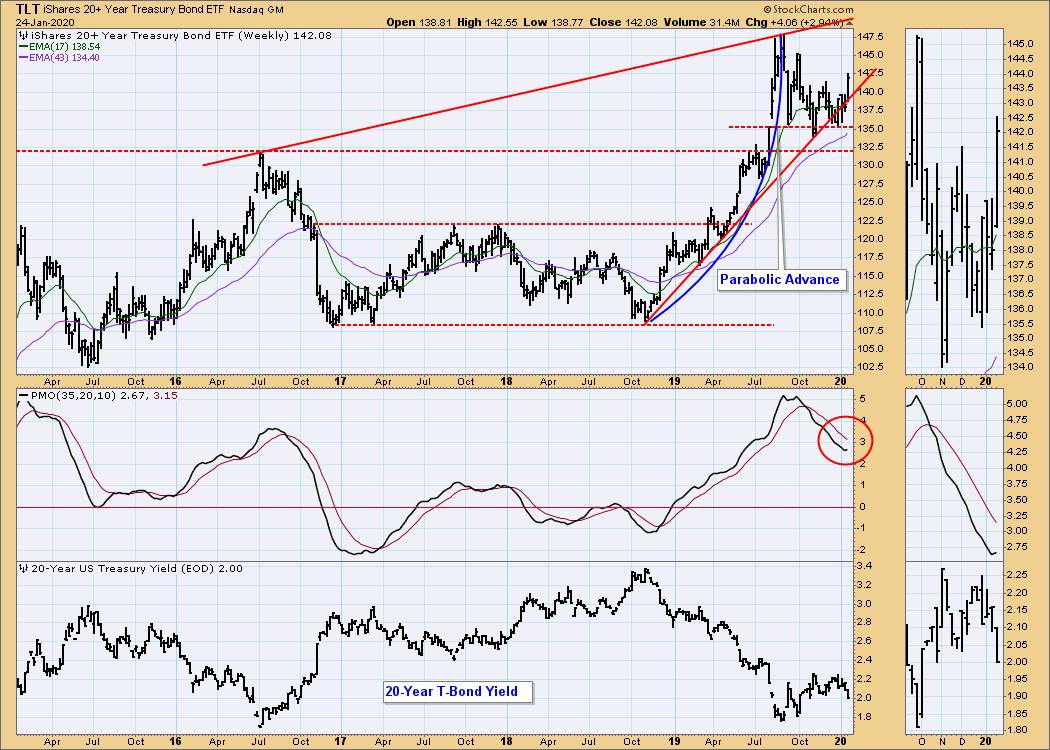
TLT Weekly Chart: In the Sectors section above, you'll notice that TLT had the biggest up move for the week, as people moved to safety. The weekly PMO has turned up.
**Don't miss any of the DecisionPoint commentaries! Go to the "Notify Me" box toward the end of this blog page to be notified as soon as they are published.**
Technical Analysis is a windsock, not a crystal ball.
Happy Charting! - Carl
NOTE: The signal status reported herein is based upon mechanical trading model signals, specifically, the DecisionPoint Trend Model. They define the implied bias of the price index based upon moving average relationships, but they do not necessarily call for a specific action. They are information flags that should prompt chart review. Further, they do not call for continuous buying or selling during the life of the signal. For example, a BUY signal will probably (but not necessarily) return the best results if action is taken soon after the signal is generated. Additional opportunities for buying may be found as price zigzags higher, but the trader must look for optimum entry points. Conversely, exit points to preserve gains (or minimize losses) may be evident before the model mechanically closes the signal.
Helpful DecisionPoint Links:
DecisionPoint Alert Chart List
DecisionPoint Golden Cross/Silver Cross Index Chart List
DecisionPoint Sector Chart List
Price Momentum Oscillator (PMO)
Swenlin Trading Oscillators (STO-B and STO-V)