
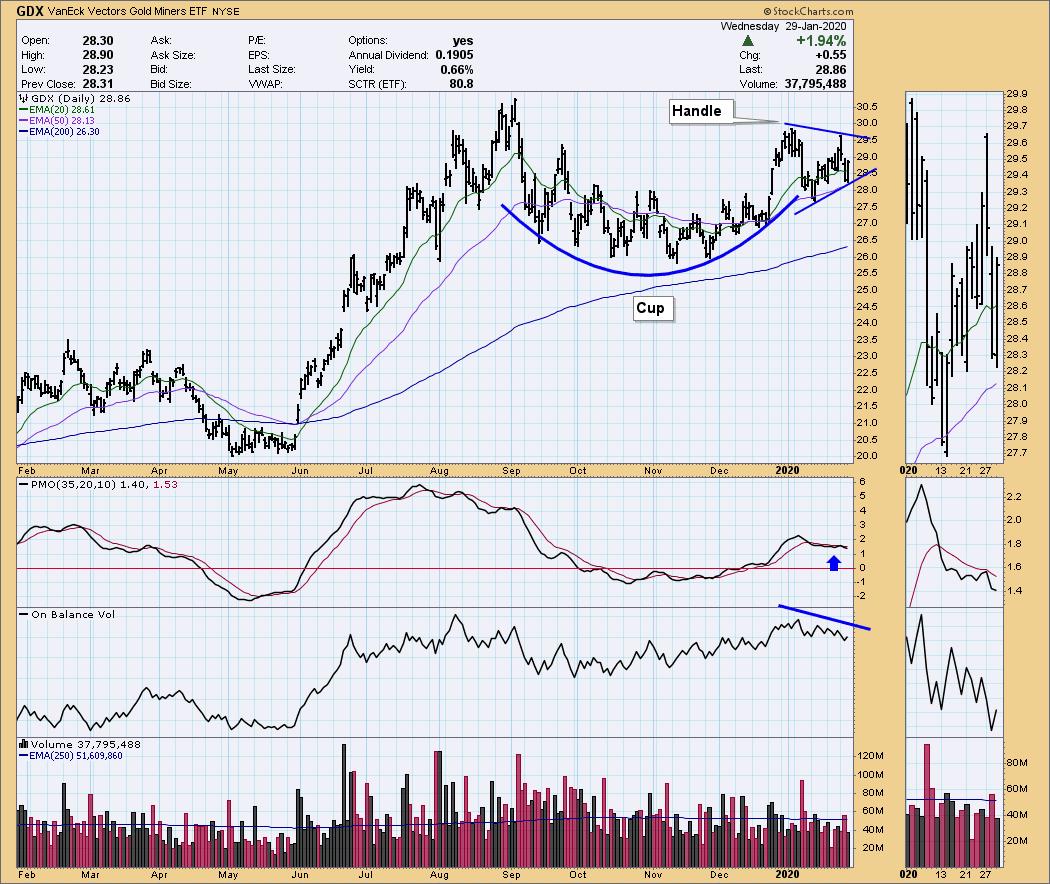
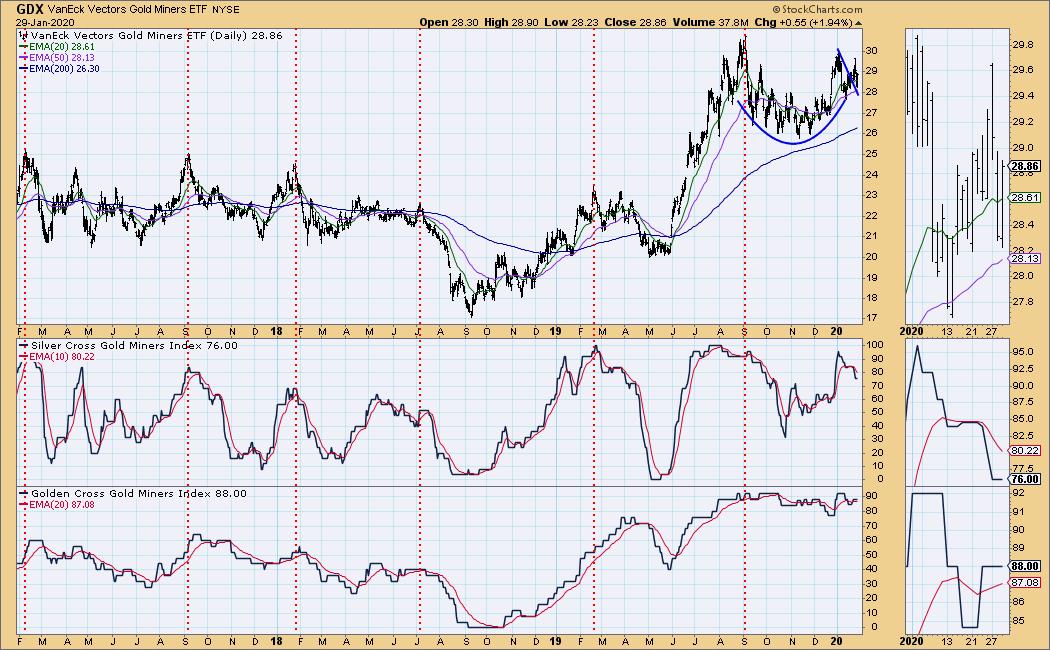
Once again, Gold Miners was the top performer from our ETF Tracker ChartList**. I wrote about Gold Miners in last weekend's ChartWatchers newsletter, here is a link. It's been a bumpy ride since GDX broke out from the "handle" of a "cup and handle" chart pattern. It looks to me as though the handle is simply maturing. The PMO is going the wrong direction. The OBV has declining tops, but that is confirming the declining tops on price. The handle has turned into a symmetrical triangle which is a continuation pattern which would suggest an upside breakout. GDX has to work its way out of this triangle first.
**(If you'd like to get this ChartList, it's available to StockCharts.com Extra subscribers and above. Download the DP Trend and Condition free ChartPack to find it.)
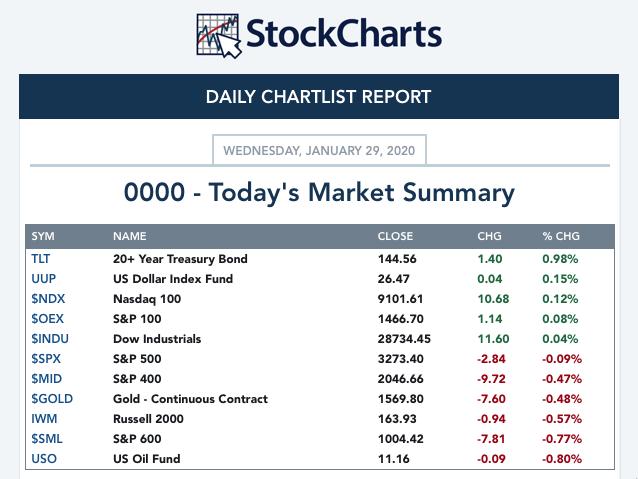
TODAY'S Broad Market Action:
On Friday, the DecisionPoint Alert Weekly Wrap presents an assessment of the trend and condition of the stock market (S&P 500), the U.S. Dollar, Gold, Crude Oil, and Bonds. Monday through Thursday the DecisionPoint Alert daily report is abbreviated and covers changes for the day.
Watch the latest episode of DecisionPoint on StockCharts TV's YouTube channel here!
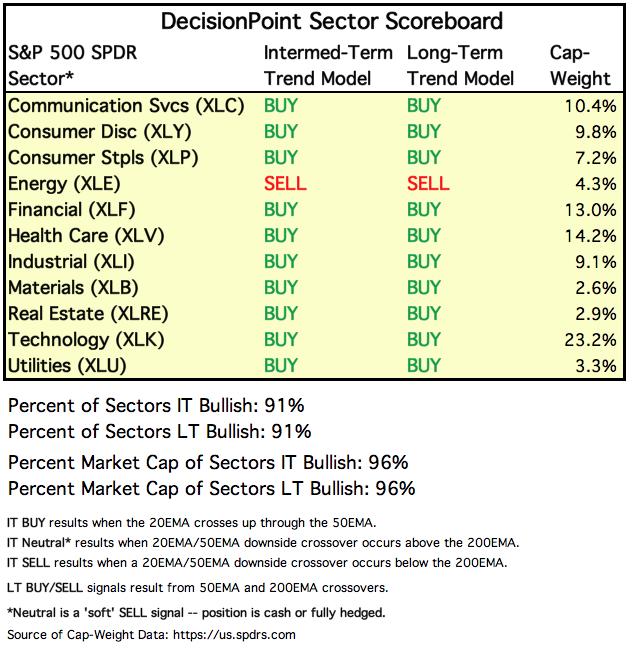
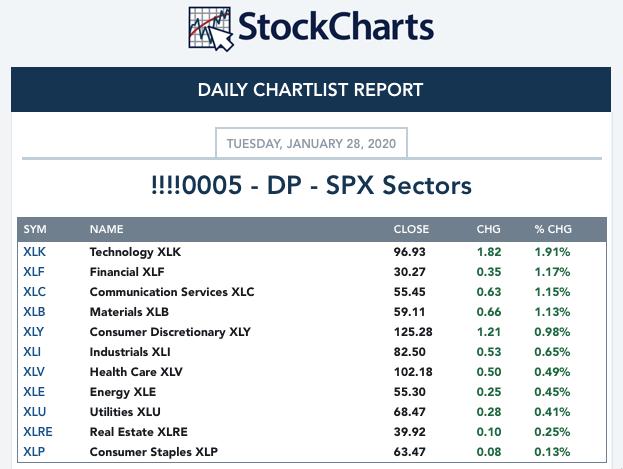
SECTORS
SIGNALS:
Each S&P 500 Index component stock is assigned to one, and only one, of 11 major sectors. This is a snapshot of the Intermediate-Term (Silver Cross) and Long-Term (Golden Cross) Trend Model signal status for those sectors.
TODAY'S RESULTS:
STOCKS
IT Trend Model: BUY as of 9/6/2019
LT Trend Model: BUY as of 2/26/2019
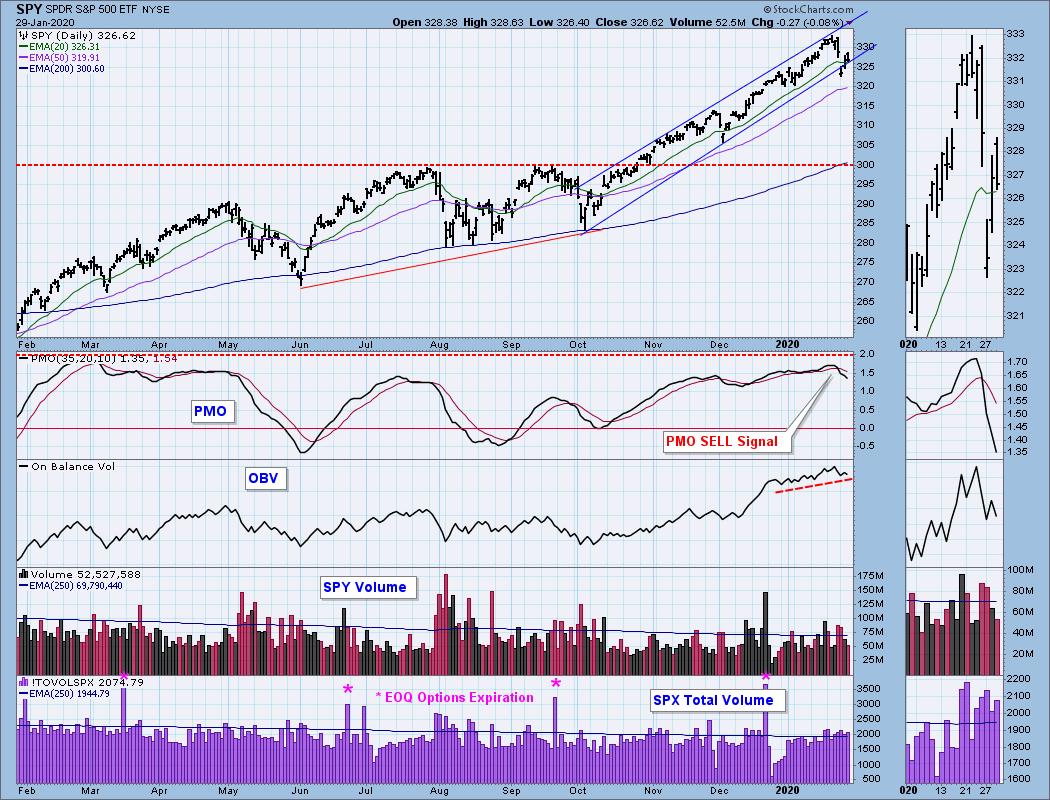
SPY Daily Chart: Well price is back up against the rising bottoms trendline that forms the bottom of a rising wedge (although it is looking more like a rising trend channel now). The PMO suggests a decline or consolidation is on its way to work out its overbought condition. Volume was above average.
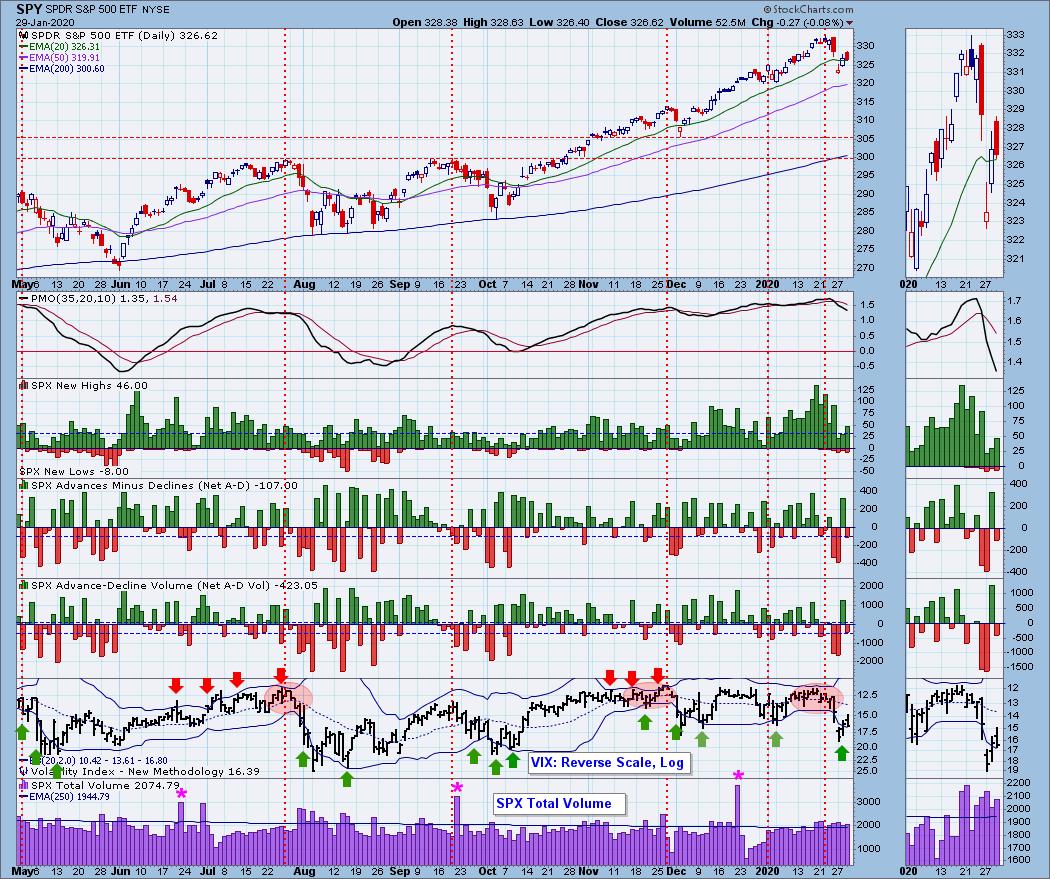
Climactic Market Indicators: Not seeing climactic readings today. The VIX is back within the Bollinger Band and is rising. This suggests a bit more upside or sideways consolidation.
Short-Term Market Indicators: A tick up yesterday and a resumption of the decline today on the STOs. Not good for the short term. They are oversold, so we could see a reversal soon that would make them bullish.
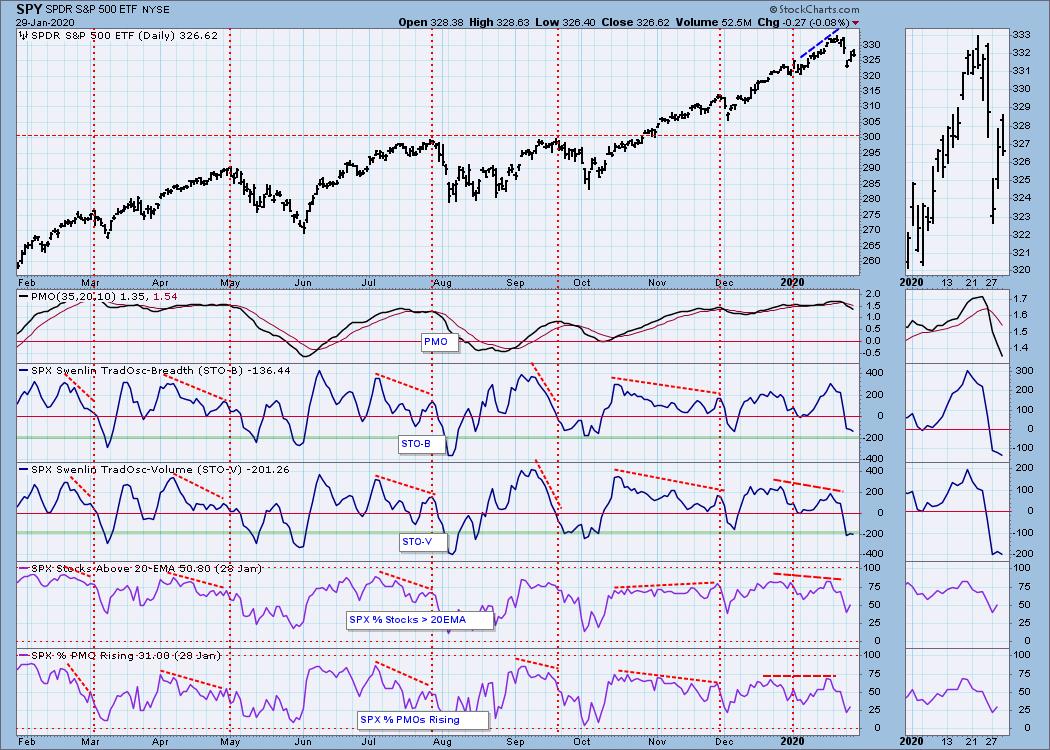
Intermediate-Term Market Indicators: Still dropping fast and they are not oversold. They portend lower prices in the intermediate term.
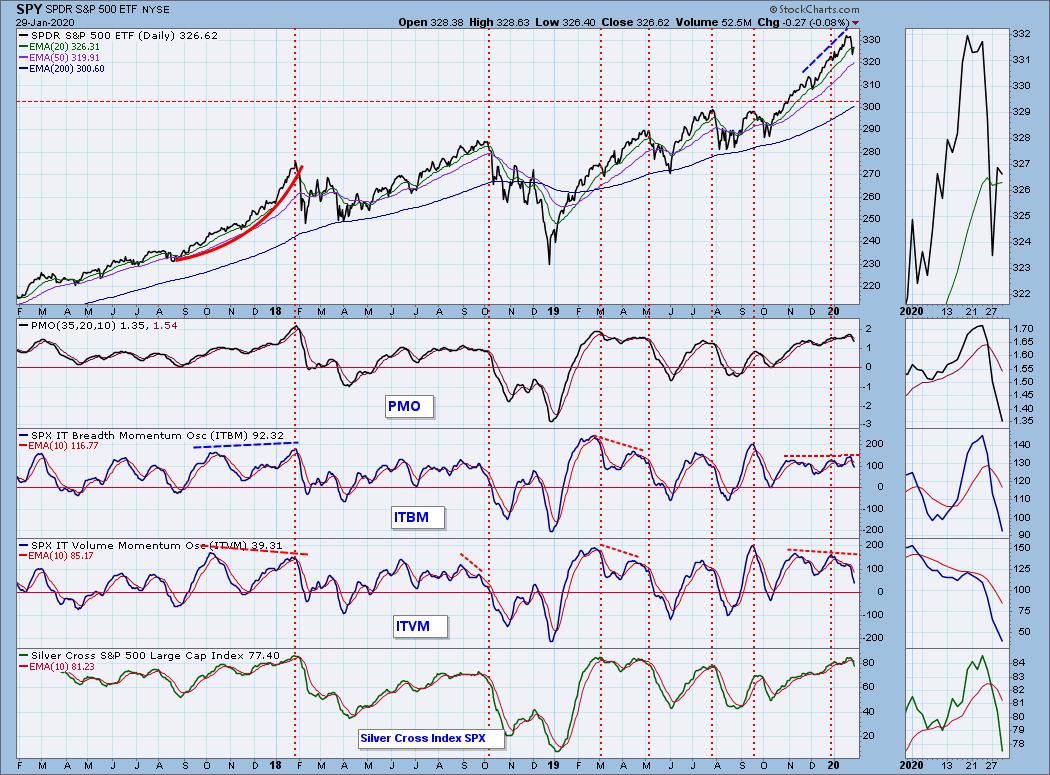
The Silver Cross Index continues to decline and now the Golden Cross Index is making a run for its signal line. Bad news in short and intermediate term.
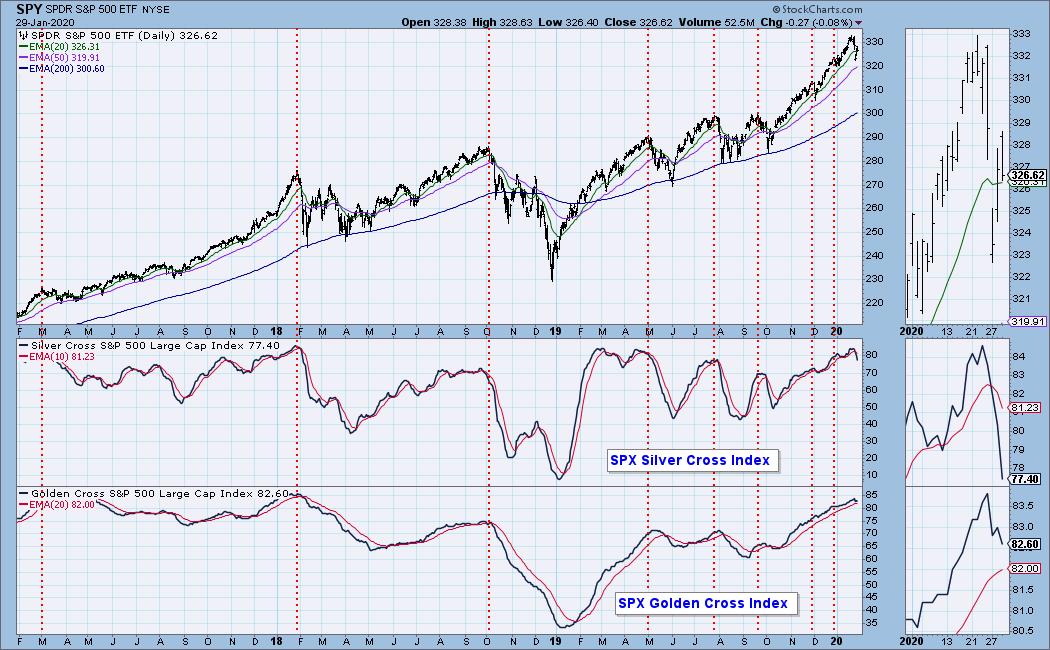
CONCLUSION: The trend of the market is up and the condition is overbought. Intermediate-term indicators are the problem here with the Silver Cross Index, ITBM and ITVM. In the short term, the VIX suggests some upside movement and the STOs are oversold which means their bottom may come in soon.
(Not a Diamonds subscriber? Add it to your DP Alert subscription and get a discount! Contact support@decisionpoint.com for your limited time coupon code!)
DOLLAR (UUP)
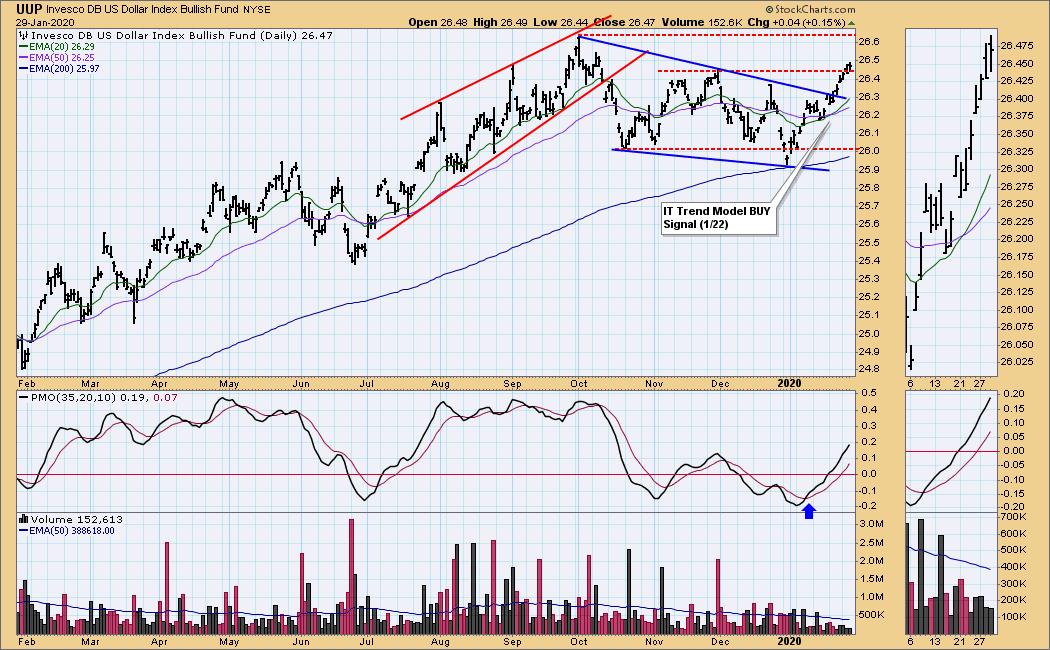
IT Trend Model: BUY as of 1/22/2020
LT Trend Model: BUY as of 5/25/2018
UUP Daily Chart: Bullish Dollar chart. Today price traded above overhead resistance (new support) and closed there. Given the positive PMO and IT Trend Model BUY signal, I'm looking for a test of the October top.
GOLD
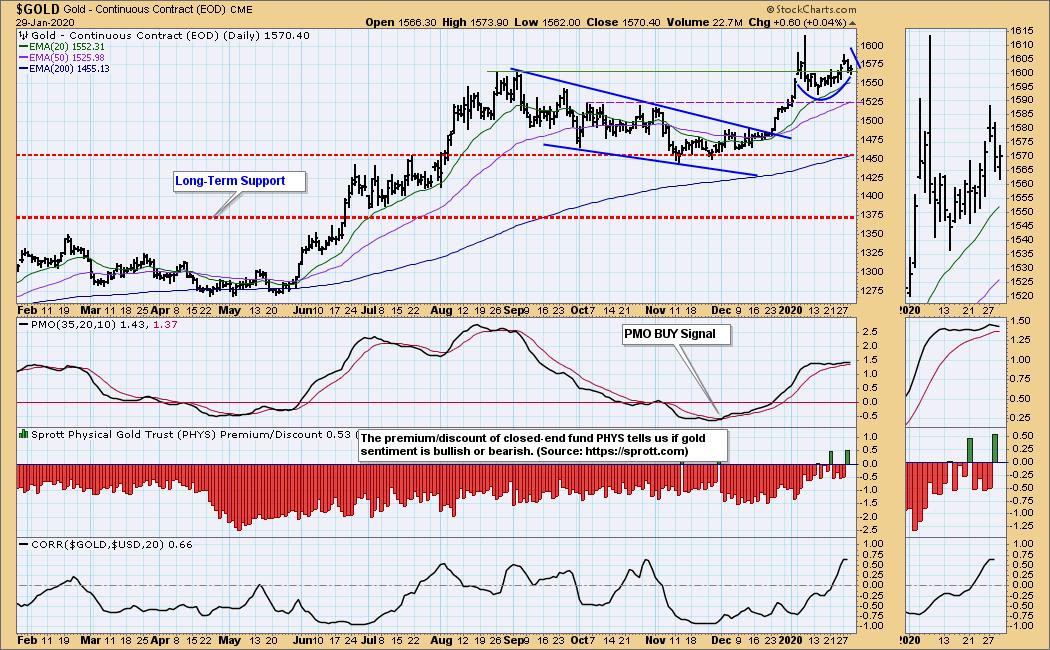
IT Trend Model: BUY as of 12/26/2019
LT Trend Model: BUY as of 1/8/2019
GOLD Daily Chart: The handle on the cup for Gold is maturing. Price closed above support. The PMO is now turning lower, but overall it is flat and I'm okay with that. I think the Dollar will continue to rise which is usually a problem for Gold, but with the positive correlation right now, it is doable.
GOLD MINERS Golden and Silver Cross Indexes: I'll be looking for the Silver Cross Index to turn up soon given my bullish outlook on Gold Miners. If it begins to slide lower again, I'll have to rethink my position on GDX.
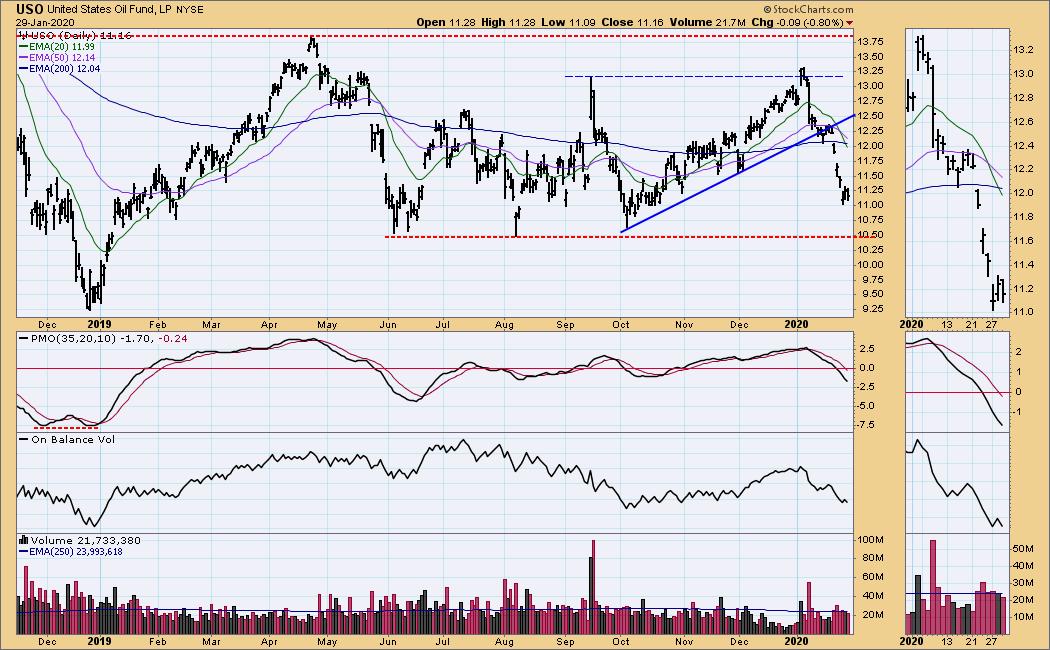
CRUDE OIL (USO)
IT Trend Model: Neutral as of 1/27/2020
LT Trend Model: BUY as of 12/16/2019
USO Daily Chart: USO would really like to bottom here, but indicators and trend are so bearish, I think it still will make a move down to $10.50.
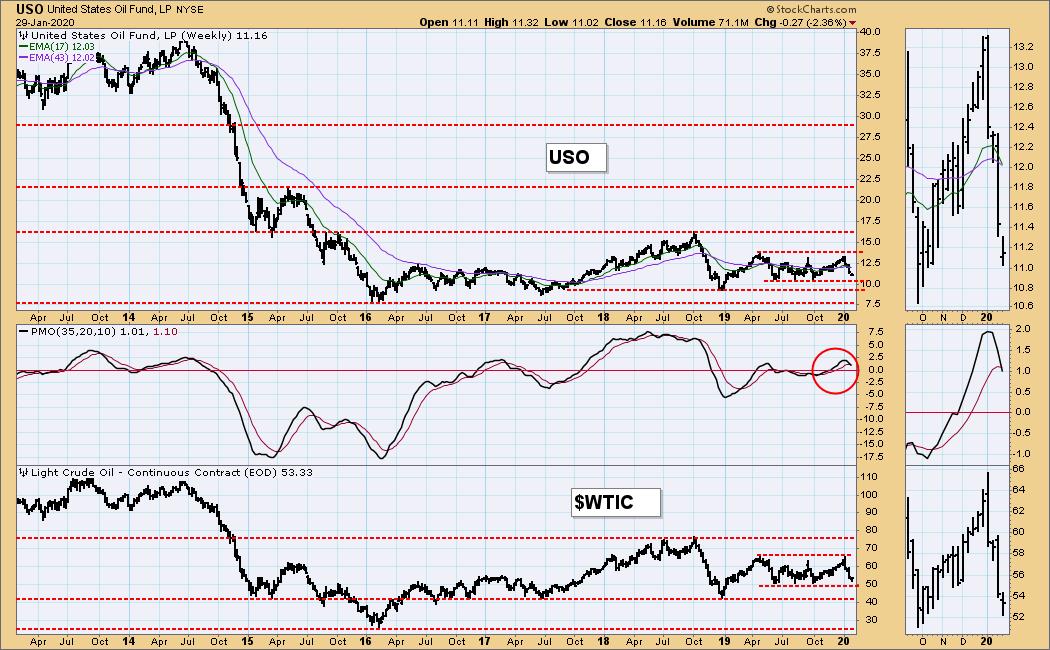
The weekly chart hasn't gone final as it isn't after the close on Friday. However, a weekly PMO SELL signal is waiting. Note that $10.50 isn't really the strongest support level, $8.50 or $9 is. There's more downside left.
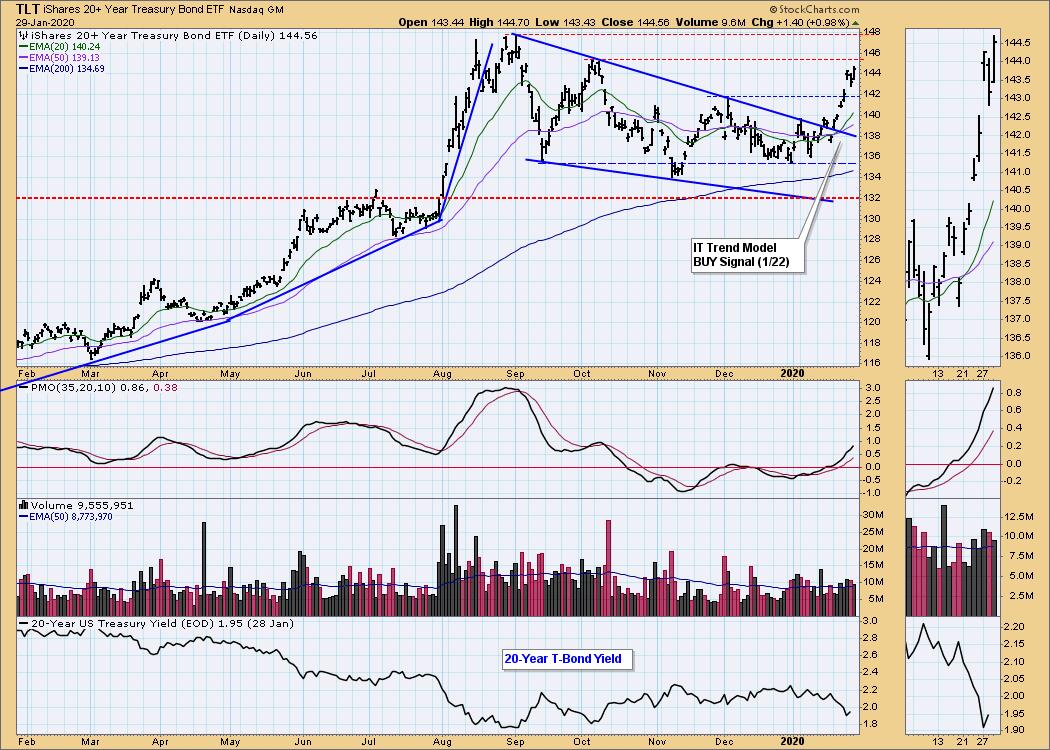
BONDS (TLT)
IT Trend Model: BUY as of 1/22/2020
LT Trend Model: BUY as of 1/2/2019
TLT Daily Chart: TLT has about reached the next level of overhead resistance. Yields are nearing lows for the year so TLT could run out of steam at the August top. For now, we wait for that area of resistance to arrive.
Have you subscribed the DecisionPoint Diamonds yet? You can add it at a discount! Contact support@decisionpoint.com for information on how to save on Diamonds!
Technical Analysis is a windsock, not a crystal ball.
Happy Charting! - Erin
Email: erin@decisionpoint.com

Erin Swenlin will be presenting at the The MoneyShow Las Vegas May 11-13, 2020! You'll have an opportunity to meet Erin and discuss the latest DecisionPoint news and Diamond Scans. The conference is free to attend or view online!
NOTE: The signal status reported herein is based upon mechanical trading model signals, specifically, the DecisionPoint Trend Model. They define the implied bias of the price index based upon moving average relationships, but they do not necessarily call for a specific action. They are information flags that should prompt chart review. Further, they do not call for continuous buying or selling during the life of the signal. For example, a BUY signal will probably (but not necessarily) return the best results if action is taken soon after the signal is generated. Additional opportunities for buying may be found as price zigzags higher, but the trader must look for optimum entry points. Conversely, exit points to preserve gains (or minimize losses) may be evident before the model mechanically closes the signal.
Helpful DecisionPoint Links (Can Be Found on DecisionPoint.com Links Page):
DecisionPoint Shared ChartList and DecisionPoint Chart Gallery
Price Momentum Oscillator (PMO)
Swenlin Trading Oscillators (STO-B and STO-V)