
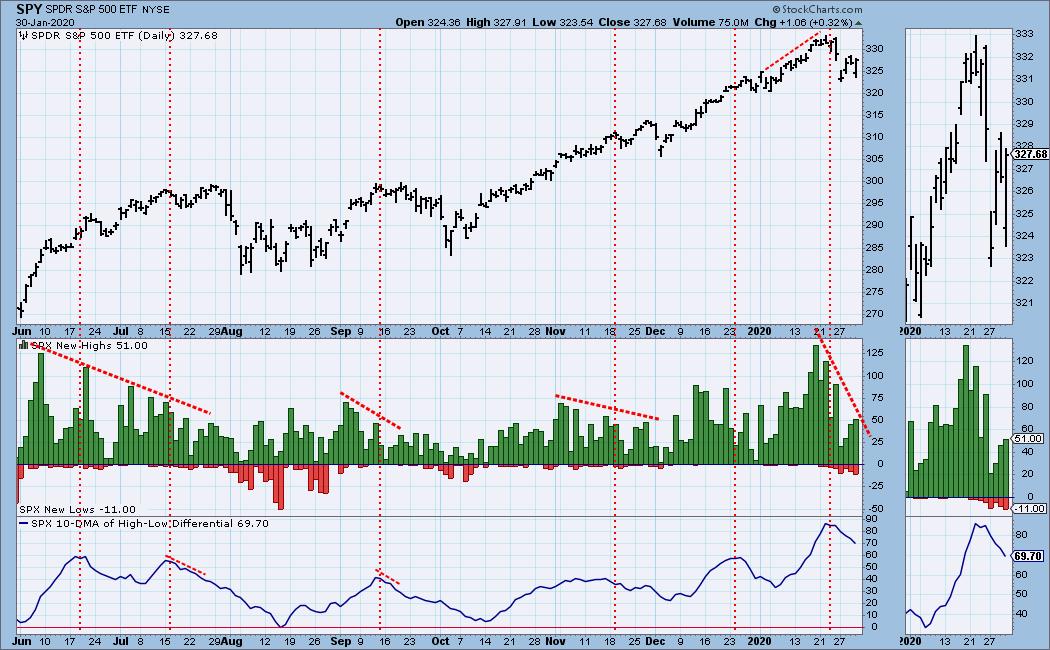
I presented this chart a couple of weeks ago in the ChartWatchers Newsletter showing the bullish bottom on the New High-New Low Differential 10-MA. Typically they are followed by higher prices. Unfortunately when you look at the chart today, we can see that it has topped in overbought territory. I've marked with vertical lines the tops on this indicator. It is a fairly good predictor of market tops. The last top didn't amount to much as far as a decline, but we did see some choppy sideways trading after.
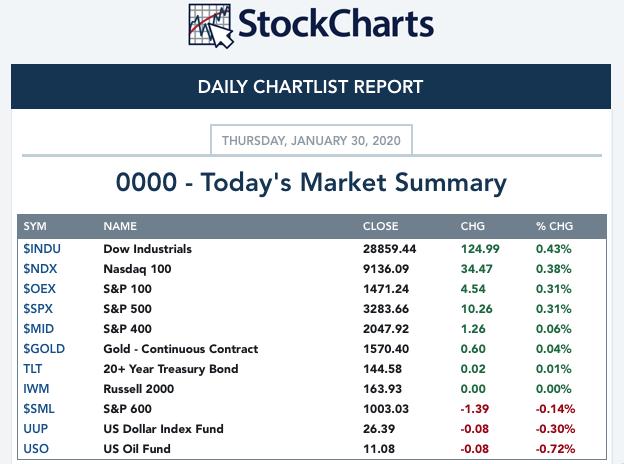
TODAY'S Broad Market Action:
On Friday, the DecisionPoint Alert Weekly Wrap presents an assessment of the trend and condition of the stock market (S&P 500), the U.S. Dollar, Gold, Crude Oil, and Bonds. Monday through Thursday the DecisionPoint Alert daily report is abbreviated and covers changes for the day.
Watch the latest episode of DecisionPoint on StockCharts TV's YouTube channel here!
SECTORS
SIGNALS:
Each S&P 500 Index component stock is assigned to one, and only one, of 11 major sectors. This is a snapshot of the Intermediate-Term (Silver Cross) and Long-Term (Golden Cross) Trend Model signal status for those sectors.
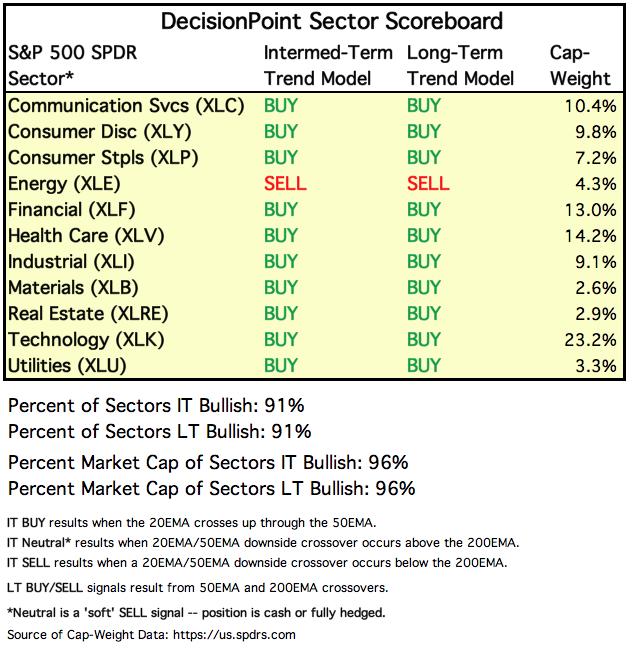
TODAY'S RESULTS:
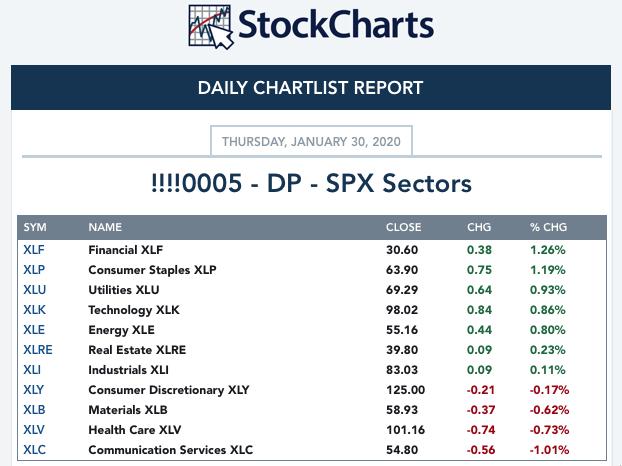
STOCKS
IT Trend Model: BUY as of 9/6/2019
LT Trend Model: BUY as of 2/26/2019
SPY Daily Chart: I've decided to use Monday's low to draw the rising bottoms trendline. When I do this and 'drag' it to match price tops, it fits perfectly. I think we have a rising trend channel in play. Price bounce off it and closed near the top of the range today. Total volume was above average on this price rise which is bullish. However, I can't ignore the PMO SELL signal and its decline.
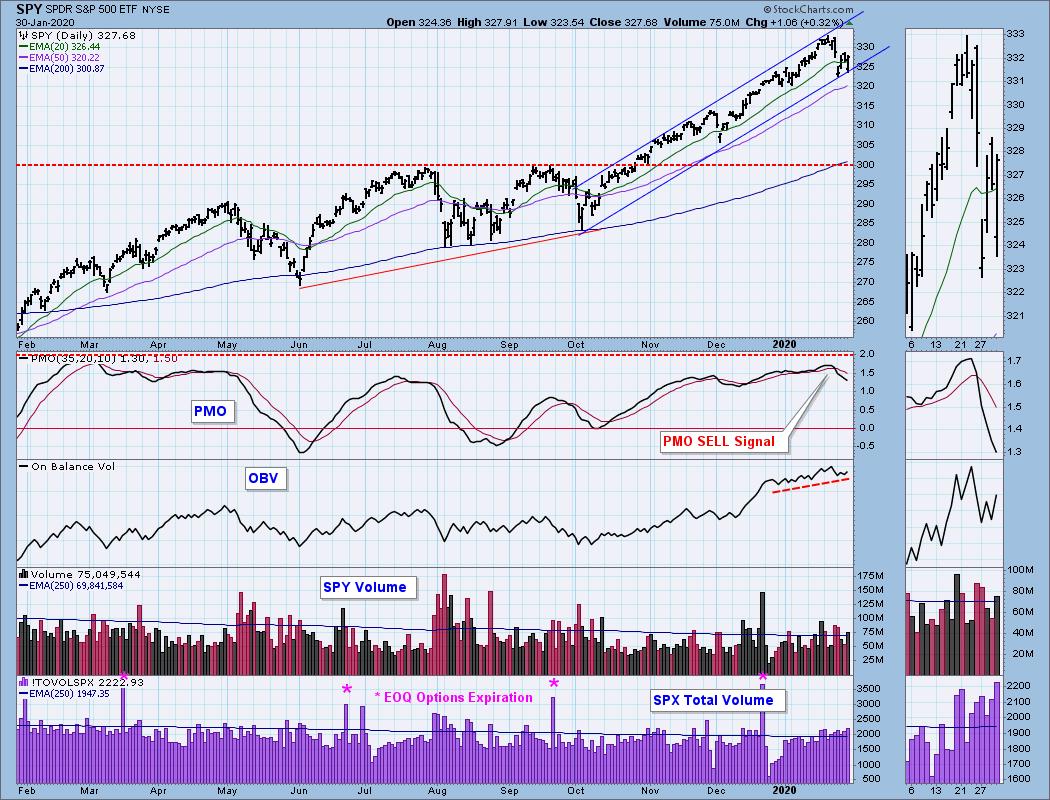
Climactic Market Indicators: Not much to glean from today's climactic indicators. I do note that VIX is still penetrating the bottom Bollinger Band and that is short-term bullish.
Short-Term Market Indicators: Very indecisive indicators. The STOs are trying to bottom in oversold territory which is positive, they just haven't logged a bottom and that is bearish. We are starting to see some positive movement on Stocks above their 20/50-EMAs which is bullish.
Intermediate-Term Market Indicators: Nothing good on this chart yet. All IT indicators are in a steady decline and are not oversold. They suggest we should see a breakdown of the rising trend.
The Silver Cross Index is ugly and getting uglier. The Golden Cross Index is trying to find a bottom, but no real luck yet.
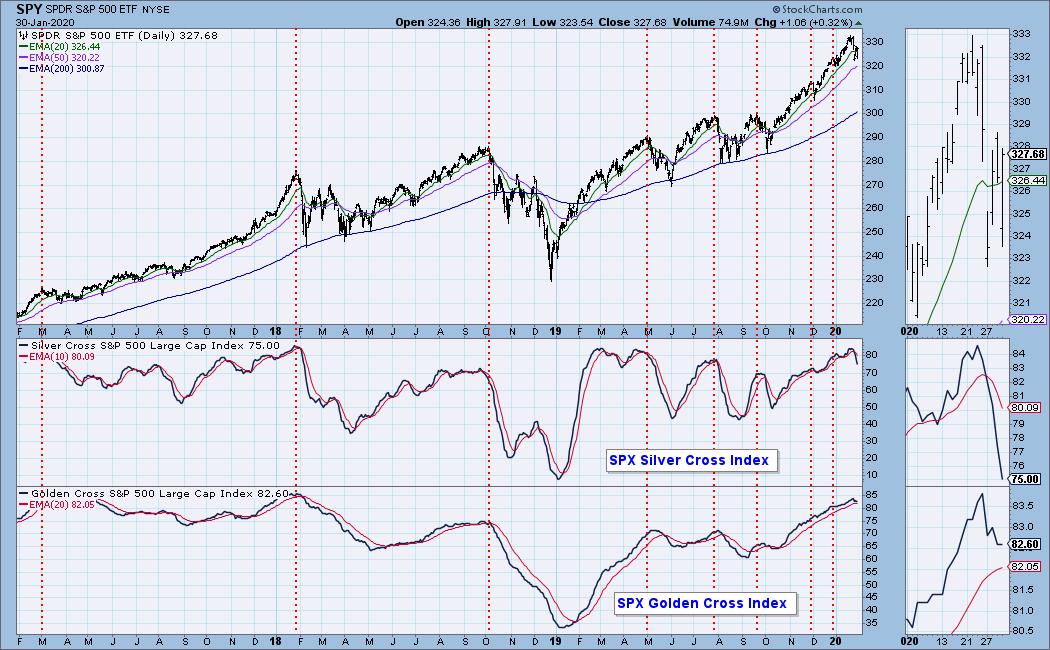
CONCLUSION: The trend of the market is up and the condition is overbought. The short-term outlook is still fairly bullish given the oversold STOs trying to turn back up in oversold territory and a VIX that is still rather high. IT indicators are a big problem. The deterioration of the Silver Cross Index in particular is quite bearish.
(Not a Diamonds subscriber? Add it to your DP Alert subscription and get a discount! Contact support@decisionpoint.com for your limited time coupon code!)
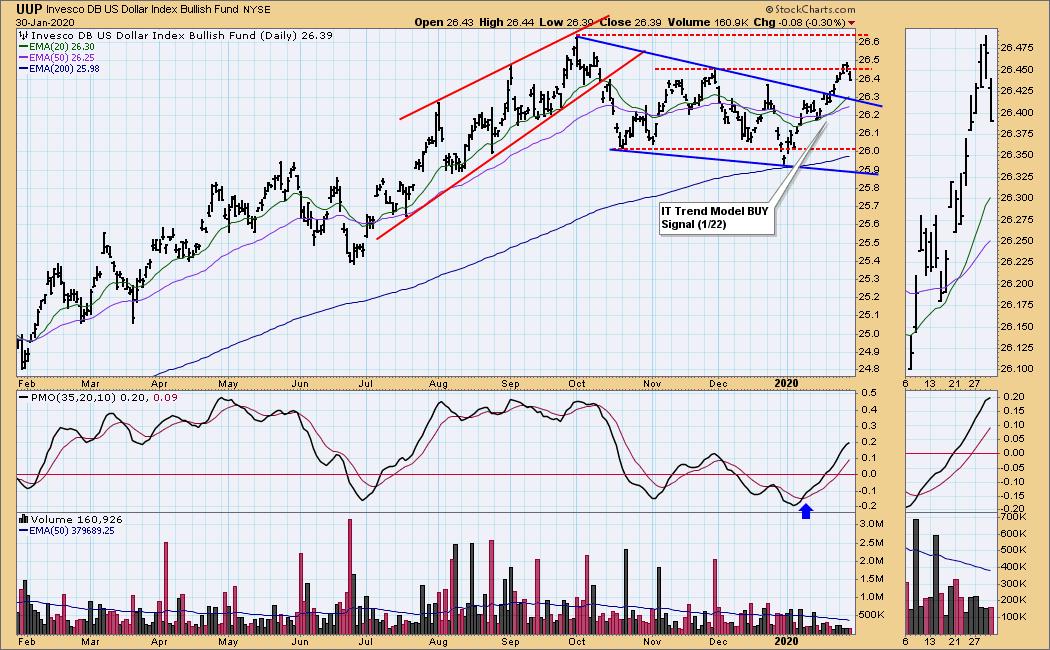
DOLLAR (UUP)
IT Trend Model: BUY as of 1/22/2020
LT Trend Model: BUY as of 5/25/2018
UUP Daily Chart: It's been a steep rising trend out of the bullish falling wedge. It has hit some resistance and today pulled back. The PMO and IT Trend Model BUY signals keep me bullish on the Dollar.
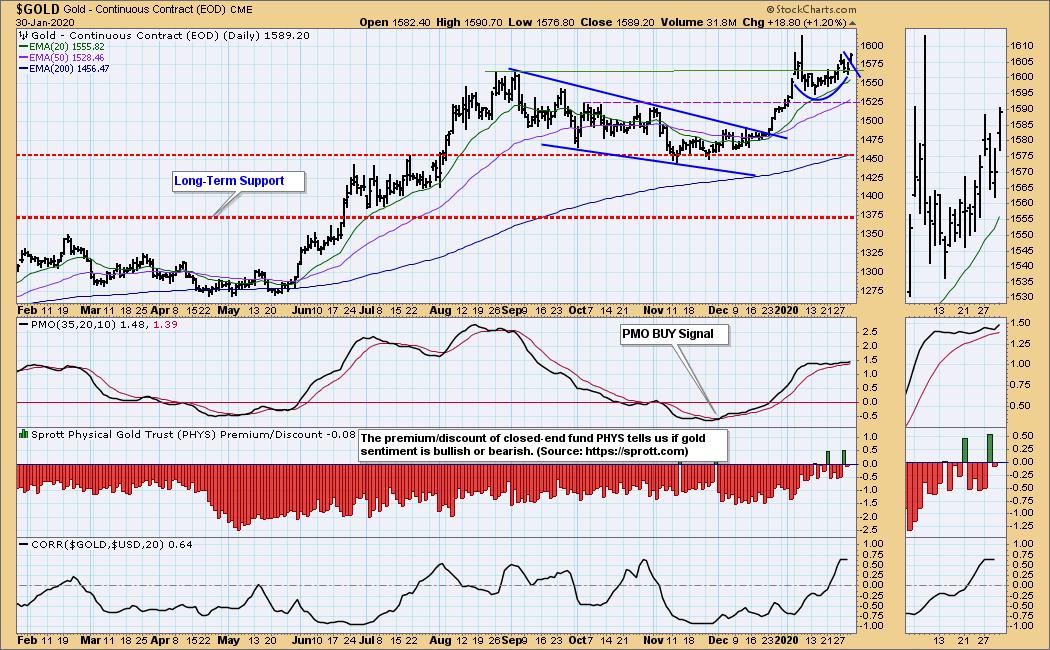
GOLD
IT Trend Model: BUY as of 12/26/2019
LT Trend Model: BUY as of 1/8/2019
GOLD Daily Chart: The handle of the cup may be in. Today Gold moved up a whopping 1.20%. Carl and I both like Gold and I have even suggested a few related stocks in the DP Diamonds this week. The PMO flattened and is ready to move back up, bottoming above its signal line.
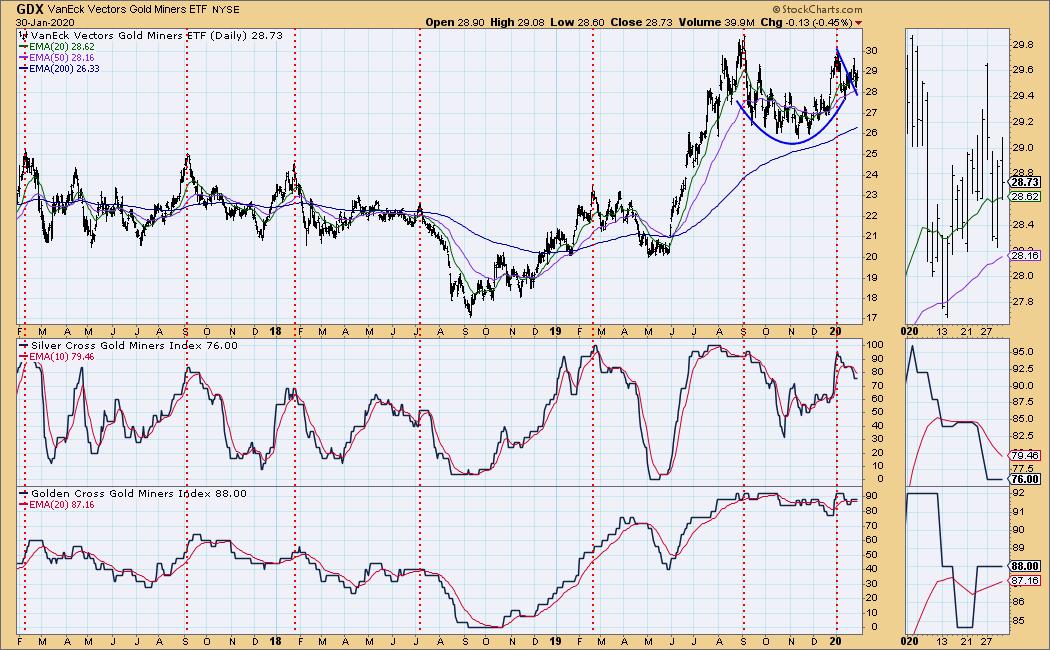
GOLD MINERS Golden and Silver Cross Indexes: The Silver Cross Index appears ready to put in a bottom. The Gold Cross was flat today, but it did just have a positive crossover. I continue to be bullish on Gold Miners. If Gold presses higher it could be a nice tailwind for these stocks.
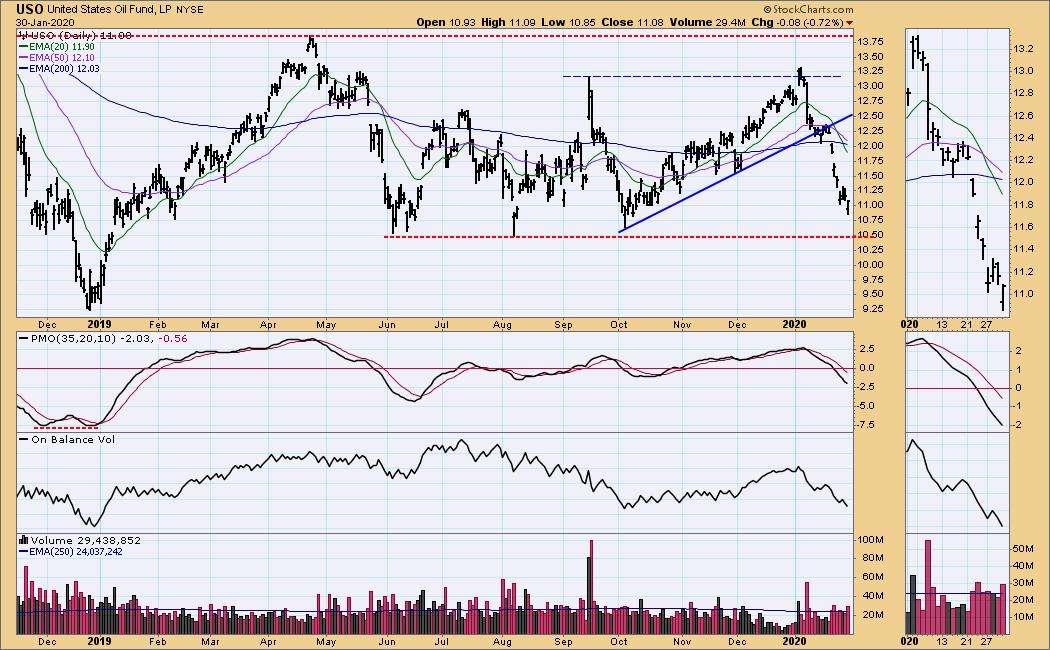
CRUDE OIL (USO)
IT Trend Model: Neutral as of 1/27/2020
LT Trend Model: BUY as of 12/16/2019
USO Daily Chart: As I suspected, this week's bottom didn't hold. I'm still looking for a move down to support at $10.50.
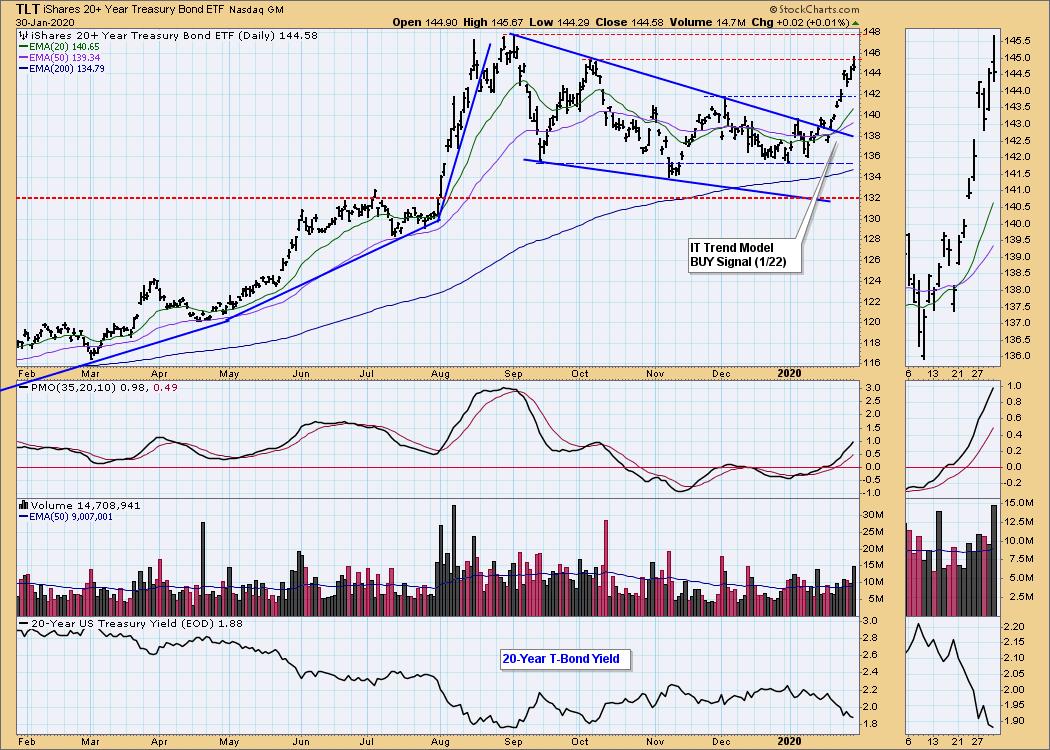
BONDS (TLT)
IT Trend Model: BUY as of 1/22/2020
LT Trend Model: BUY as of 1/2/2019
TLT Daily Chart: Overhead resistance is holding up for now. Yields are nearing annual lows. I still believe TLT will at least reach its high for the past year.
Have you subscribed the DecisionPoint Diamonds yet? You can add it at a discount! Contact support@decisionpoint.com for information on how to save on Diamonds!
Technical Analysis is a windsock, not a crystal ball.
Happy Charting! - Erin
Email: erin@decisionpoint.com

Erin Swenlin will be presenting at the The MoneyShow Las Vegas May 11-13, 2020! You'll have an opportunity to meet Erin and discuss the latest DecisionPoint news and Diamond Scans. The conference is free to attend or view online!
NOTE: The signal status reported herein is based upon mechanical trading model signals, specifically, the DecisionPoint Trend Model. They define the implied bias of the price index based upon moving average relationships, but they do not necessarily call for a specific action. They are information flags that should prompt chart review. Further, they do not call for continuous buying or selling during the life of the signal. For example, a BUY signal will probably (but not necessarily) return the best results if action is taken soon after the signal is generated. Additional opportunities for buying may be found as price zigzags higher, but the trader must look for optimum entry points. Conversely, exit points to preserve gains (or minimize losses) may be evident before the model mechanically closes the signal.
Helpful DecisionPoint Links (Can Be Found on DecisionPoint.com Links Page):
DecisionPoint Shared ChartList and DecisionPoint Chart Gallery
Price Momentum Oscillator (PMO)
Swenlin Trading Oscillators (STO-B and STO-V)