
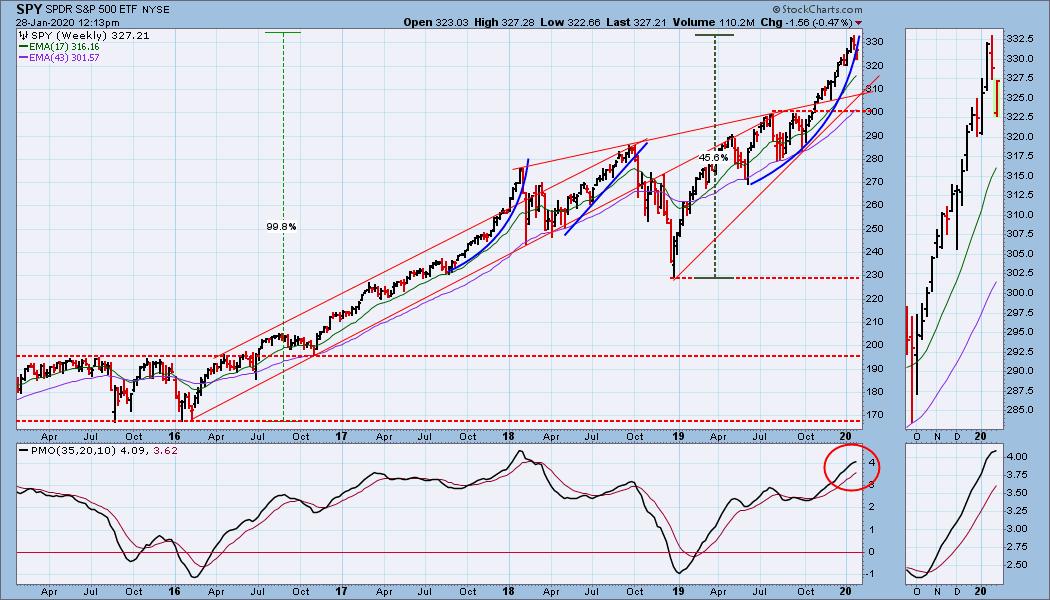
Lots to talk about today! I'll be doing DP Diamonds tomorrow so I can spend a little more time on today's DP Alert. Carl sent me the chart below and pointed out that the parabolic advance he has been watching has now officially broken down on the weekly chart. The weekly PMO is also beginning to top in overbought territory. The breakdown isn't "decisive" yet, meaning it hasn't broken down 3% or more, but this could be an early warning signal for us to prepare for a correction. The $300 support level on the SPY looks strong, but it is a long way down.
TODAY'S Broad Market Action:
On Friday, the DecisionPoint Alert Weekly Wrap presents an assessment of the trend and condition of the stock market (S&P 500), the U.S. Dollar, Gold, Crude Oil, and Bonds. Monday through Thursday the DecisionPoint Alert daily report is abbreviated and covers changes for the day.
Watch the latest episode of DecisionPoint on StockCharts TV's YouTube channel here!
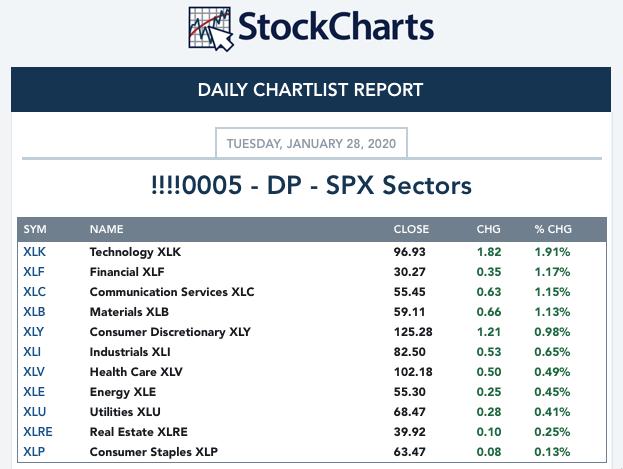
SECTORS
SIGNALS:
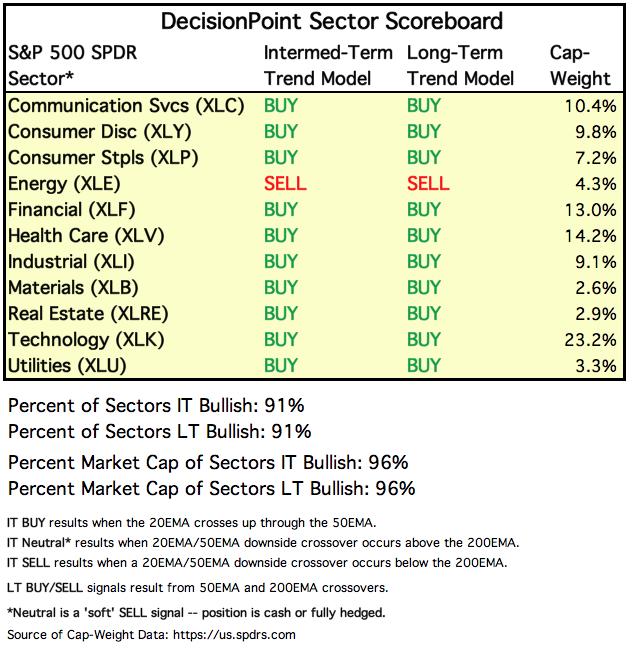
Each S&P 500 Index component stock is assigned to one, and only one, of 11 major sectors. This is a snapshot of the Intermediate-Term (Silver Cross) and Long-Term (Golden Cross) Trend Model signal status for those sectors.
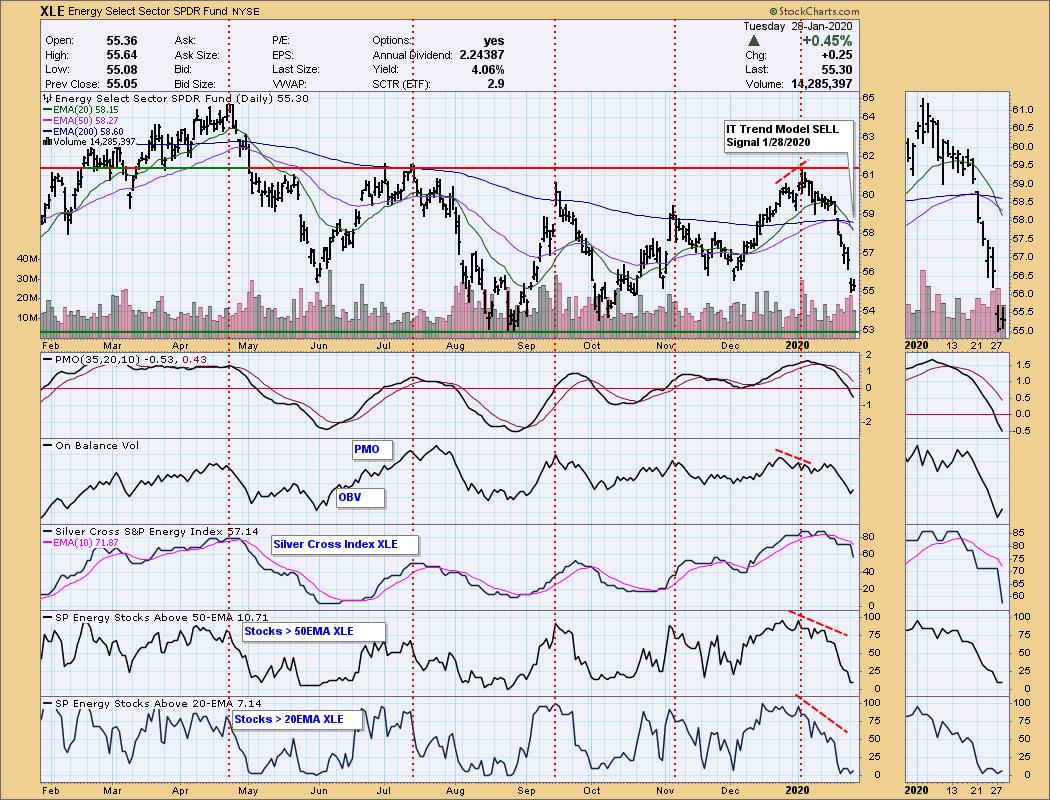
As noted in the title, XLE triggered an IT Trend Model SELL signal today. This signal is triggered when the 20-EMA drops below the 50-EMA while the 50-EMA is below the 200-EMA. That's exactly what we're seeing here. The Silver Cross Index was already warning us when it topped earlier this month. You can see the steep drop off on XLE Stocks Above their 50/200-EMAs. Visualize this: only 10% stocks in XLE have their price above the 50-EMA and only 7% have their price above their 20-EMAs! This is a seriously depressed sector. Sadly strong support isn't available until price hits $53.
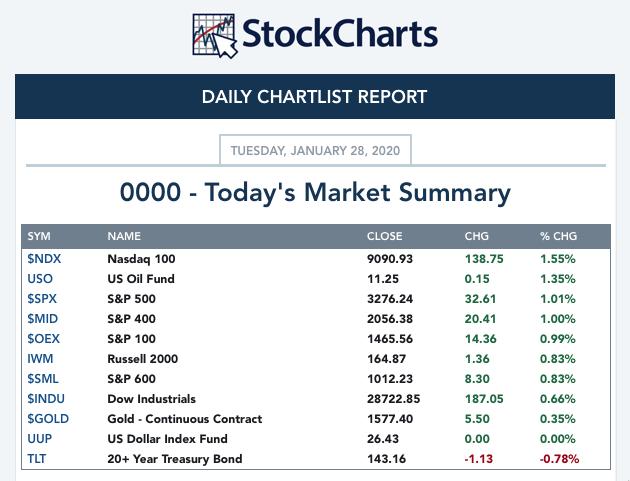
TODAY'S RESULTS:
STOCKS
IT Trend Model: BUY as of 9/6/2019
LT Trend Model: BUY as of 2/26/2019
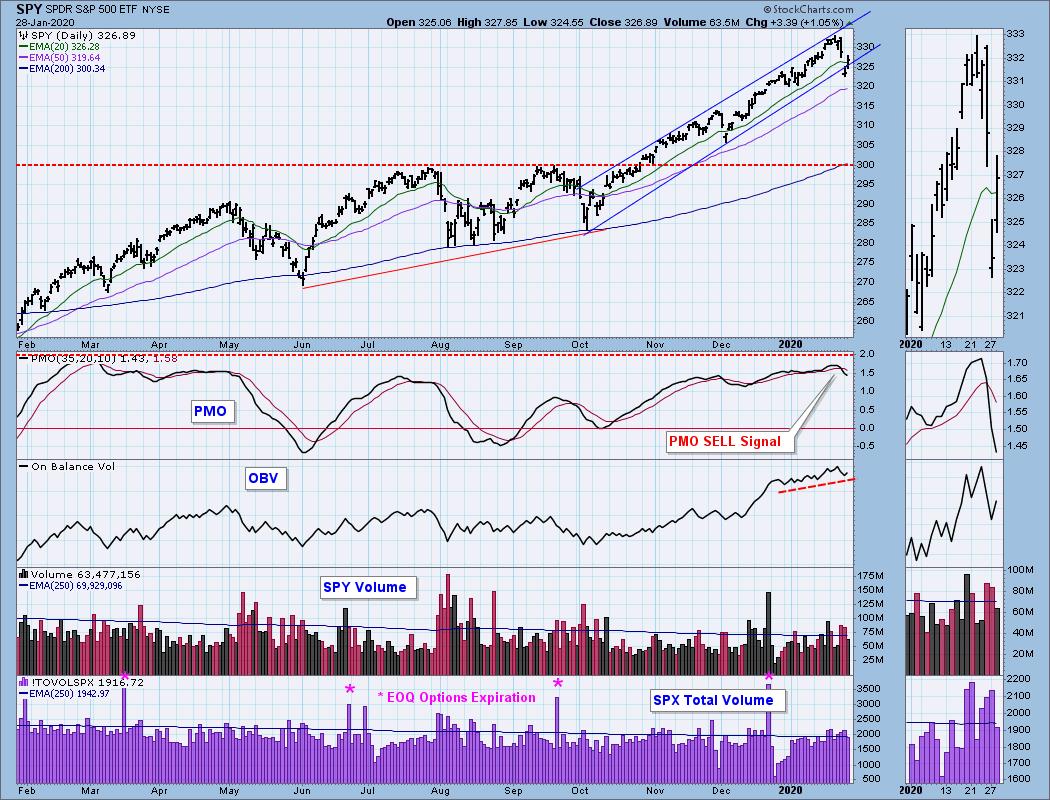
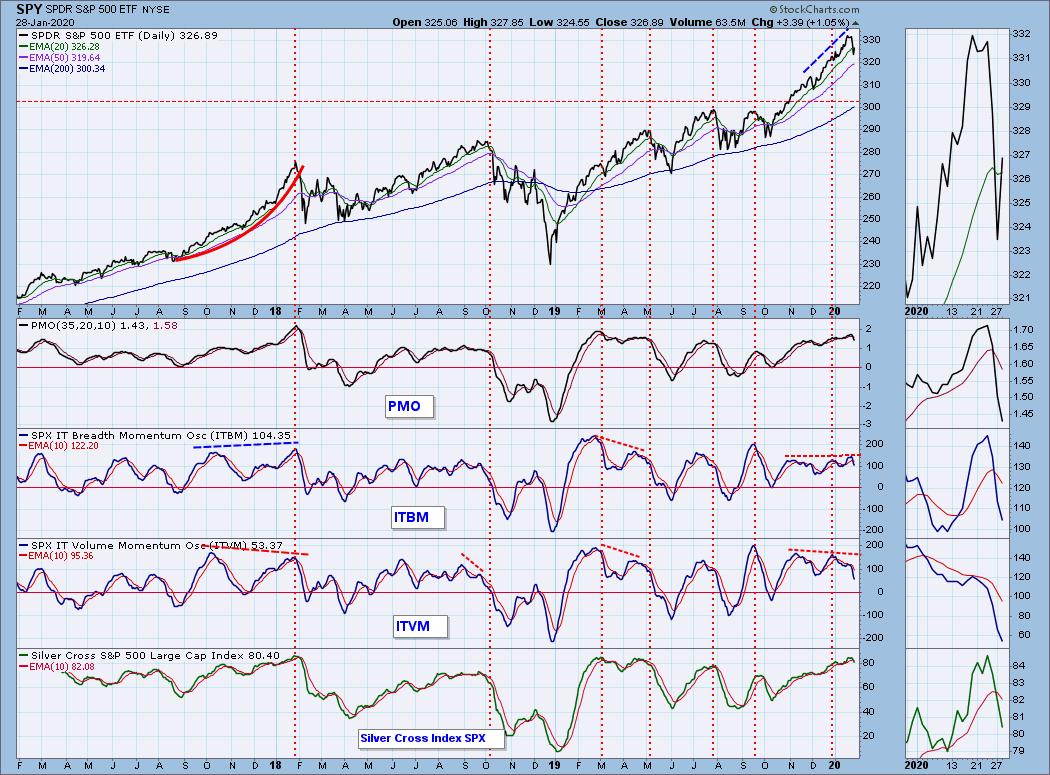
SPY Daily Chart: Price bounced back today as our climactic indicators suggested yesterday in the DP Alert. Price has now reentered the bearish rising wedge and closed above the 20-EMA. While encouraging, volume did drop off quite a bit after two high volume down days. I don't think we are in the clear just yet. That PMO quick decline is a problem. Today over 1% upside move didn't really slow the PMO's slide downward.
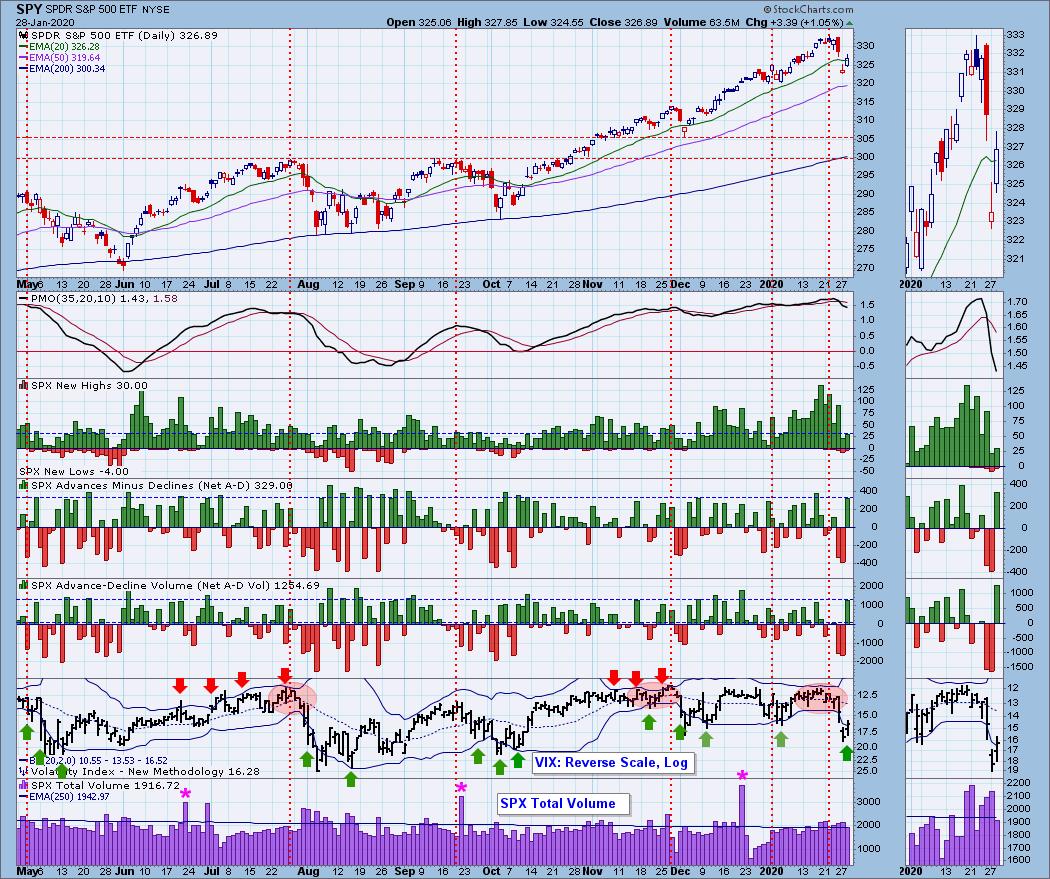
Climactic Market Indicators: Climactic breadth readings to the upside need to be analyzed for a buying initiation or exhaustion. Given that today is the first up day after two days of decline suggests this is a buying initiation. The VIX is still penetrating the bottom Bollinger Band and that typically precedes rallies. I'm thinking we should see another day or maybe two of higher prices, but I look at the declining tops on the New Highs and the ugly PMO and I can't get bullish past that.
Short-Term Market Indicators: STOs are in oversold territory and ticked up today. While this is bullish, there is still room for them to move lower and a "tick" up doesn't tell me they are actually going to bottom here.
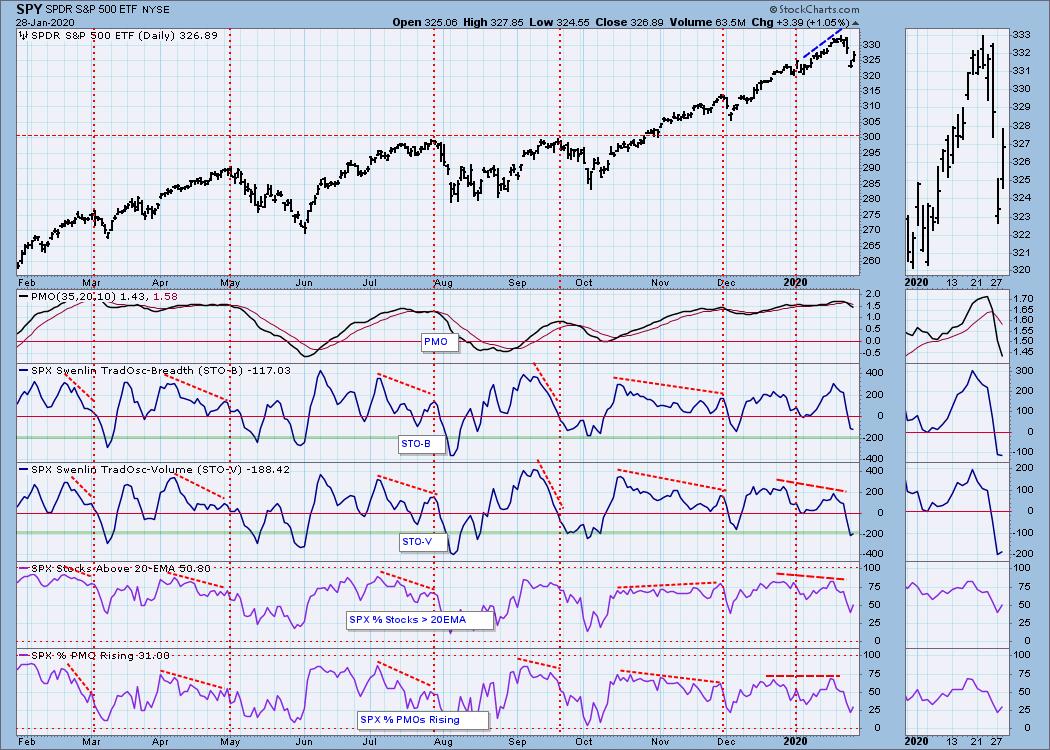
Intermediate-Term Market Indicators: All of these indicators have topped and are continuing lower. They are not oversold, not even close. The market is still quite vulnerable in the intermediate term, especially when you look at the weekly chart that I started the article with.
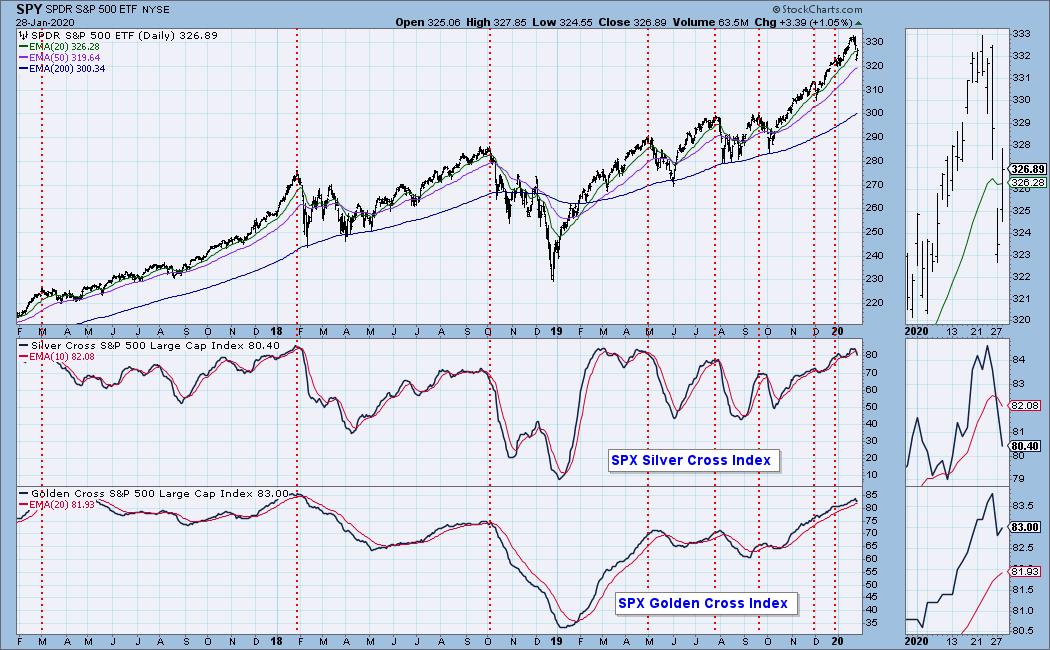
Readings of 80% and 83% on the Silver Cross Index and Golden Cross Index respectively are good. The Silver Cross Index is looking very bearish right now. Given we had a day where the market closed up over 1%, I don't see the Silver Cross Index slowing its descent. That's a problem.
CONCLUSION: The trend of the market is up given price's move back above the rising bottoms trendline and the condition is still overbought. I still agree with my comments from yesterday. The VIX is still looking bullish and we did see climactic positive readings. However, I don't like the weekly chart's parabolic breakdown and IT indicators are bearish. A possible buying initiation climax appeared on the climactic indicators' chart which is good for the next day or two. I think we will be working out overbought conditions with some type of volatile choppy sideways trading like we saw last August.
(Not a Diamonds subscriber? Add it to your DP Alert subscription and get a discount! Contact support@decisionpoint.com for your limited time coupon code!)
DOLLAR (UUP)
IT Trend Model: BUY as of 1/22/2020
LT Trend Model: BUY as of 5/25/2018
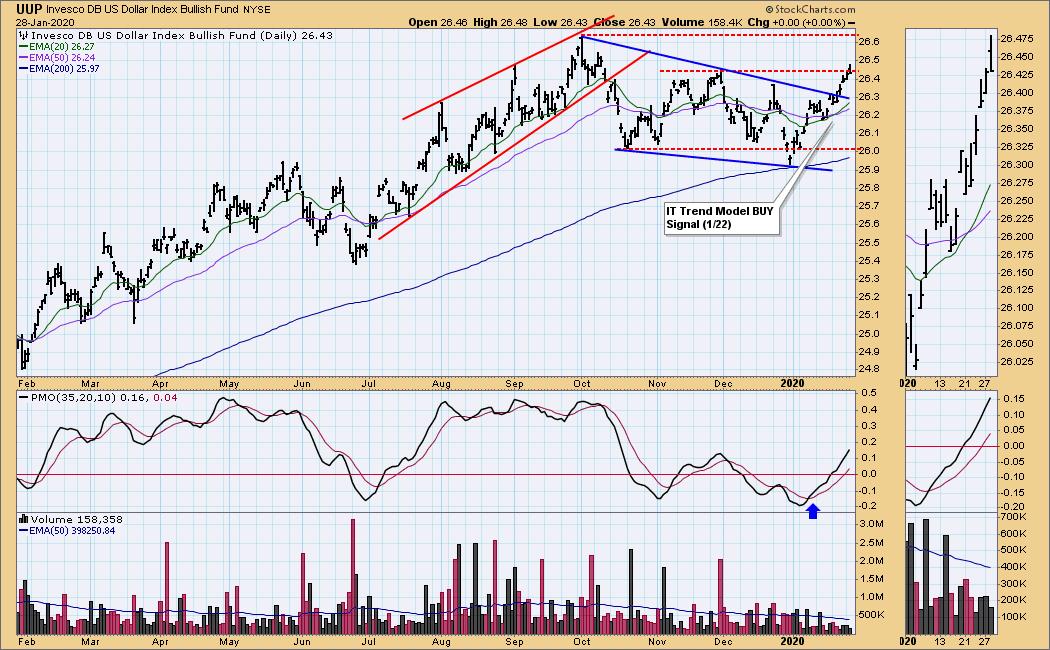
UUP Daily Chart: The Dollar continues to look bullish. If you want something to maybe be concerned about, price did breakout above overhead resistance at the November high but it closed at its low for the day which was back below that resistance level. Other than that, it still looks bullish.
GOLD
IT Trend Model: BUY as of 12/26/2019
LT Trend Model: BUY as of 1/8/2019
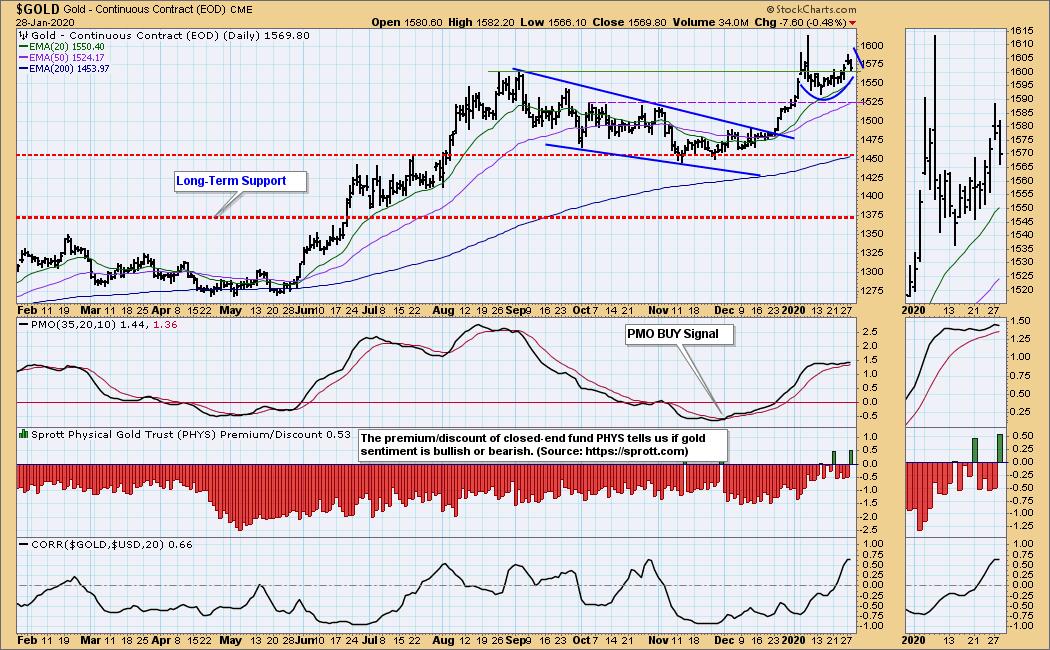
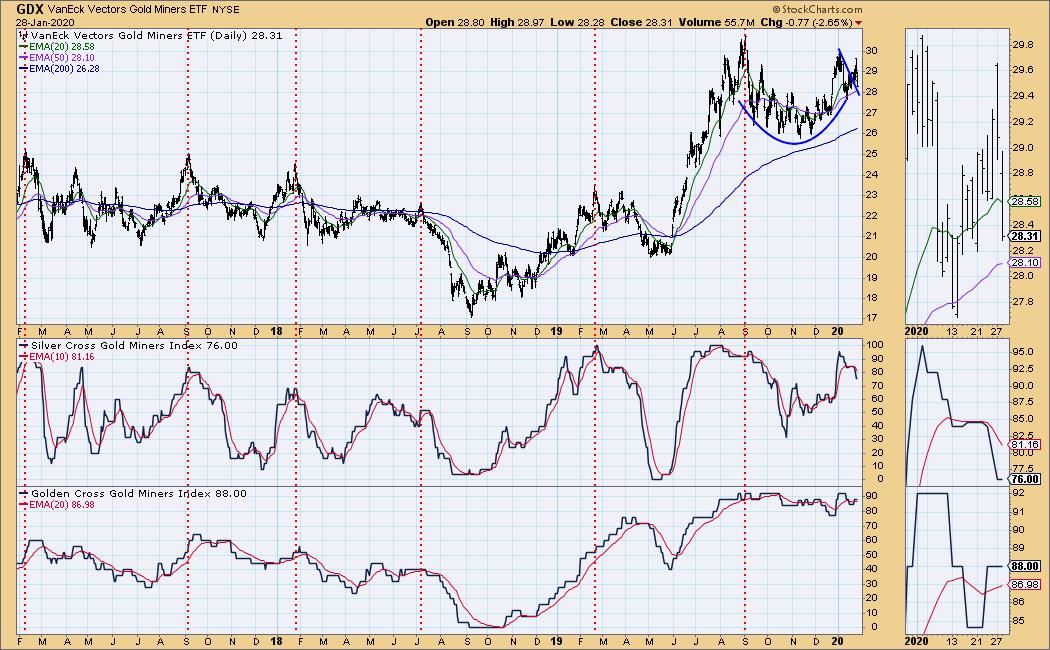
GOLD Daily Chart: I'd say that we could be looking at a handle on the cup I pointed out yesterday. Despite a down day, we saw a premium on PHYS which suggests buyers are bullish on Gold. Price held support at the September top. If that support is lost, then I suspect the handle will move too low and bust this bullish pattern.
GOLD MINERS Golden and Silver Cross Indexes: The pullback on Gold Miners was significant today. Price lost the 20-EMA and is about to test the 50-EMA. We could be looking at more handle to this cup but if it loses the 50-EMA, I would reevaluate. The Silver Cross Index has moved down to 76% so three quarters of this industry group are still holding onto IT Trend Model BUY signals (20-EMA > 50-EMA).
CRUDE OIL (USO)
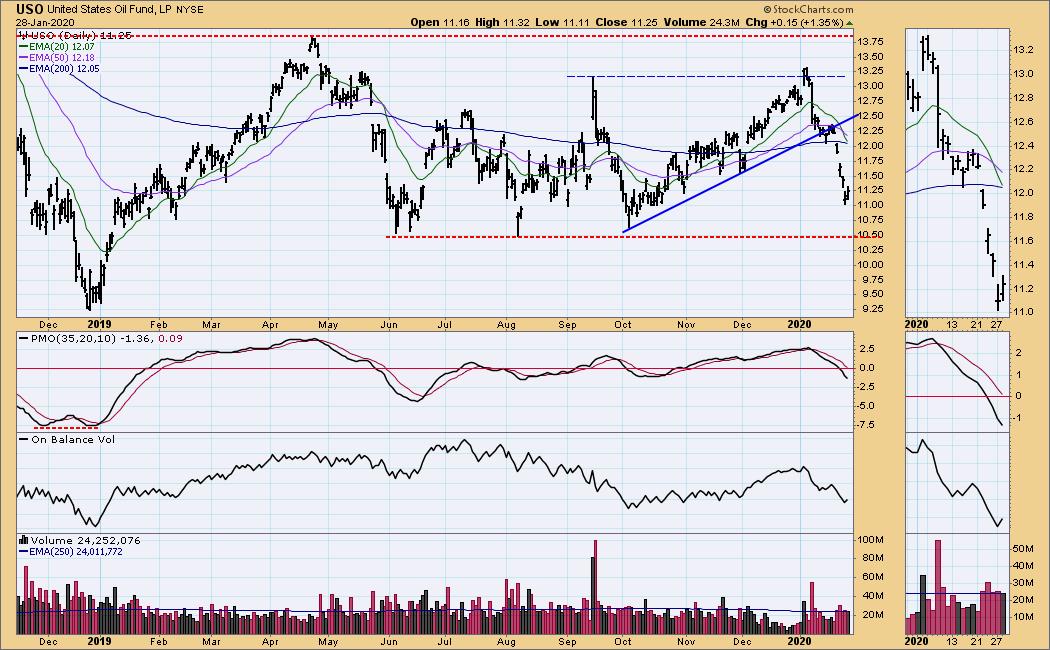
IT Trend Model: Neutral as of 1/27/2020
LT Trend Model: BUY as of 12/16/2019
USO Daily Chart: USO rebounded today with a 1.35% move upward. It sure doesn't look particularly impressive on the chart given the nearly vertical drop that preceded this move. I don't think this is the bottom, I would look for a continued drop to $10.50.
BONDS (TLT)
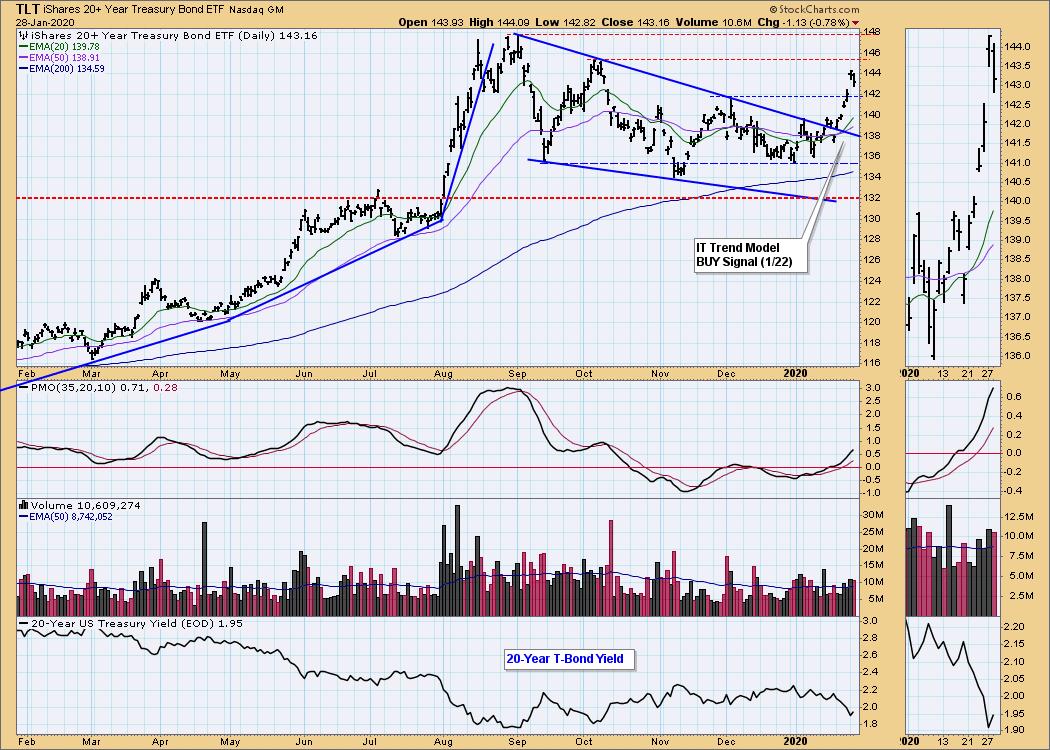
IT Trend Model: BUY as of 1/22/2020
LT Trend Model: BUY as of 1/2/2019
TLT Daily Chart: Finally seeing a pullback after the vertical move to the upside. This one needed a pullback. I would look for support to hold at $142. The PMO looks beautiful so I'm looking for price to challenge the September top after it works out that vertical rise...maybe consolidation that would form a bull flag?
Have you subscribed the DecisionPoint Diamonds yet? You can add it at a discount! Contact support@decisionpoint.com for information on how to save on Diamonds!
Technical Analysis is a windsock, not a crystal ball.
Happy Charting! - Erin
Email: erin@decisionpoint.com

Erin Swenlin will be presenting at the The MoneyShow Las Vegas May 11-13, 2020! You'll have an opportunity to meet Erin and discuss the latest DecisionPoint news and Diamond Scans. The conference is free to attend or view online!
NOTE: The signal status reported herein is based upon mechanical trading model signals, specifically, the DecisionPoint Trend Model. They define the implied bias of the price index based upon moving average relationships, but they do not necessarily call for a specific action. They are information flags that should prompt chart review. Further, they do not call for continuous buying or selling during the life of the signal. For example, a BUY signal will probably (but not necessarily) return the best results if action is taken soon after the signal is generated. Additional opportunities for buying may be found as price zigzags higher, but the trader must look for optimum entry points. Conversely, exit points to preserve gains (or minimize losses) may be evident before the model mechanically closes the signal.
Helpful DecisionPoint Links (Can Be Found on DecisionPoint.com Links Page):
DecisionPoint Shared ChartList and DecisionPoint Chart Gallery
Price Momentum Oscillator (PMO)
Swenlin Trading Oscillators (STO-B and STO-V)