
Today the Surge Scan went crazy! I had over 200 results on the Surge Scan today. It turned up some excellent candidates whereas the other scans were mostly mediocre with their results. Consequently I decided to only pick from the Surge Scan today.
As a reminder, the Surge Scan finds PMOs that have just bottomed above the signal line. It could mean that a very strong stock had a pause or pullback and now it is time for the rally to resume. In this vein, it shouldn't surprise any of us that the resulting charts nearly all had bull flags on them. Definitely a much easier day to select, although with so many to look at, it was a bit tedious.
Good Luck & Good Trading,
Erin
Today's "Diamonds in the Rough": APP, NVRI, NVT and ORCL.
Runner-ups: AVAV, CNXC, NGVT, ETN, SHOP, BKNG, MSA and NMIH.

Diamond Mine Trading Room:
RECORDING & DOWNLOAD LINK (5/23/2025):
Topic: DecisionPoint Diamond Mine (5/23/2025) LIVE Trading Room
Download and Recording Link
Passcode: May#23rd
REGISTRATION for 5/30/2025:
When: May 30, 2025 09:00 AM Pacific Time (US and Canada)
Topic: DecisionPoint Diamond Mine LIVE Trading Room
Register in advance for this webinar HERE
After registering, you will receive a confirmation email containing information about joining the webinar.
Welcome to DecisionPoint Diamonds, wherein I highlight ten "Diamonds in the Rough" per week. These are selected from the results of my DecisionPoint Scans which search for stocks that could benefit from the trend and condition of the market. Remember, these are not recommendations to buy or sell, but are the most interesting of the stocks that surfaced in my scans. My objective is to save you the work of the initial, tedious culling process, but you need to apply your own analysis to see if these stocks pique your interest as well. There are no guaranteed winners here!
"Predefined Scans Triggered" are taken from StockCharts.com using the "Symbol Summary" option instead of a "SharpChart" on the workbench.
Stop levels are all rounded down.
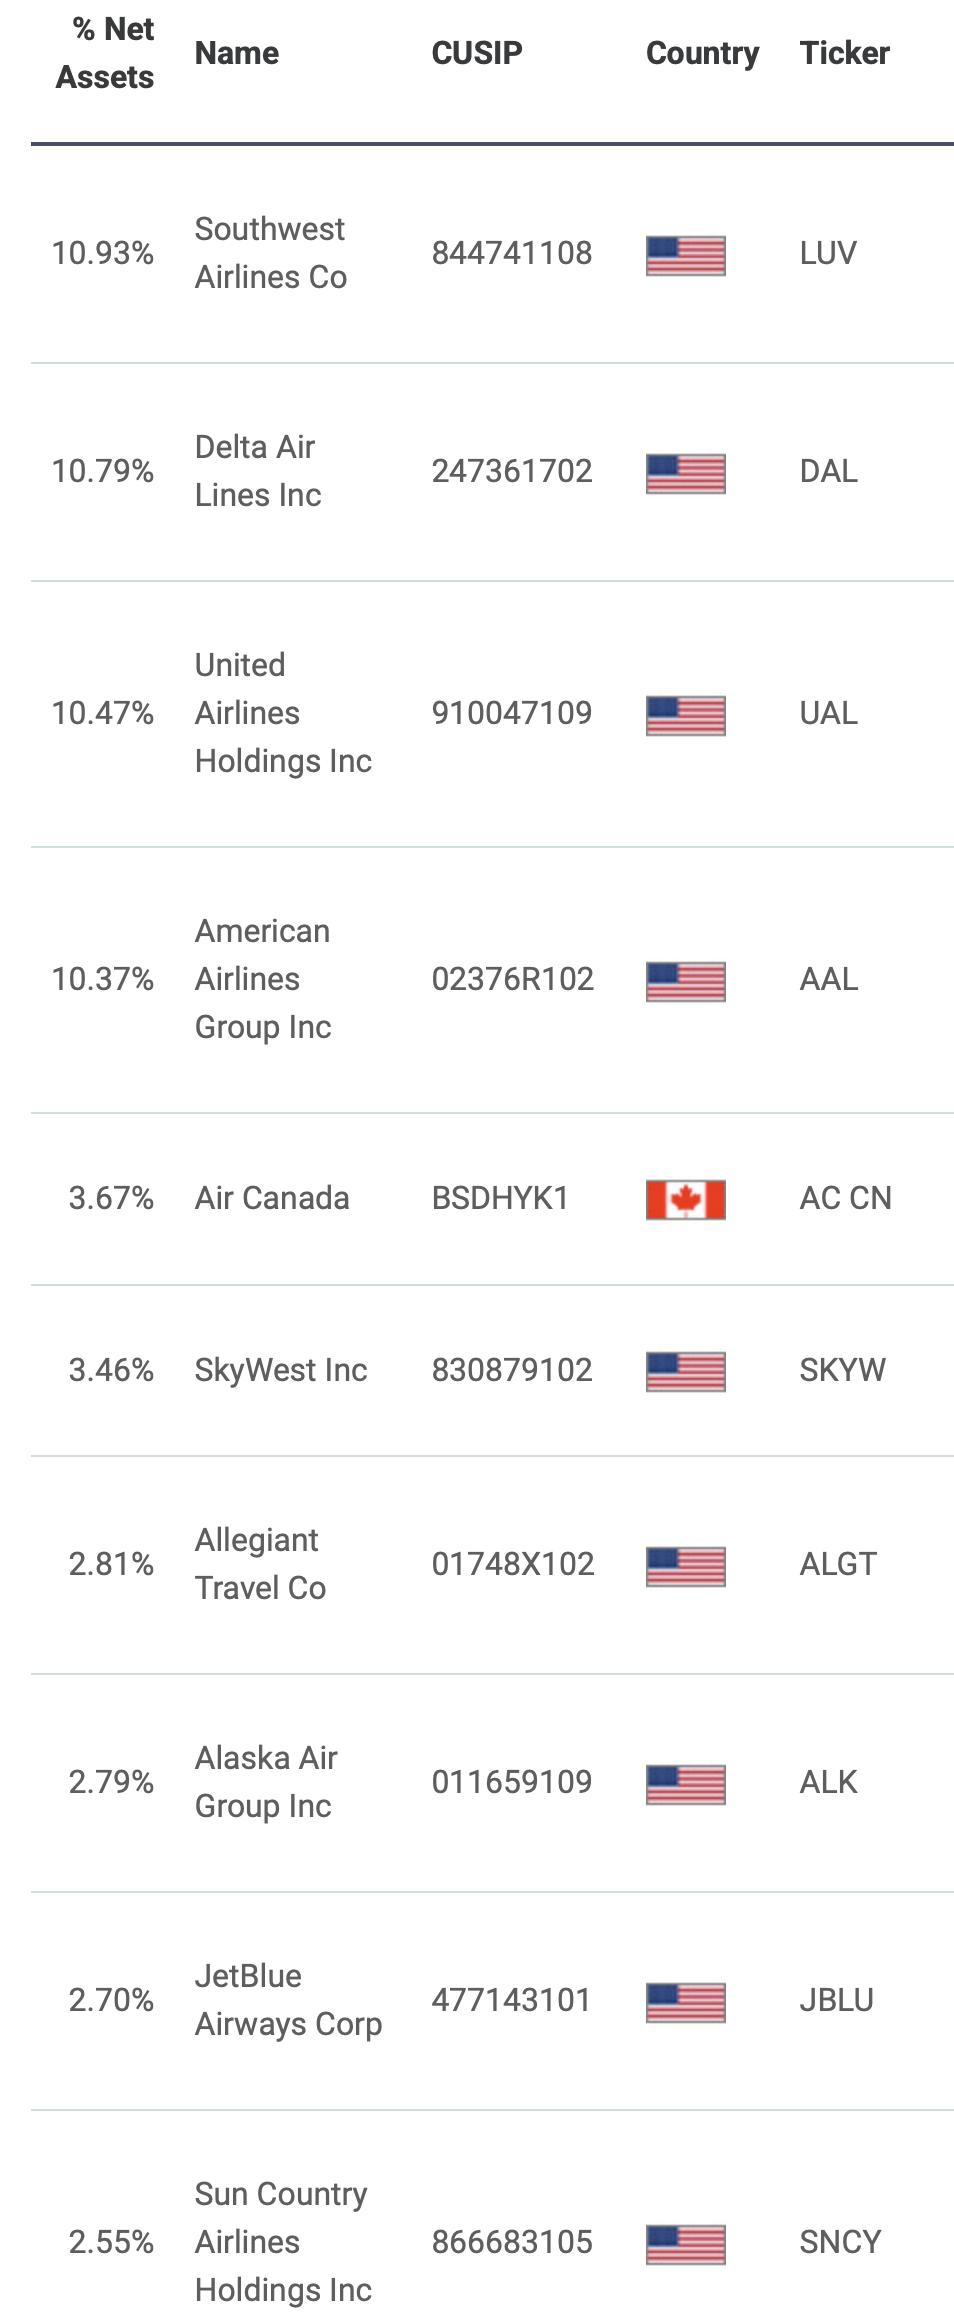
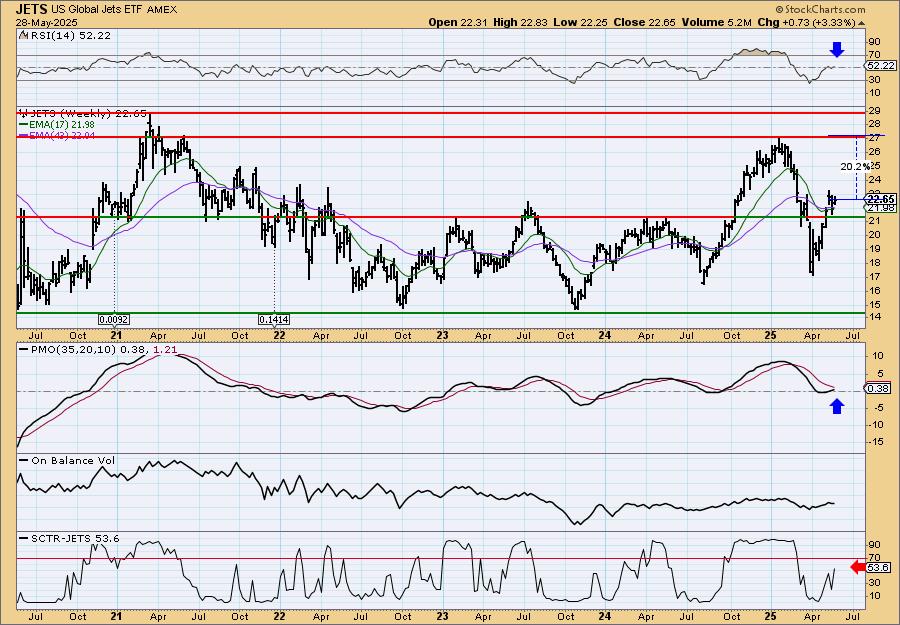
US Global Jets ETF (JETS)
EARNINGS: N/A
JETS invests in both US and non-US airline companies. This concentrated portfolio is weighted towards domestic passenger airlines. Click HERE for more information.
Predefined Scans Triggered: Elder Bar Turned Blue and P&F Double Top Breakout.
JETS is down -0.66% in after-hours trading. The large reverse head and shoulders caught my eye. The upside target of the pattern would take price above the 2025 high. The pattern hasn't been confirmed yet, we need a breakout for that. The RSI is positive and not overbought. The PMO has a recent surge above the signal line (bottom above the signal line). Stochastics have turned back up in positive territory. Relative strength is also beginning to rise against the SPY. The stop is set beneath the prior low at 6.2% or $21.24.

We have a bullish "V" Bottom on the weekly chart that implies we will see a break to new highs. The weekly RSI is positive and not overbought. The weekly PMO is rising toward a Crossover BUY Signal. The StockCharts Technical Rank (SCTR) is not yet in the hot zone* but it is headed there quickly.
*If a stock is in the "hot zone" above 70, it implies that it is stronger than 70% of its universe (large-, mid-, small-caps and ETFs) primarily in the intermediate to long terms.
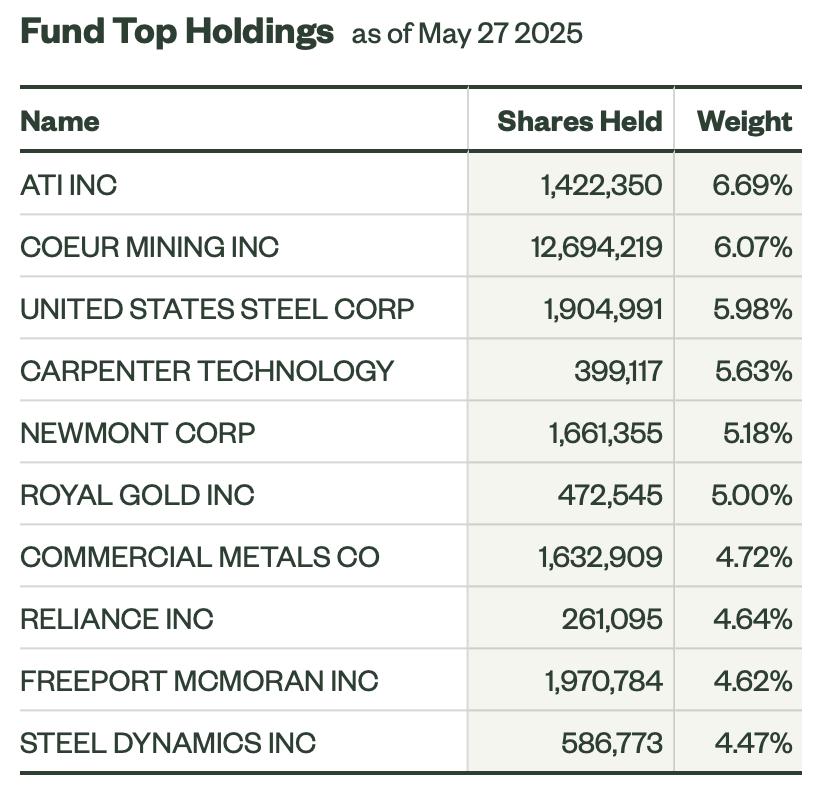
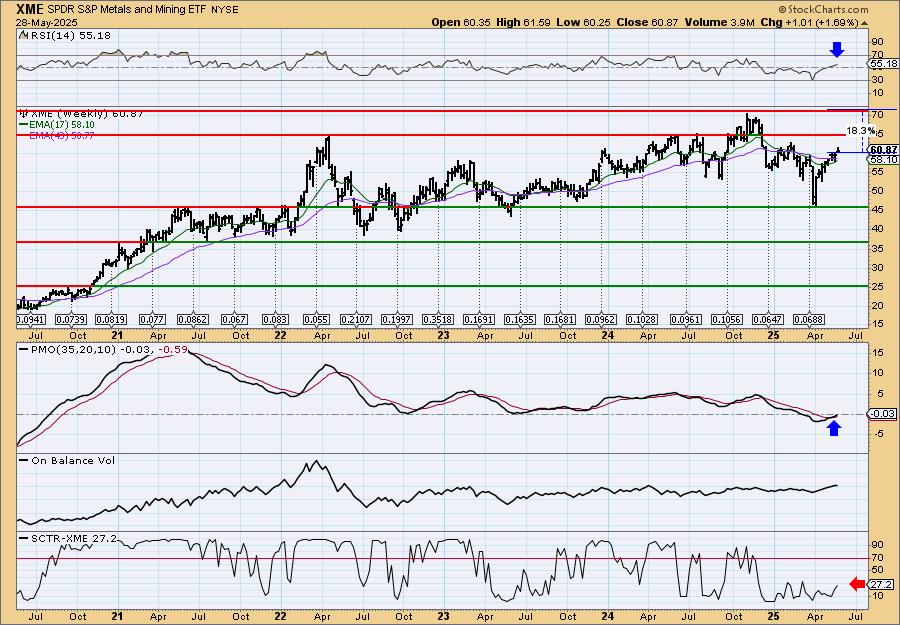
SPDR S&P Metals and Mining ETF (XME)
EARNINGS: N/A
XME tracks an equal-weighted index of US metals and mining companies. Click HERE for more information.
Predefined Scans Triggered: P&F Double Top Breakout.
XME is up +0.87% in after-hours trading. I didn't annotate it, but I think you could say there is a reverse head and shoulders on the chart that has been confirmed with the recent breakout. I like Gold Miners, and this is a way to expose yourself to other Miners. Consider GDX and GDXJ as possible "Diamonds in the Rough" this week. Remember this was our Industry Group to Watch on Friday. The RSI is positive and not overbought. The PMO has surged above the signal line. Stochastics are now rising above 80. We can even see some outperformance against the SPY. The stop is set below the 50-day EMA at 6.6% or $56.85.
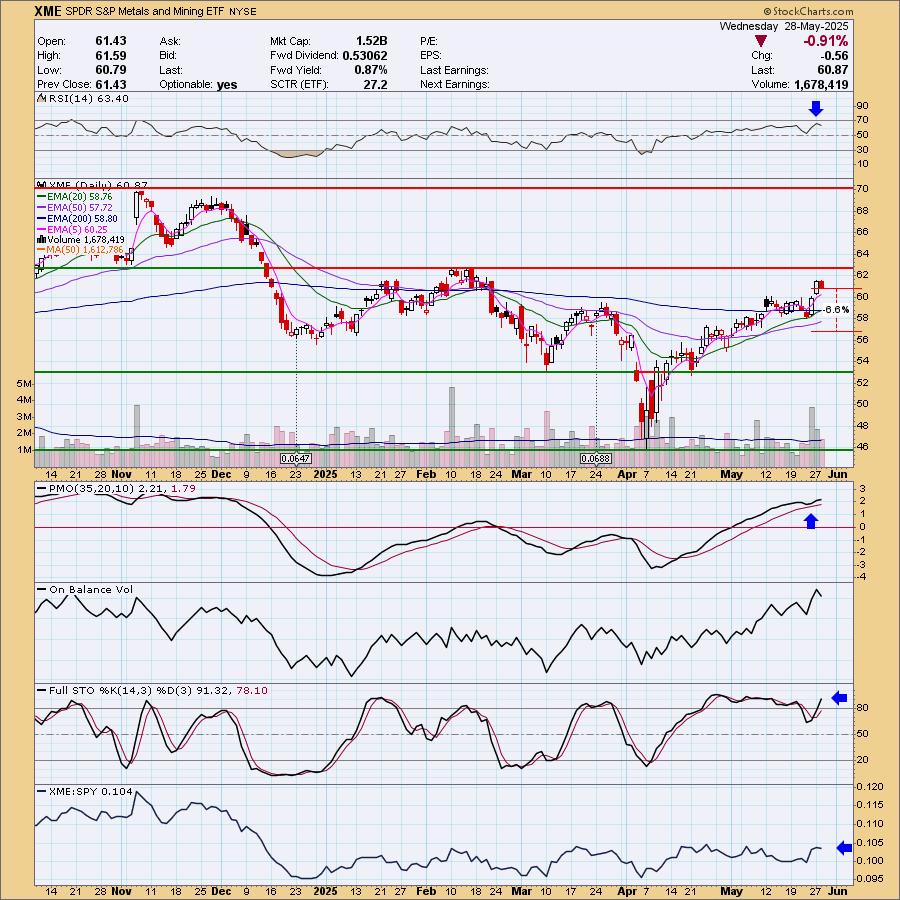
The weekly chart saw a nice rebound off strong support. The weekly RSI is positive and not overbought. The weekly PMO is on a new Crossover BUY Signal. The SCTR is not in the hot zone, but at least it is rising.
SPDR S&P Retail ETF (XRT)
EARNINGS: N/A
XRT tracks a broad-based, equal-weighted index of stocks in the US retail industry. Click HERE for more information.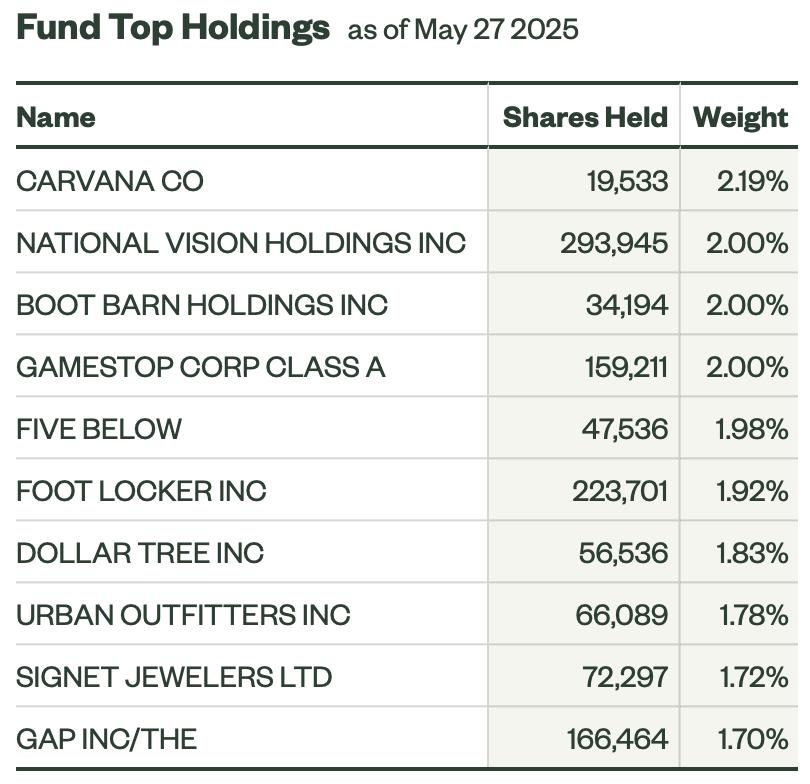
Predefined Scans Triggered: Parabolic SAR Buy Signals, P&F Ascending Triple Top Breakout and P&F Double Top Breakout.
XRT is down -0.22% in after-hours trading. We did see a breakout today, but price did retreat. This looks like a good bottoming formation. Price is congregating above the 200-day EMA support. The RSI is positive and not overbought. The PMO is rising on a Crossover BUY Signal above the zero line. The Silver Cross Index is rising nicely above its signal line for a BULLISH IT Bias. The Golden Cross Index is above its signal line so there is an LT BULLISH Bias as well. Participation was hit on the consolidation, but it is beginning to see a little upside. Stochastics are strong above 80 and relative strength is rising. The stop is set beneath gap support at 7% or $71.02.
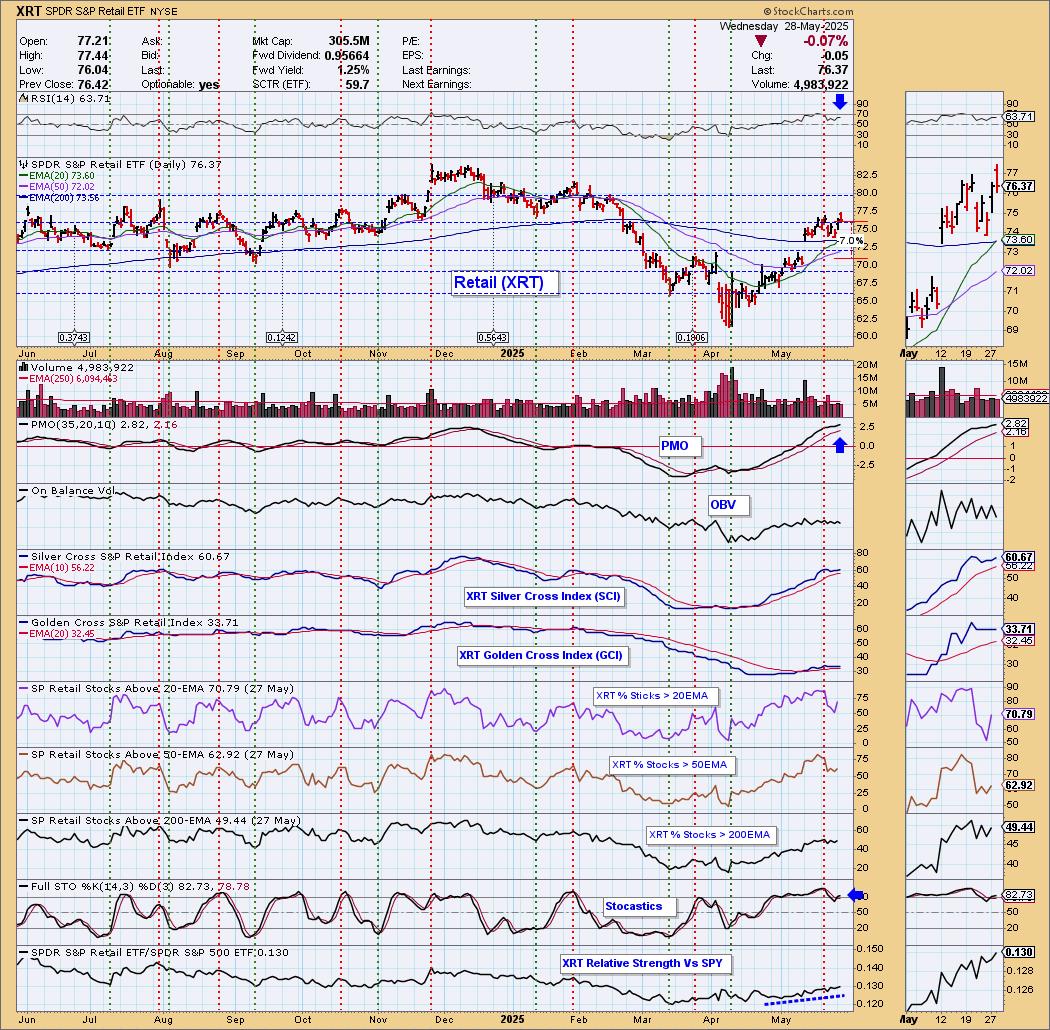
It is getting a bit close to overhead resistance which is over 10% away. We could get a breakout there if the market cooperates. The weekly RSI is positive and not overbought. The weekly PMO is on a new Crossover BUY Signal. The SCTR is not in the hot zone, but it is very close.

Don't forget, on Thursdays I look at reader-requested symbols, click HERE to send me an email. I read every email I receive and try to answer them all!
Current Market Outlook:
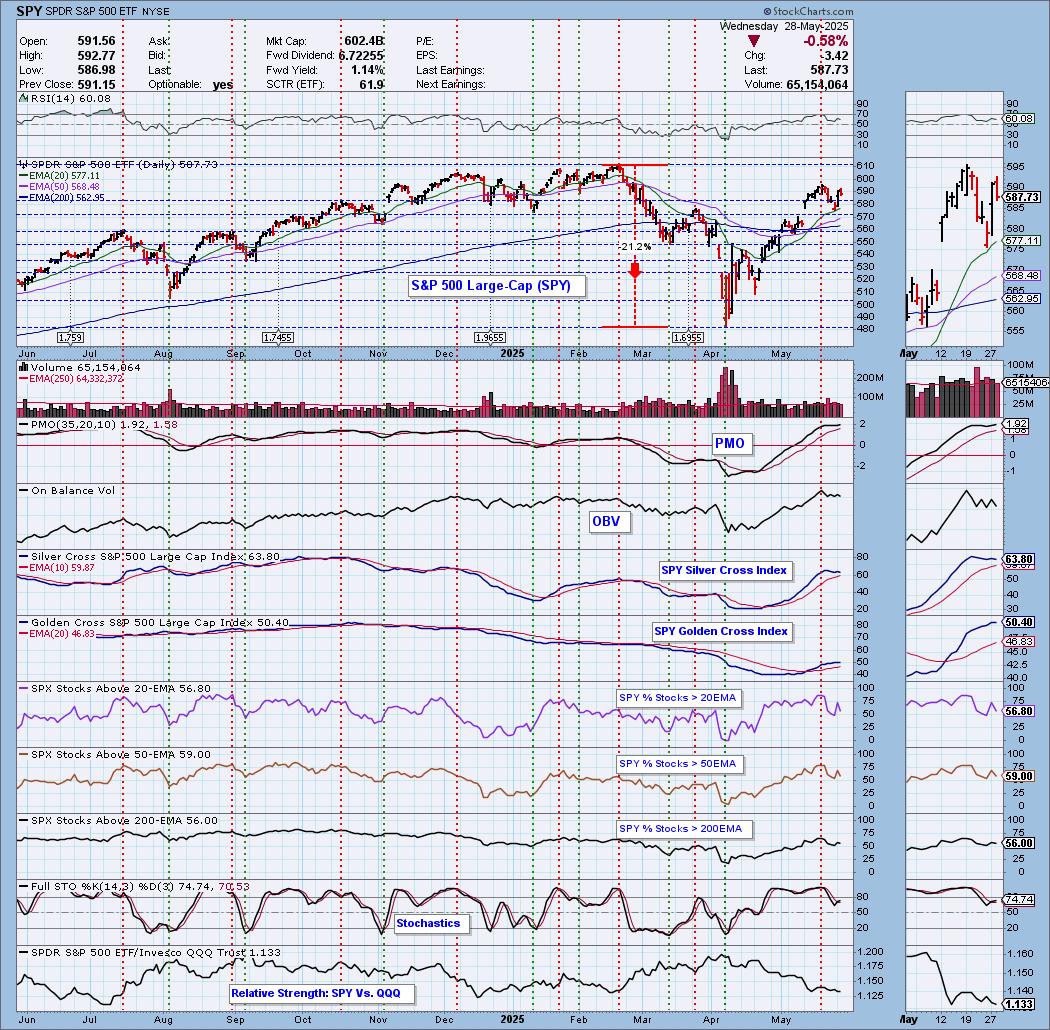
Market Environment: It is important to consider the odds for success by assessing the market tides. The following chart uses different methodologies for objectively showing the depth and trend of participation for intermediate- and long-term time frames.
- The Silver Cross Index (SCI) shows the percentage of SPX stocks on IT Trend Model BUY signals (20-EMA > 50-EMA)
- The Golden Cross Index (GCI) shows the percentage of SPX stocks on LT Trend Model BUY signals (50-EMA > 200-EMA)
Don't forget that as a "Diamonds" member, you have access to our "Under the Hood" curated ChartList on DecisionPoint.com. You'll find it under "Members Only" links on the left side on the Blogs and Links Page.
Here is the current chart:
Full Disclosure: I am 65% long, 0% short.
I'm required to disclose if I currently own a stock I mention and/or may buy/short it within the next 72 hours.
"Technical Analysis is a windsock, not a crystal ball." - Carl Swenlin
(c) Copyright 2025 DecisionPoint.com
Watch the latest episode of DecisionPoint Trading Room with Carl Swenlin & Erin Swenlin Mondays on the DecisionPoint YouTube channel here!
NOTE: The stocks reported herein are from mechanical trading model scans that are based upon moving average relationships, momentum and volume. DecisionPoint analysis is then applied to get five selections from the scans. The selections given should prompt readers to do a chart review using their own analysis process. This letter is not a call for a specific action to buy, sell or short any of the stocks provided. There are NO sure things or guaranteed returns on the daily selection of "Diamonds in the Rough."
Regarding BUY/SELL Signals: The signal status reported herein is based upon mechanical trading model signals and crossovers. They define the implied bias of the price index/stock based upon moving average relationships and momentum, but they do not necessarily call for a specific action. They are information flags that should prompt chart review. Further, they do not call for continuous buying or selling during the life of the signal. For example, a BUY signal will probably (but not necessarily) return the best results if action is taken soon after the signal is generated. Additional opportunities for buying may be found as price zigzags higher, but the trader must look for optimum entry points. Conversely, exit points to preserve gains (or minimize losses) may be evident before the model mechanically closes the signal.
Helpful DecisionPoint Links:
Price Momentum Oscillator (PMO)
Swenlin Trading Oscillators (STO-B and STO-V)
For more links, go to DecisionPoint.com