
Scans came up empty today. I did find one ETF from one of my scans, but the other two I went off the ETF Tracker ChartList. With the market on a beautiful rally, it was an easy choice to pick two growth ETFs that have plenty of upside potential even though they have been rallying already. I think there is more upside to go.
I'm finally expanding my exposure. It was long overdue but I've been completely distracted by our new puppy which needs constant supervision so my investing has taken a back seat. Life sometimes gets in the way and knowing the market, there will always be opportunities to get in.
We've sent out the email explaining how the sunsetting of DecisionPoint.com will affect your current subscriptions. If you haven't received it, please let me know and I'll get a copy sent to you. Monthly subscribers will not be renewed after May 27th, but we will extend all current subscribers to our closing date of June 30th. Annual subscribers, please email me for specific details if you need them.
Good Luck & Good Trading,
Erin
Today's "Diamonds in the Rough": ARKK, EWP and WCLD.
* * * * * * * * * * * * * *
Carl has decided to retire, and Erin will be joining him in retirement. We will continue publication until June 27th, and we have already sent email on how your subscription will be affected. Please get in touch if you have any questions.
* * * * * * * * * * * * * *

Diamond Mine Trading Room:
RECORDING & DOWNLOAD LINK (5/9/2025):
Topic: DecisionPoint Diamond Mine (5/9/2025) LIVE Trading Room
Recording & Download Link
Passcode: May##9th
REGISTRATION for 5/16/2025:
When: May 16, 2025 09:00 AM Pacific Time (US and Canada)
Topic: DecisionPoint Diamond Mine LIVE Trading Room
Register in advance for this webinar HERE
After registering, you will receive a confirmation email containing information about joining the webinar.
Welcome to DecisionPoint Diamonds, wherein I highlight ten "Diamonds in the Rough" per week. These are selected from the results of my DecisionPoint Scans which search for stocks that could benefit from the trend and condition of the market. Remember, these are not recommendations to buy or sell, but are the most interesting of the stocks that surfaced in my scans. My objective is to save you the work of the initial, tedious culling process, but you need to apply your own analysis to see if these stocks pique your interest as well. There are no guaranteed winners here!
"Predefined Scans Triggered" are taken from StockCharts.com using the "Symbol Summary" option instead of a "SharpChart" on the workbench.
Stop levels are all rounded down.
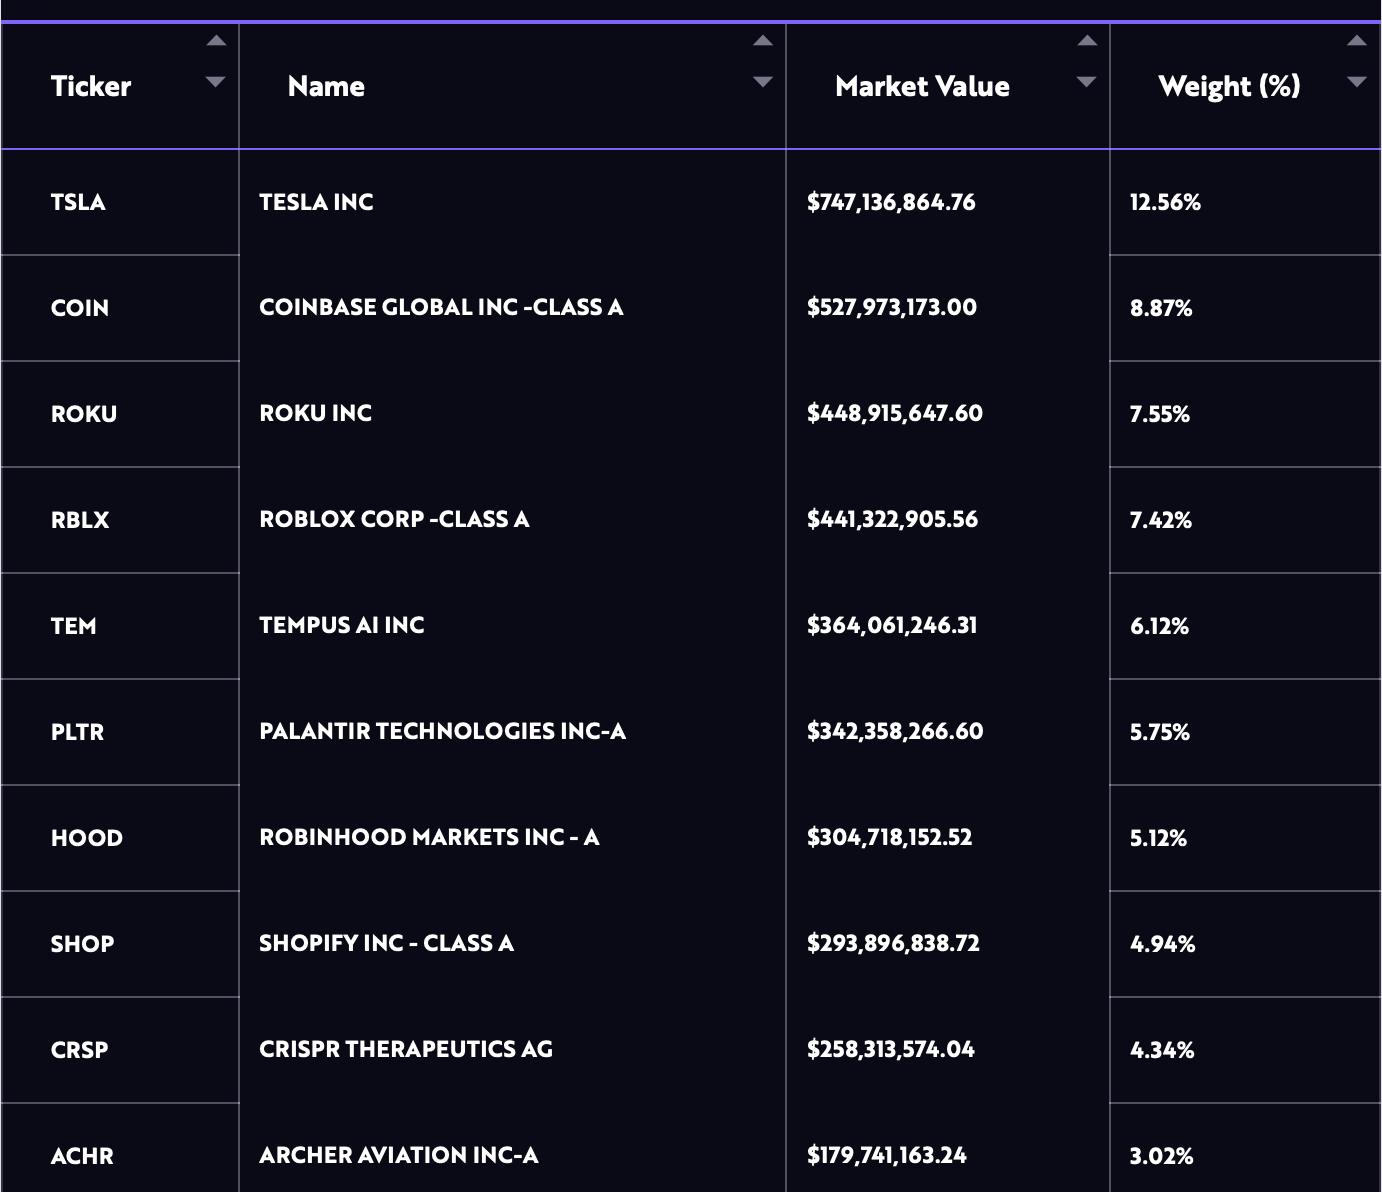
ARK Innovation ETF (ARKK)
EARNINGS: N/A
ARKK is an actively managed fund that seeks long-term capital growth from companies globally involved with, or that benefit from, disruptive innovation. Click HERE for more information.
Predefined Scans Triggered: Filled Black Candles, P&F Ascending Triple Top Breakout and P&F Double Top Breakout.
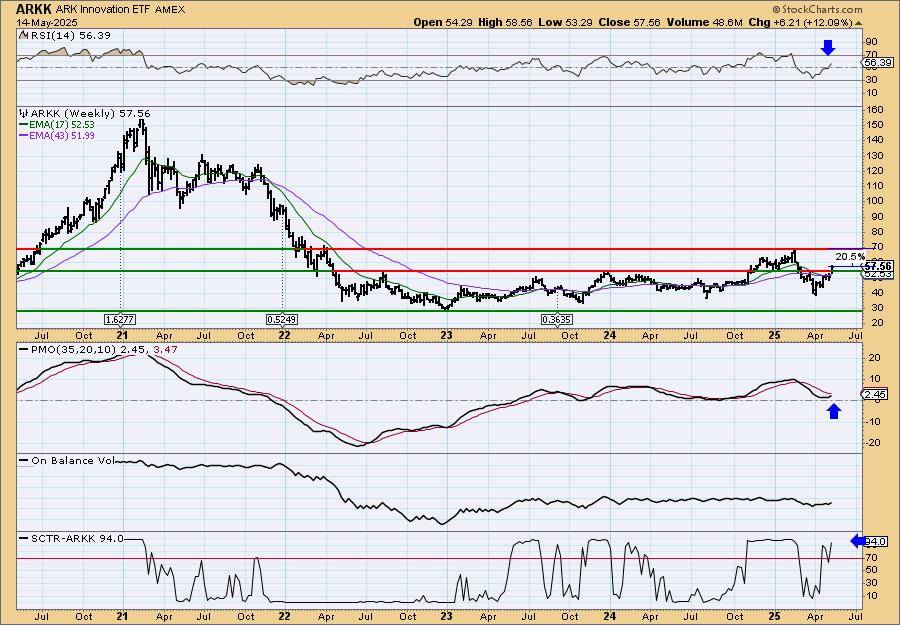
ARKK is up +0.10% in after hours trading. Technology is seeing some of the best gains so I decided to go with one that should take advantage. One of the main reasons I selected it was the bullish reverse head and shoulders pattern. There is a new Silver Cross of the 20/50-day EMAs. It also has a very high PMO reading. The RSI is not quite overbought yet and the PMO is rising strongly. Stochastics are holding above 80. Relative strength is rising strongly. The stop is set below support at 7.5% or $53.24.

It has been in a trading range for years and now it appears it is ready to test the top of the range and possibly break out. The weekly RSI is positive and the weekly PMO has turned up above the zero line. The StockCharts Technical Rank (SCTR) is in the hot zone*, looking very bullish.
*If a stock is in the "hot zone" above 70, it implies that it is stronger than 70% of its universe (large-, mid-, small-caps and ETFs) primarily in the intermediate to long terms.
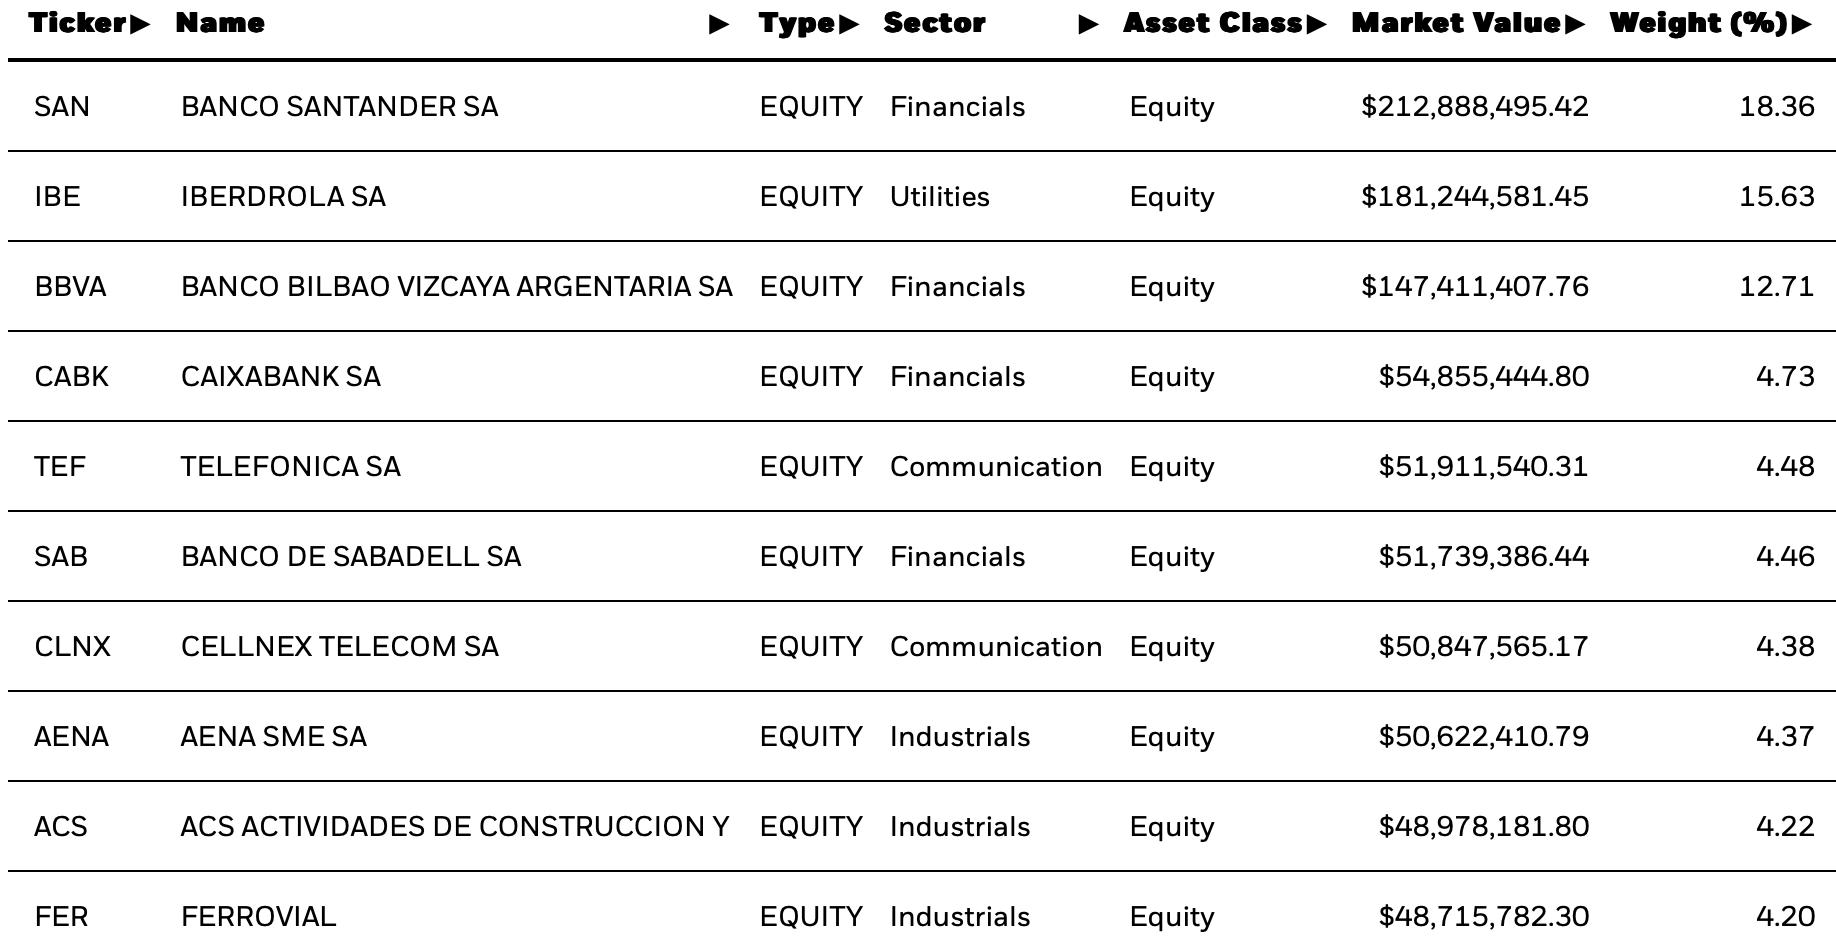
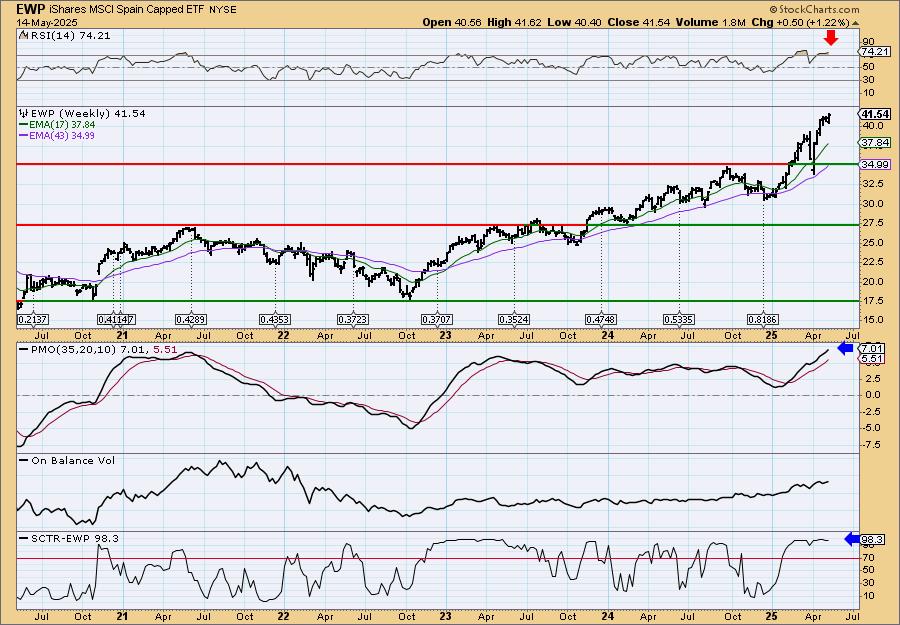
iShares MSCI Spain Capped ETF (EWP)
EARNINGS: N/A
EWP tracks a market-cap-weighted index of Spanish companies. It covers the top 85% of Spanish companies by market cap. Click HERE for more information.
Predefined Scans Triggered: Elder Bar Turned Green, New CCI Buy Signals, Moved Above Upper Keltner Channel, New 52-week Highs, Moved Above Upper Price Channel, Parabolic SAR Buy Signals, P&F Ascending Triple Top Breakout and P&F Double Top Breakout.
EWP is unchanged in after-hours trading. We have a flag formation with a new breakout to 52-week highs. The RSI is positive and not overbought. The PMO has a very high reading above zero and it has turned back up. We should see a Crossover BUY Signal soon. The OBV is showing rising bottoms, essentially confirming this new rally. Stochastics have turned back up and are almost above 80. Relative strength in the near term hasn't been great, but overall it does tend to outperform. The stop is set near the 50-day EMA below support at 6.3% or $38.92.
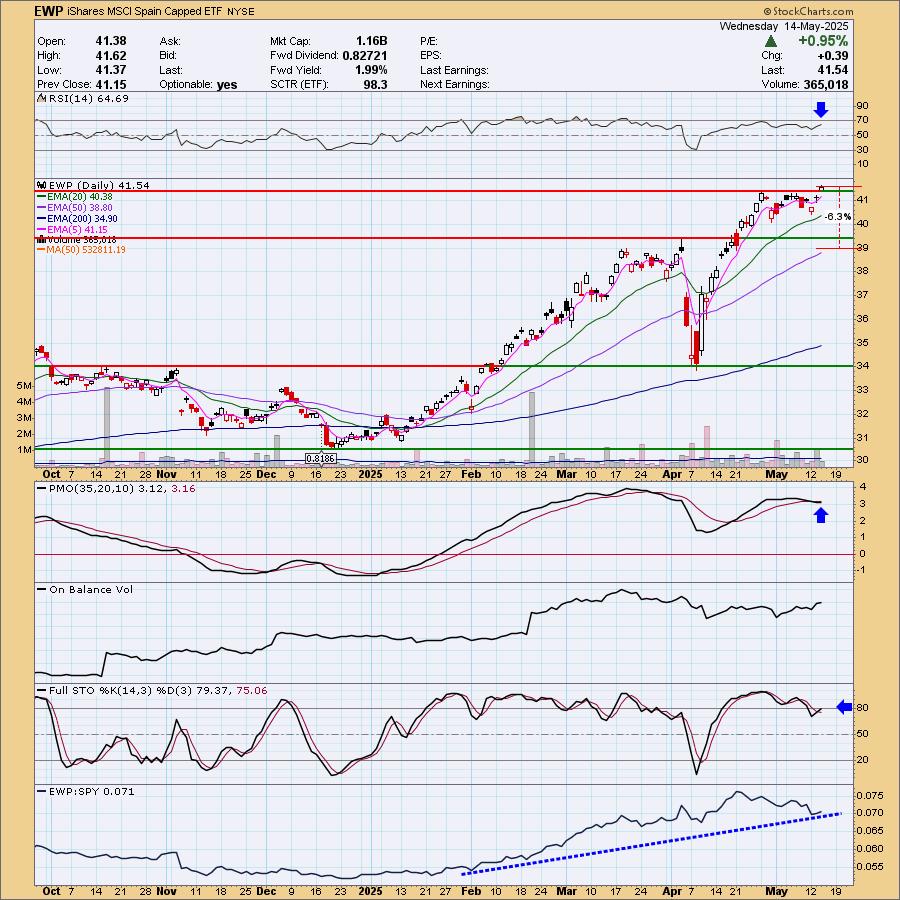
We have a long-term rising trend that doesn't appear ready to break down. The weekly RSI is overbought right now which could be a problem later on. For now the weekly PMO is rising strongly well above the zero line and the SCTR is at the top of the hot zone. Consider a 17% upside target to about $48.60.
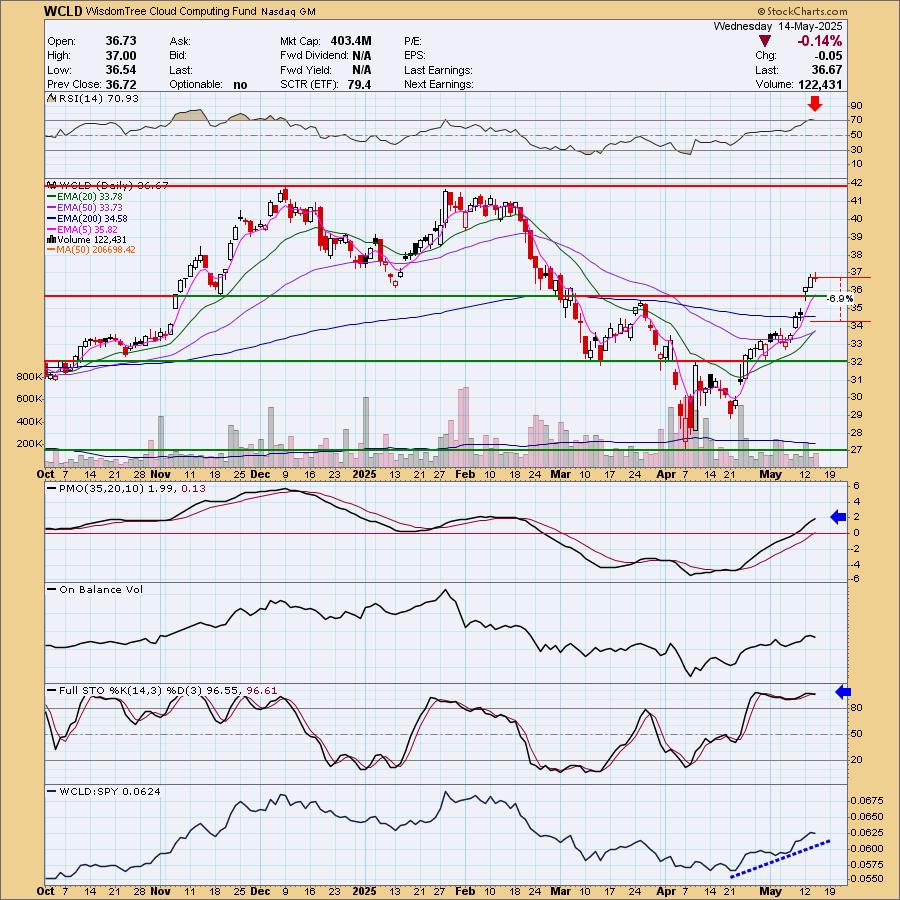
WisdomTree Cloud Computing Fund (WCLD)
EARNINGS: N/A
WCLD tracks and index of US companies primarily focused on cloud software and services. Stocks are equal weighted in the index. Click HERE for more information.
Predefined Scans Triggered: Elder Bar Turned Blue, Stock in a New Uptrend (ADX) and P&F Double Top Breakout.
WCLD is unchanged in after-hours trading. I really liked the breakout and the new Silver Cross of the 20/50-day EMAs. The RSI is overbought, but it can handle these conditions well based on November and December of last year. The PMO is rising strongly above the zero line. Stochastics are holding above 80 indicating internal strength. Relative strength is rising against the SPY. The stop is set beneath the 200-day EMA at 6.9% or $34.13.
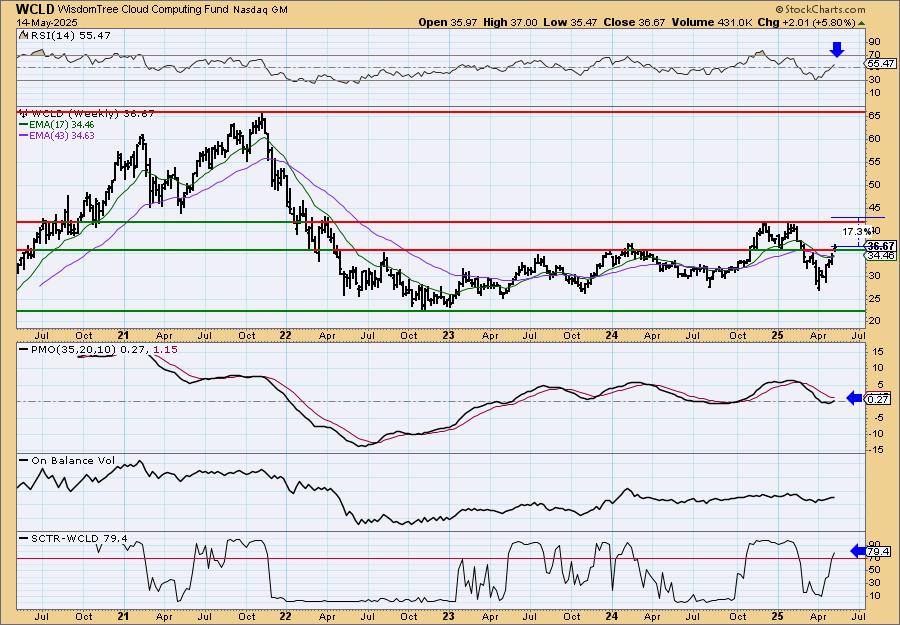
The weekly chart shows a nice breakout above prior resistance. It could get stuck at overhead resistance that is coming up, but the indicators look good enough to expect a breakout. The weekly RSI is just now in positive territory. The weekly PMO has turned up and is now above the zero line. The SCTR has reentered the hot zone.
Don't forget, on Thursdays I look at reader-requested symbols, click HERE to send me an email. I read every email I receive and try to answer them all!
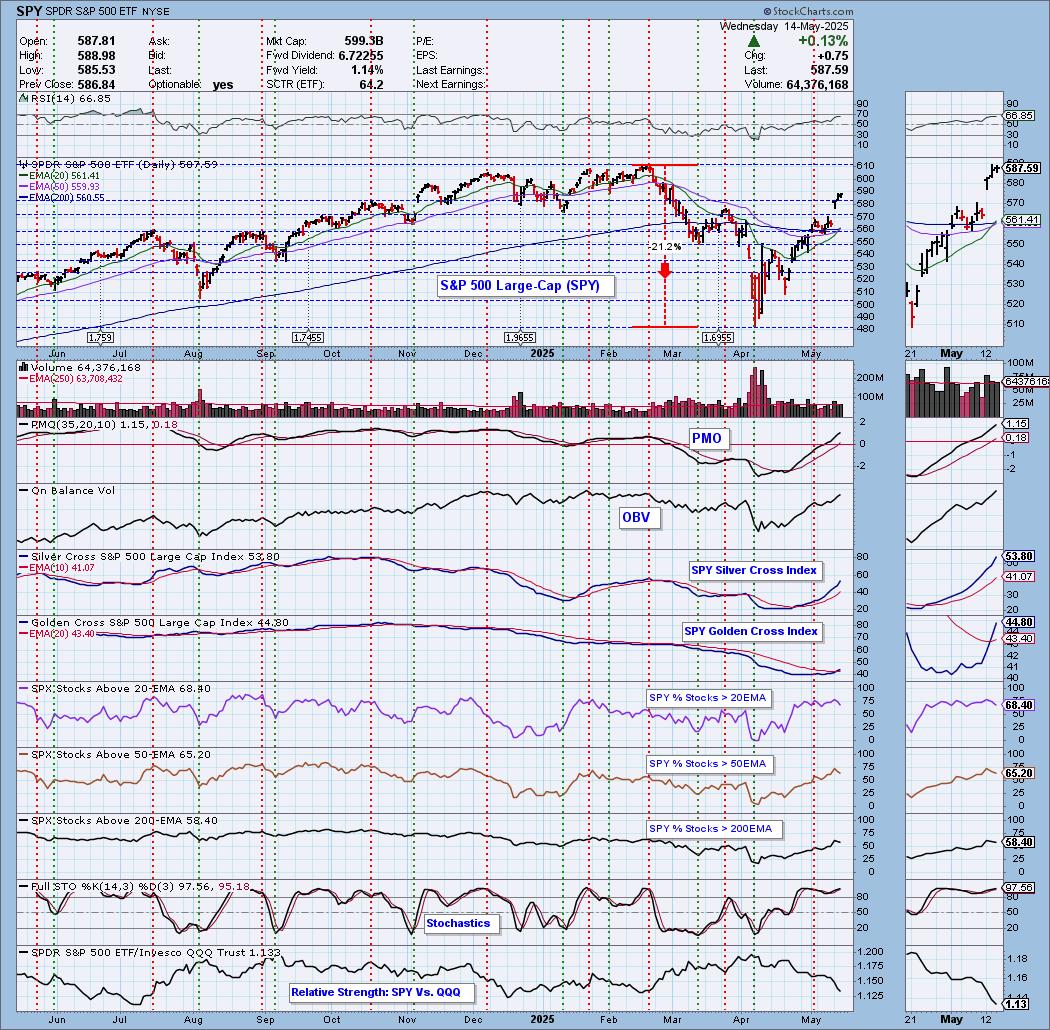
Current Market Outlook:
Market Environment: It is important to consider the odds for success by assessing the market tides. The following chart uses different methodologies for objectively showing the depth and trend of participation for intermediate- and long-term time frames.
- The Silver Cross Index (SCI) shows the percentage of SPX stocks on IT Trend Model BUY signals (20-EMA > 50-EMA)
- The Golden Cross Index (GCI) shows the percentage of SPX stocks on LT Trend Model BUY signals (50-EMA > 200-EMA)
Don't forget that as a "Diamonds" member, you have access to our "Under the Hood" curated ChartList on DecisionPoint.com. You'll find it under "Members Only" links on the left side on the Blogs and Links Page.
Here is the current chart:
Full Disclosure: I am 70% long, 0% short.
I'm required to disclose if I currently own a stock I mention and/or may buy/short it within the next 72 hours.
"Technical Analysis is a windsock, not a crystal ball." - Carl Swenlin
(c) Copyright 2025 DecisionPoint.com
Watch the latest episode of DecisionPoint Trading Room with Carl Swenlin & Erin Swenlin Mondays on the DecisionPoint YouTube channel here!
NOTE: The stocks reported herein are from mechanical trading model scans that are based upon moving average relationships, momentum and volume. DecisionPoint analysis is then applied to get five selections from the scans. The selections given should prompt readers to do a chart review using their own analysis process. This letter is not a call for a specific action to buy, sell or short any of the stocks provided. There are NO sure things or guaranteed returns on the daily selection of "Diamonds in the Rough."
Regarding BUY/SELL Signals: The signal status reported herein is based upon mechanical trading model signals and crossovers. They define the implied bias of the price index/stock based upon moving average relationships and momentum, but they do not necessarily call for a specific action. They are information flags that should prompt chart review. Further, they do not call for continuous buying or selling during the life of the signal. For example, a BUY signal will probably (but not necessarily) return the best results if action is taken soon after the signal is generated. Additional opportunities for buying may be found as price zigzags higher, but the trader must look for optimum entry points. Conversely, exit points to preserve gains (or minimize losses) may be evident before the model mechanically closes the signal.
Helpful DecisionPoint Links:
Price Momentum Oscillator (PMO)
Swenlin Trading Oscillators (STO-B and STO-V)
For more links, go to DecisionPoint.com