
I was definitely unimpressed by today's scan results. I tried very hard to find four selections within the scan results, but I just wasn't completely happy so I decided to branch out. I did the Diamond Mine exercise of picking a sector, drilling down to a good industry group and then finding a stock within. The industry group from Technology was Telecom Equipment. I found two very promising charts there.
The email has now gone out to all subscribers explaining how subscriptions will be affected next month upon our retirement. If you did not receive the email, please get in touch right away (support@decisionpoint.com) for more information.
Good Luck & Good Trading,
Erin
Today's "Diamonds in the Rough": AAOI, AIOT, AIT and GT.
* * * * * * * * * * * * * *
Carl has decided to retire, and Erin will be joining him in retirement. We will continue publication until June 27th, and we have already sent email on how your subscription will be affected. Please get in touch if you have any questions.
* * * * * * * * * * * * * *

Diamond Mine Trading Room:
RECORDING & DOWNLOAD LINK (5/9/2025):
Topic: DecisionPoint Diamond Mine (5/9/2025) LIVE Trading Room
Recording & Download Link
Passcode: May##9th
REGISTRATION for 5/16/2025:
When: May 16, 2025 09:00 AM Pacific Time (US and Canada)
Topic: DecisionPoint Diamond Mine LIVE Trading Room
Register in advance for this webinar HERE
After registering, you will receive a confirmation email containing information about joining the webinar.
Welcome to DecisionPoint Diamonds, wherein I highlight ten "Diamonds in the Rough" per week. These are selected from the results of my DecisionPoint Scans which search for stocks that could benefit from the trend and condition of the market. Remember, these are not recommendations to buy or sell, but are the most interesting of the stocks that surfaced in my scans. My objective is to save you the work of the initial, tedious culling process, but you need to apply your own analysis to see if these stocks pique your interest as well. There are no guaranteed winners here!
"Predefined Scans Triggered" are taken from StockCharts.com using the "Symbol Summary" option instead of a "SharpChart" on the workbench.
Stop levels are all rounded down.
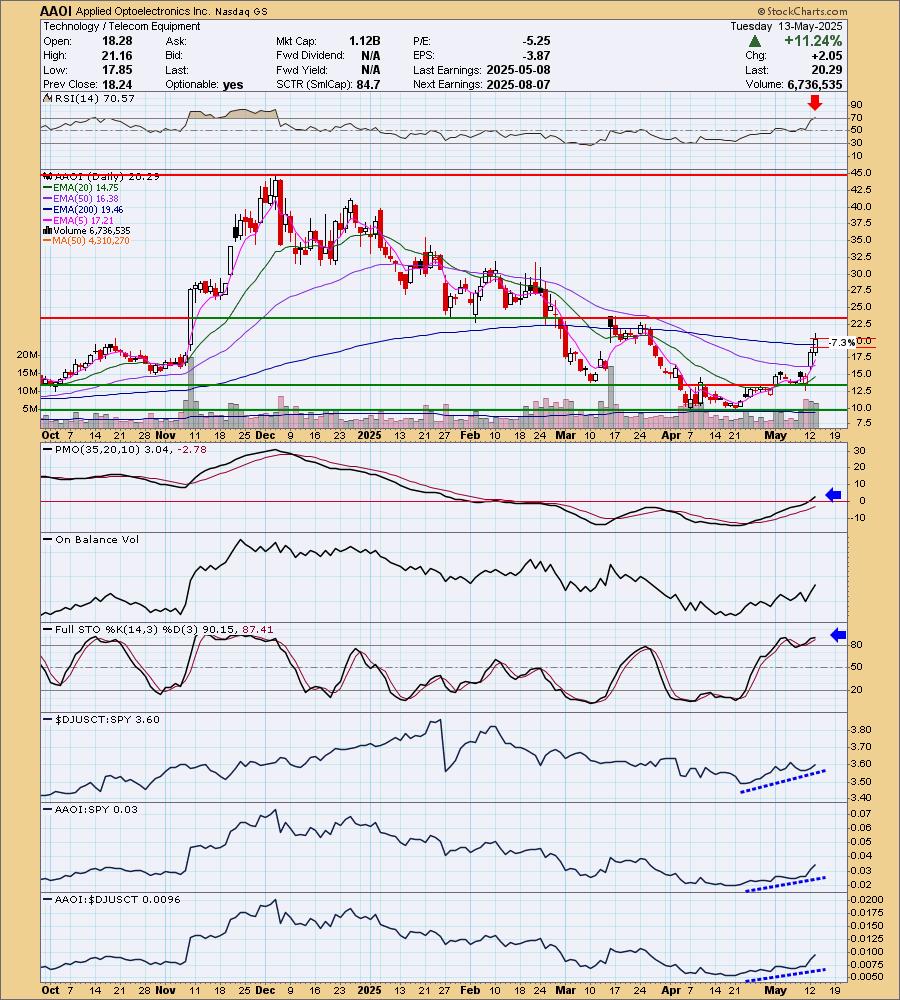
Applied Optoelectronics Inc. (AAOI)
EARNINGS: 2025-08-07 (AMC)
Applied Optoelectronics, Inc. engages in the design and manufacture of optical communications products. Its products include optical devices, such as laser diodes, photodiodes, related modules and circuitry, and equipment for applications in fiber-to-the-home, cable television, point to point communications, and wireless. The company was founded by Chih Hsiang Lin on February 28, 1997 and is headquartered in Sugar Land, TX.
Predefined Scans Triggered: P&F Triple Top Breakout, Entered Ichimoku Cloud and P&F Double Top Breakout.
AAOI is down -0.99% in after hours trading. This looks like a good bottom. Price has gotten above the 200-day EMA. It had a blowout day so we could see a small pullback tomorrow. I like that the declining trend has been broken. The RSI is overbought right now, but we can see it can hold those conditions for quite sometime based on November. The PMO is now accelerating above the zero line. Stochastics are holding above 80. Relative strength is rising across the board. We even have the OBV rising and therefore confirming this rally. The stop is set beneath the 200-day EMA at 7.3% or $18.80.
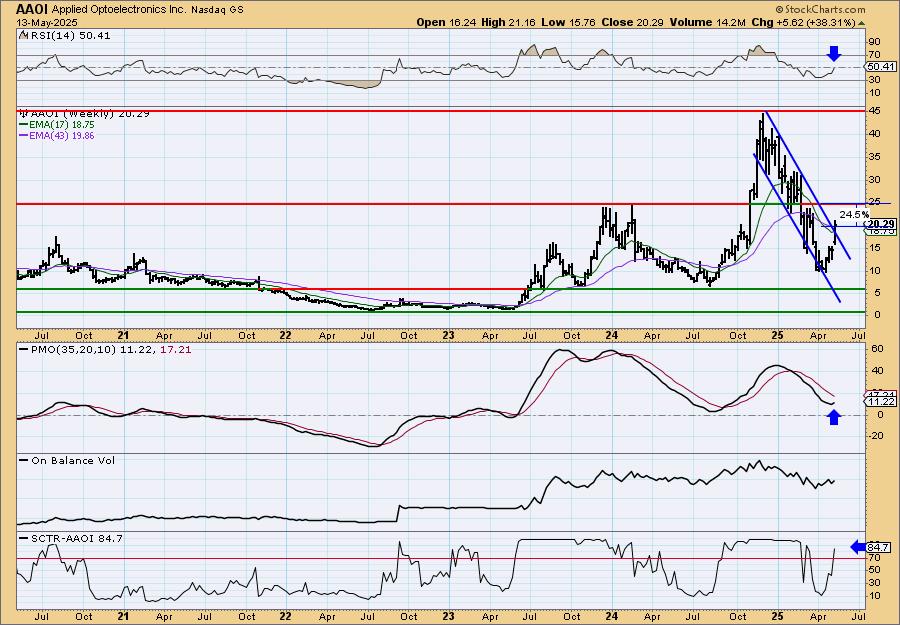
Price is reversing out of a steep declining trend channel. The weekly RSI has just entered positive territory. The weekly PMO has turned up. The StockCharts Technical Rank (SCTR) is in the hot zone* above 70. There is very nice upside potential if it should reach the 2024 high.
*If a stock is in the "hot zone" above 70, it implies that it is stronger than 70% of its universe (large-, mid-, small-caps and ETFs) primarily in the intermediate to long terms.
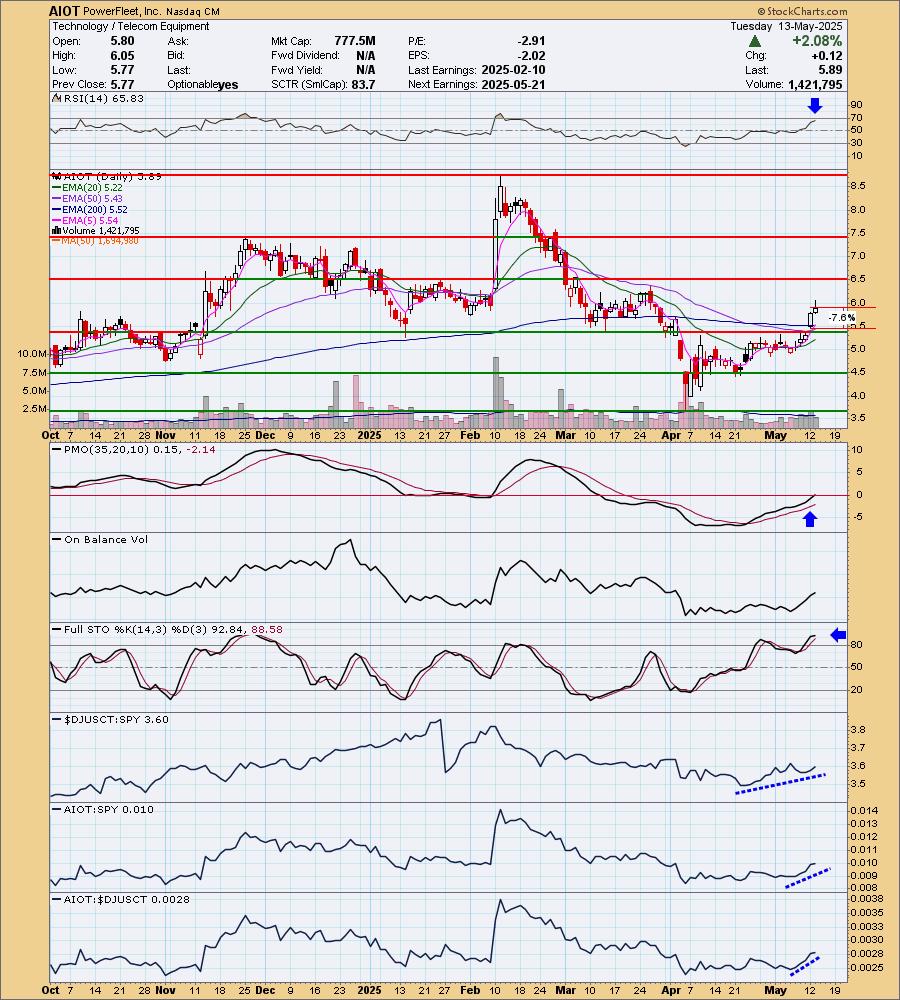
PowerFleet, Inc. (AIOT)
EARNINGS: 2025-05-21 (BMO)
PowerFleet, Inc. engages in the provision of fleet management solutions for logistics, industrial, and vehicles. It offers wireless Internet of Things and machine to machine solutions for securing, controlling, tracking, and managing enterprise assets such as industrial trucks, tractor trailers, containers, cargo, and vehicle and truck fleets. It operates through the following geographical segments: United States, Israel, and Other. The company was founded in 1993 and is headquartered in Woodcliff Lake, NJ.
Predefined Scans Triggered: P&F Low Pole and Entered Ichimoku Cloud.
AIOT is unchanged in after hours trading. I like yesterday's breakout and today's follow-through. The RSI is not yet overbought. The PMO has just entered positive territory. Stochastics are holding above 80. Relative strength is looking good for the group and AIOT. I've set the stop at 7.6% or $5.44. This is low-priced so position size wisely.
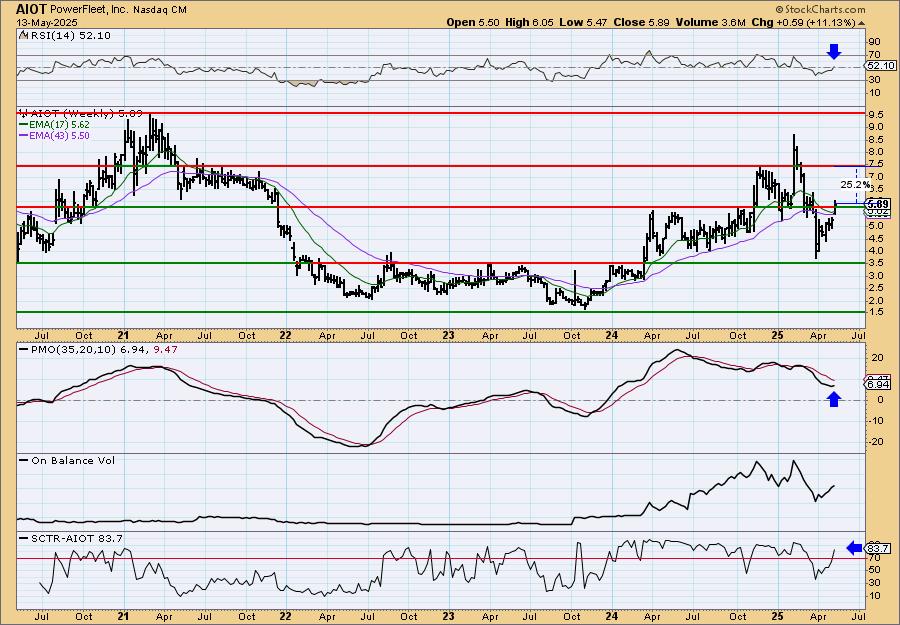
The weekly chart shows a breakout above the tops from 2024. The weekly RSI is now in positive territory. The weekly PMO is turning back up. The SCTR is in the hot zone above 70. There is very nice upside potential should it reach the late 2024 top.
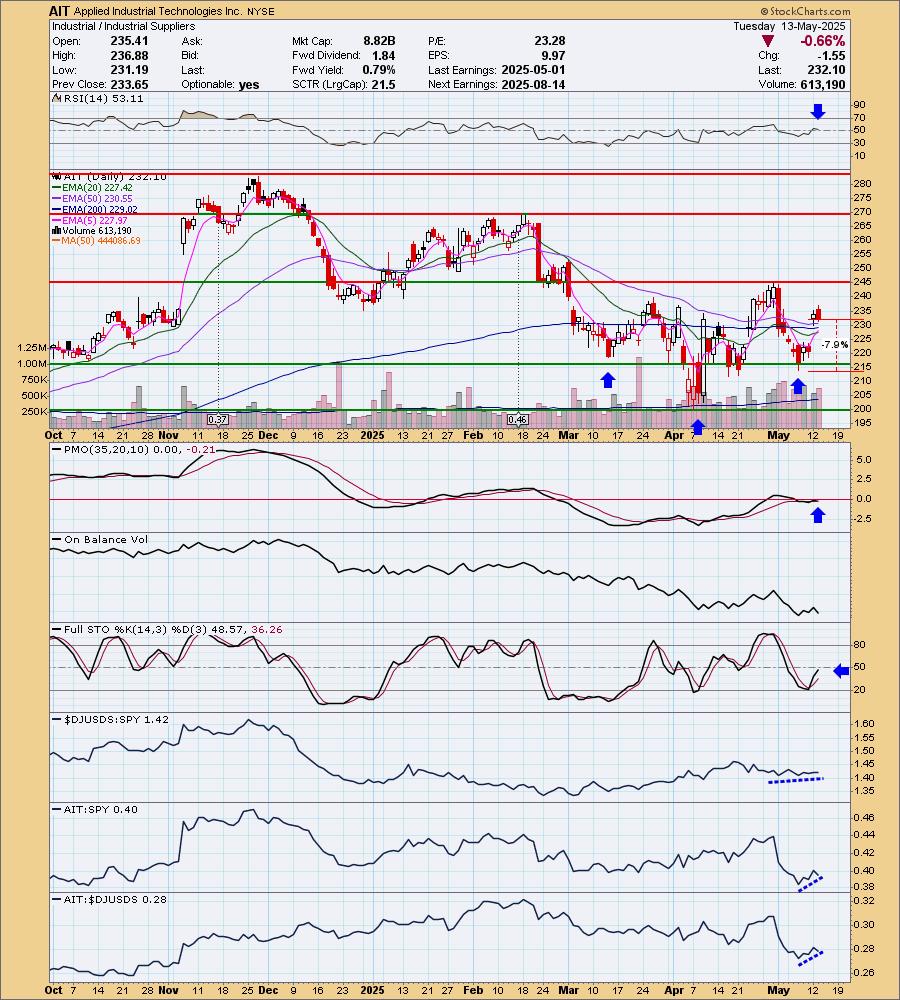
Applied Industrial Technologies Inc. (AIT)
EARNINGS: 2025-08-14 (BMO)
Applied Industrial Technologies, Inc. engages in the manufacture and distribution of industrial parts and products. It operates through the Service Center Based Distribution and Engineered Solutions segments. The Service Center Based Distribution segment is involved in local service centers and distribution centers with a focus on providing products and services addressing the maintenance and repair of motion control infrastructure and production equipment. The Engineered Solutions segment focuses on distributing, engineering, designing, integrating, and repairing hydraulic and pneumatic fluid power technologies, and engineered flow control products and services. The company was founded by Joseph Bruening in January 1923 and is headquartered in Cleveland, OH.
Predefined Scans Triggered: Bullish MACD Crossovers and Parabolic SAR Buy Signals.
AIT is unchanged in after hours trading. This is from the Sector to Watch, Industrials. I spotted a reverse head and shoulders pattern that is developing. The RSI is positive and the PMO is rising and should get above zero momentarily. Stochastics are rising. Relative strength for the group is on par with the SPY which is fine as the SPY is rallying. AIT is starting to outperform both the group and the SPY. The stop is set beneath support at 7.9% or $213.76.
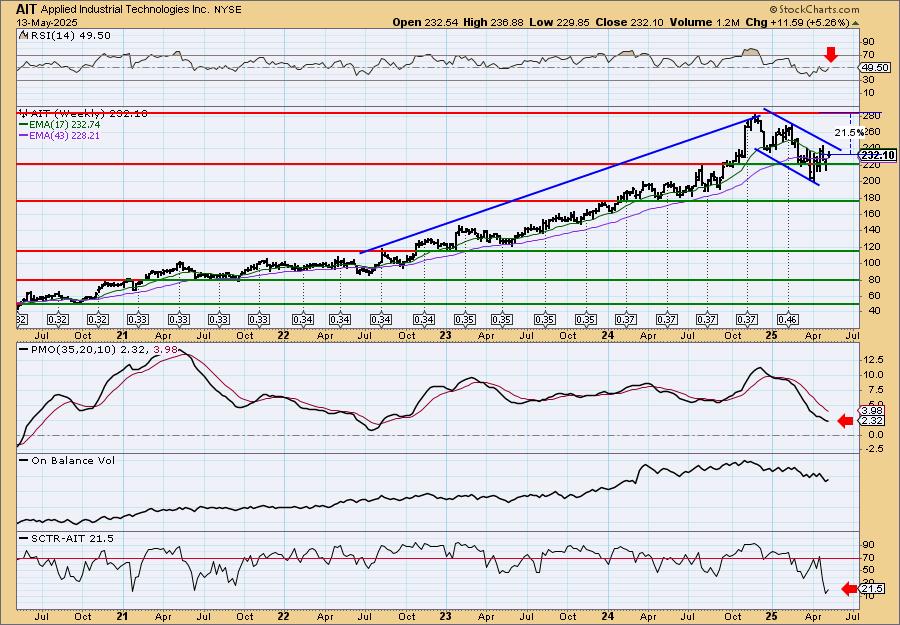
I liked the long-term bull flag on the weekly chart. We don't have the confirming breakout yet and the chart needs to mature. The weekly RSI is negative but is very close to positive territory. The weekly PMO is still in decline and the SCTR is not in the hot zone so consider a short-term trade for now.
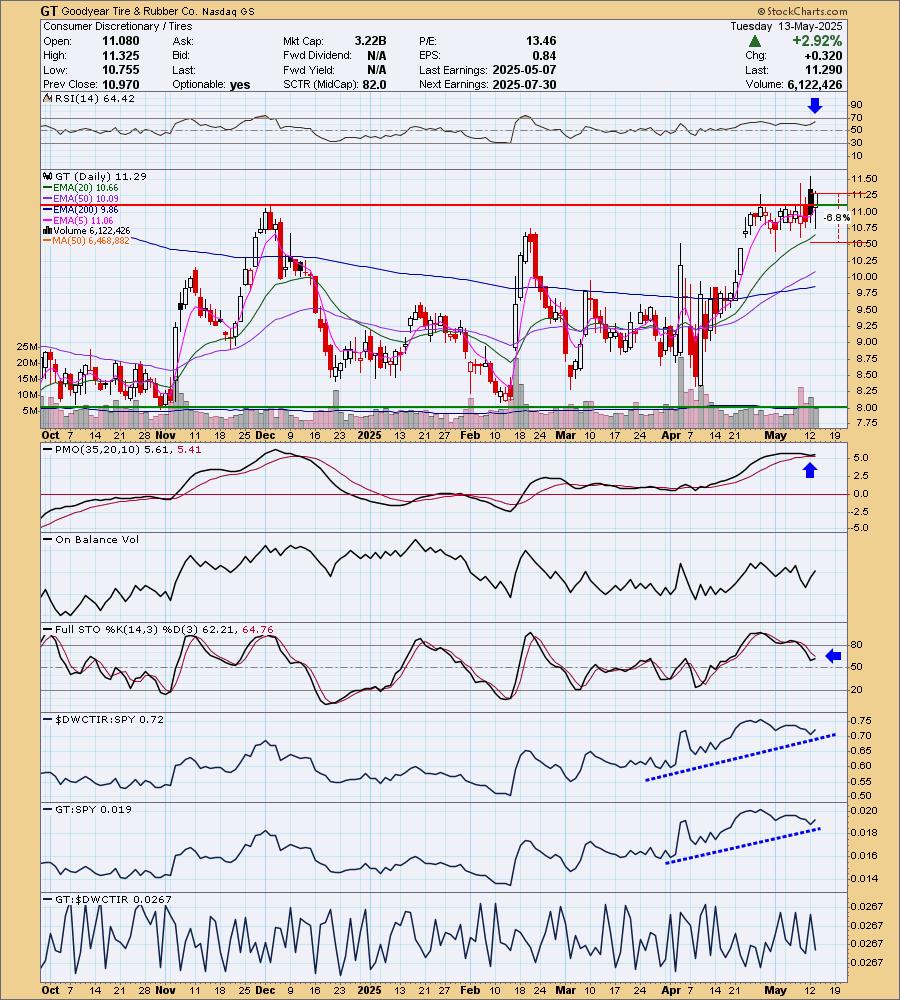
Goodyear Tire & Rubber Co. (GT)
EARNINGS: 2025-07-30 (AMC)
Goodyear Tire & Rubber Co. engages in the development, manufacture, distribution, and sale of tires. It operates through the following geographical segments: Americas, Europe, Middle East, and Africa, and Asia Pacific. The Americas segment is involved in the development, manufacture, distribution, and sale of tires and related products and services in North, Central, and South America. The Europe, Middle East, and Africa segment focuses on the development, manufacture, distribution, and sale of tires for automobiles, trucks, buses, aircraft, motorcycles, earthmoving, mining, and industrial equipment throughout Europe, the Middle East, and Africa. The Asia Pacific segment refers to the development, manufacture, distribution, and sales of tires for automobiles, trucks, buses, aircraft, farm, earthmoving, mining, and industrial equipment throughout the Asia Pacific region. The company was founded by Frank A. Seiberling on August 29, 1898 and is headquartered in Akron, OH.
Predefined Scans Triggered: P&F Triple Top Breakout, Elder Bar Turned Green and P&F Double Top Breakout.
GT is down -1.68% in after hours trading so a better entry may be available tomorrow. I liked the gently rising trend and the breakout above the December top. The RSI is positive and not overbought. The PMO has surged above the signal line. Stochastics have turned back up. Over time, relative strength has been rising, but I do note it isn't doing that great right now. I'm not sure what is wrong with the relative strength line for GT against the group, but it doesn't look right so I make no conclusions regarding what it is doing. The stop is set beneath support at 6.8% or $10.52.
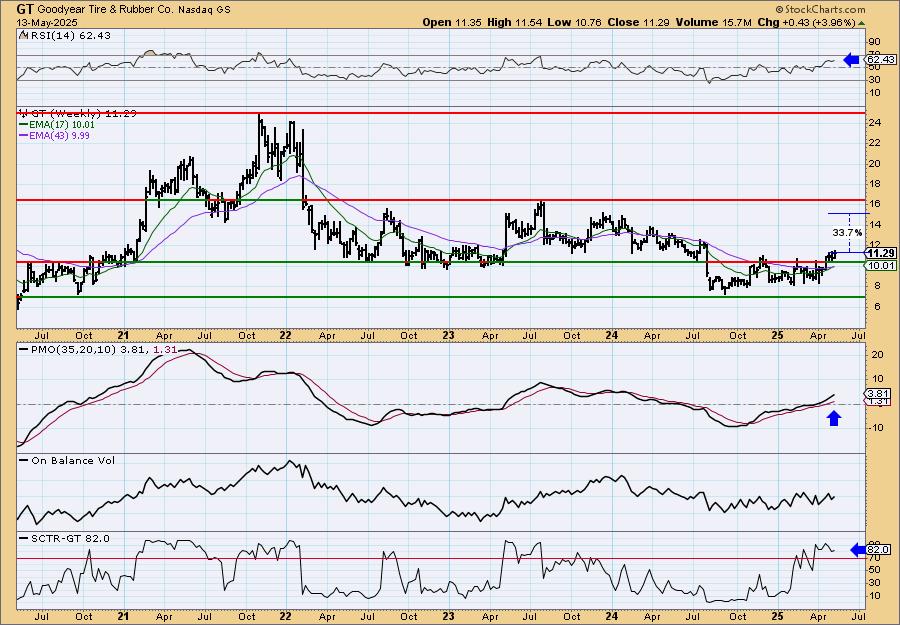
We can see a nice breakout from a recent trading range. The weekly RSI is positive and not overbought. The weekly PMO looks very bullish above the zero line. The SCTR is above 70 so this could be considered for the intermediate term.
Don't forget, on Thursdays I look at reader-requested symbols, click HERE to send me an email. I read every email I receive and try to answer them all!
Current Market Outlook:
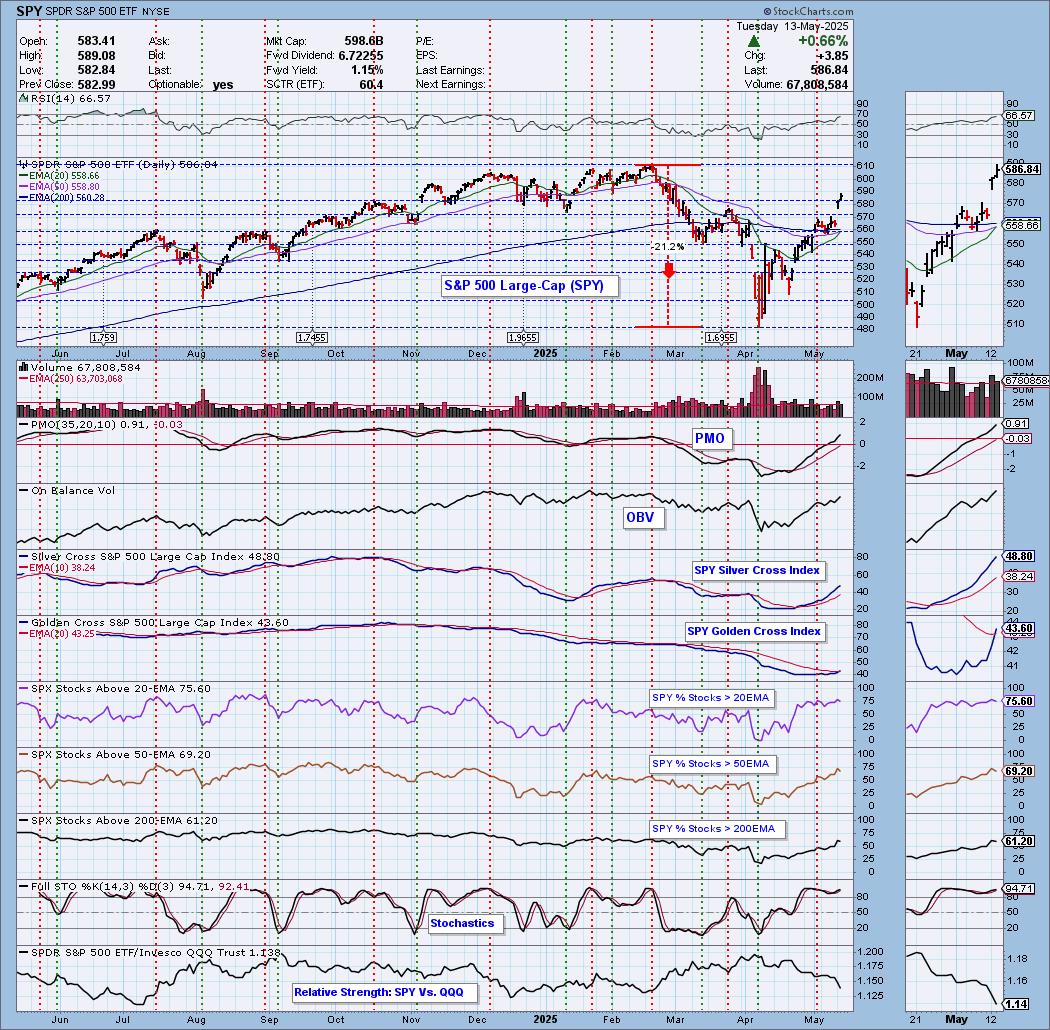
Market Environment: It is important to consider the odds for success by assessing the market tides. The following chart uses different methodologies for objectively showing the depth and trend of participation for intermediate- and long-term time frames.
- The Silver Cross Index (SCI) shows the percentage of SPX stocks on IT Trend Model BUY signals (20-EMA > 50-EMA)
- The Golden Cross Index (GCI) shows the percentage of SPX stocks on LT Trend Model BUY signals (50-EMA > 200-EMA)
Don't forget that as a "Diamonds" member, you have access to our "Under the Hood" curated ChartList on DecisionPoint.com. You'll find it under "Members Only" links on the left side on the Blogs and Links Page.
Here is the current chart:
Full Disclosure: I am 10% long, 0% short.
I'm required to disclose if I currently own a stock I mention and/or may buy/short it within the next 72 hours.
"Technical Analysis is a windsock, not a crystal ball." - Carl Swenlin
(c) Copyright 2025 DecisionPoint.com
Watch the latest episode of DecisionPoint Trading Room with Carl Swenlin & Erin Swenlin Mondays on the DecisionPoint YouTube channel here!
NOTE: The stocks reported herein are from mechanical trading model scans that are based upon moving average relationships, momentum and volume. DecisionPoint analysis is then applied to get five selections from the scans. The selections given should prompt readers to do a chart review using their own analysis process. This letter is not a call for a specific action to buy, sell or short any of the stocks provided. There are NO sure things or guaranteed returns on the daily selection of "Diamonds in the Rough."
Regarding BUY/SELL Signals: The signal status reported herein is based upon mechanical trading model signals and crossovers. They define the implied bias of the price index/stock based upon moving average relationships and momentum, but they do not necessarily call for a specific action. They are information flags that should prompt chart review. Further, they do not call for continuous buying or selling during the life of the signal. For example, a BUY signal will probably (but not necessarily) return the best results if action is taken soon after the signal is generated. Additional opportunities for buying may be found as price zigzags higher, but the trader must look for optimum entry points. Conversely, exit points to preserve gains (or minimize losses) may be evident before the model mechanically closes the signal.
Helpful DecisionPoint Links:
Price Momentum Oscillator (PMO)
Swenlin Trading Oscillators (STO-B and STO-V)
For more links, go to DecisionPoint.com